123 \volnumber3
C. Cowley, S. Hubrig and F. Castelli
Ann Arbor, MI 48109-1042, USA, 11email: cowley@umich.edu 22institutetext: ESO, Casilla 19001, Santiago 19, Chile 22email: shubrig@eso.org 33institutetext: INAF-Osservatorio Astronomico di Trieste, Via G. B.
Tiepolo 11, 34131, Trieste, Italy 33email: castelli@oats.inaf.it
Isotopic Anomalies in CP Stars: Helium, Mercury, Platinum, and Calcium
Abstract
We review the classical observational results for isotopic abundance variations for several elements in CP stars. We concentrate on the “newest” anomaly, in calcium. The cosmically very rare isotope, 48Ca can rival and even dominate the more common, alpha nuclide, 40Ca. Relevant examples are found in the hot, non-magnetic HgMn stars, and the field horizontal-branch star, Feige 86. The calcium anomaly is also present in cool, magnetic stars, including the notorious HD 101065, Przybylski’s star.
keywords:
stars:abundances – stars:chemically peculiar – stars:magnetic fields – stars:oscillations1 Introduction
The earliest observations of isotopic effects in stellar spectra were for diatomic molecules. The Michigan astronomer W. C. Rufus (1916) noted systematic absorptions in the spectra of R stars that we now know were due to differing isotopic species in the Swan bands of C2. At the time, the Swan bands were known to be due to carbon, but the identification with the C2 molecule was made some ten years later (see Sanford 1932). By the late 1940’s, Andrew McKellar (1948) was able to make a systematic survey of the 12C/13C ratio in carbon stars by a study of the molecular bands.
The deuterium analog of the famous 21 cm radio line of neutral hydrogen was observed in the 1960’s (Weinreb 1962). The most extensive observations of isotopic spectra are for interstellar molecules. The field was already mature several decades ago (cf. Wanneir 1980; Wilson and Rood 1994).
2 3He in stellar spectra
Investigations of atomic lines for possible isotopic variations also date from in the middle of the 20th Century. Greenstein (1951) sought evidence for 3He in the solar spectrum, using laboratory wavelengths of Fred, et al. (1951), while the Burbidges (1956) sought the same isotope in the magnetic CP star, 21 Aql.
The first secure identification of 3He in a stellar spectrum was made by Sargent and Jugaku (1961). These authors found 3He in the spectrum of 3 Centauri A. Hartoog and Cowley (1979) studied a number of stars for which 3He had been reported. They listed 8 stars where the presence of 3He was definite, and another three probable cases. Among the field stars, 3He is rare, and cases with virtually pure 3He are rarer still.
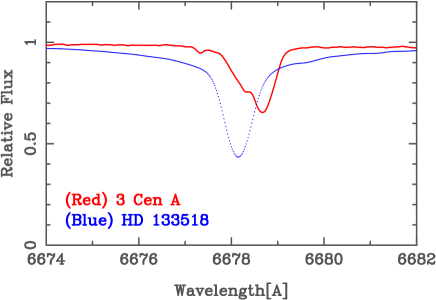
Fig. 1 shows a modern plot of the 6876 line of He I in 3 Cen A and the sharp-lined early B-star HD 133518. The half-angstrom isotope shift is easily seen in 3 Cen A. Most of the 3He stars show a mixture with 4He. One cannot, of course, make a credible case for the presence of an exotic species on the basis of a single wavelength measurement. Sargent and Jugaku compared the wavelengths of 10 He I lines in 3 Cen A and the B2 IV, MK standard, Peg. Fig. 2 is a similar plot based on the UVESPOP spectrum, using the same He I lines as Sargent and Jugaku; we took laboratory wavelengths rather than stellar as standards.

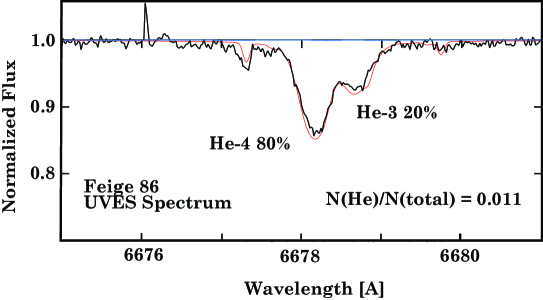
Hartoog (1979) noted that many of the abundance anomalies 3 Cen A were shared by the field horizontal branch star Feige 86. He obtained spectra of the latter star, and found that it did indeed have an excess of 3He. A modern spectrum is shown in Fig. 3.
Heber (1991) discusses the behavior of 3He in a number of horizontal branch stars. Some have nearly pure 3He.
3 Isotopic anomalies in mercury and platinum
W. P. Bidelman (2000) gives a historical account of his identification of a strong line at 3984 as Hg II in the stars now known as HgMn, or mercury-manganese stars. Interestingly, it was the spectrum of a related star, 53 Tau, that greatly strengthened the identification. In fact, the laboratory Mn II spectrum was poorly known, prior to the work of Iglesias and Velasco (1964). Thus, in 1962, the year of Bidelman’s discovery, it seemed possible the 3984 line was due to an unclassified line of Mn II. But 53 Tau showed this could not be, since the 53 Tau spectrum was replete with strong Mn II lines, but lacked 3984. There was no plausible candidate for the identification in the astronomical spectroscopist’s Bible, the Multiplet Tables (Moore 1945). Bidelman (1962) made the identification with the help of the MIT Wavelength Tables (Harrison 1939). But it turns out there were a number of Hg lines (not all designated as Hg II) near 3984 Å, and Bidelman learned, in a conversation at a meeting with the physicist Richard W. Shorthill, that these lines were due to isotopes of mercury. This exciting new piece of information was first published in the popular magazine, Sky and Telescope (Federer 1962).
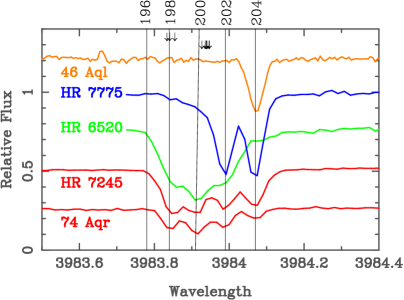
The large shifts of Hg II 3984 are caused by nuclear volume effects. There are small changes in the volume of nuclei with differing neutron numbers. These are sufficient to modify the electrostatic potential, causing the energy differences that give rise to the measurable wavelength shifts. A few examples are shown in Fig. 4. Many additional cases, including the notorious manganese star without 3984, 53 Tau, are illustrated in the extensive study by Woolf and Lambert (1999).
Bidelman (2000) wrote that his confidence in the 3984 identification was bolstered by the presence of some Hg I lines in cooler manganese stars. Three permitted lines form Multiplet 1 in Moore’s (1945) famous tables. The transition is . The lines decrease in relative intensity from the strongest, 5461, to the intermediate 4358, to 4046, the weakest of the three. The situation was not happy, however, because the stellar features did not follow the laboratory intensities. The 4046 line was too strong. In a review of manganese and related stars, Aller and Ross (1967) referred to 4046 as a line “attributed to Hg I.” Various speculations blamed the anomalous intensity on non-LTE or bad oscillator strengths.
The puzzle over 4046 was resolved by Dworetsky (1969), who identified Pt II in HR 4072, noting the spectrum was also present in CrB, and Lup. The strongest of the Pt II lines has a laboratory wavelength of 4046.45 Å, so that it is often closely blended with the Hg I line at 4046.56 Å. Both lines are subject to isotope shifts, already suggested by Dworetsky. Soon thereafter, Dworetsky and Vaughan, Jr. (1973) strengthened the case for isotopic variations in Pt. Definitive measurements of isotopic shifts in the laboratory were made by Engleman (1989).
Hubrig, Castelli, and Mathys (1999) were able to determine specific isotopic abundances of Pt II in three stars. Their results are summarized in our Tab. 1, a shortened version of their Tab. 6. It shows, as Dworetsky and Vaughan had pointed out, the isotopic mixtures were dominated by the two heaviest stable isotopes–196Pt and 198Pt.
| Isotope | Terrestrial | HD 35548 | HD 141556 | HD 193452 |
|---|---|---|---|---|
| abundance | HR1800 | Lup | HR 7775 | |
| 190 | 0.01 | 0.00 | 0.00 | 0.00 |
| 192 | 0.79 | 0.00 | 0.00 | 0.00 |
| 194 | 32.9 | 0.00 | 0.00 | 0.00 |
| 195 | 38.3 | 0.00 | 0.00 | 17.5 |
| 196 | 25.2 | 0.00 | 10.00 | 55.00 |
| 198 | 7.19 | 100.0 | 90.00 | 27.50 |
| / | -10.24⊙ | -6.84 | -6.24 | -5.65 |
4 Difficult isotopic determinations
In this section we briefly note two fascinating isotopic variations. They share requirement of the best observational material and the most careful reductions.
4.1 Thallium in Lup
Leckrone, et al. (1996) have found evidence for a non-solar isotope ratio of the two stable thallium isotopes in the HgMn star Lup. This was the first star discovered to have nearly pure 204Hg, and it was one of several stars discussed by Dworetsky and Vaughan (1973) as probably having an excess of the heavy isotopes of platinum. It is therefore reasonable that other isotopic anomalies might manifest themselves in Lup.
Only two lines of Tl II near 1909 were identified by Leckrone and coworkers in the GHRS spectrum of Lup. Both stable isotopes, 203Tl and 205Tl have nuclear spin 1/2. The observed lines arise in the hyperfine doublet of the intersystem transition . Because of the configuration of the lower level, one expects sensitivity to nuclear volume. However, the isotopic shifts were measured in the laboratory, and for both lines are only about 10 miliangstroms (0.0093 and 0.0105 Å). In addition, one of the lines is clearly blended, so the assertion of an isotopic shift rests primarily on a single line.
The difficulty of the determination is further enhanced because neither isotope dominates, so not even the full Tl isotopic shifts are measured. In a tour de force discussion Leckrone and coworkers nevertheless made a credible case for a non-standard isotopic ratio.
4.2 Lithium isotopes in Przybylski’s star.
Most stellar observations of lithium have been made on the close, D-like, resonance transitions near 6708 Å. There are two stable isotopes, 6Li (spin 1), and 7Li (spin 3/2). However, the hyperfine splitting is less important than the Zeeman effect, given a surface field of the order of 3kG. Approximate wavelengths are shown in Tab. 2 for the 4 D-like transitions: D2 is with (pure LS) relative intensity 2, while D1 is with relative intensity 1. In the table, the relative intensities are for equal isotopic abundances. Precise wavelengths are given by Das and Natarajan (2007).
| Isotope | Transition | Int | [Å] |
|---|---|---|---|
| 7Li I | D2 | 2 | 6707.76 |
| 7Li I | D1 | 1 | 6707.92 |
| 6Li I | D2 | 2 | 6707.92 |
| 6Li I | D1 | 1 | 6708.07 |
When one considers that Zeeman components are split by 0.1 to 0.2 Å, and that the region is also blended, the difficulty of the determining the relative contribution of the isotopes is apparent.
Polosukhina and her colleagues (Polosukhina et al. 2004) described an international project to study lithium in cool Ap stars. These workers have published 6Li/7Li ratios in several stars (cf. Shavrina, et al 2004).
5 Heavy calcium in HgMn and magnetic Ap stars
Castelli and Hubrig (2004) announced the identification of unusual isotopic mixtures of Ca in HgMn stars. The determination was possible because of large specific mass shifts in the lines of the infrared triplet (IRT). Nörtershäuser, et al. (1998) discussed the laboratory shifts of all 5 stable isotopes. The largest shifts occur for 48Ca. To within 5%, all three IRT lines of 48Ca II are shifted by 0.2 Å with respect to lines from 40Ca II. The largest shifts are easily measurable.
Cowley and Hubrig (2005) found similar shifts of IRT lines in Ap stars of the magnetic sequence. Cowley, et al. (2007, henceforth, CHCGW) discussed Ca isotopic shifts in nearly 70 stars including an Am, and FmDel, an N star and a weak Barium II star. Most (non-Ap) stars, including the sun, show small shifts with respect to the laboratory positions for a terrestrial mixture. The meaning of the small shifts is unclear, but may be related to the saturation of stellar lines relative to laboratory measurements.
Small displacements of stellar wavelengths are typically caused by blends. Blending is highly likely in the complex spectra of CP stars. Even with the relatively simple HgMn spectra, we have noted the unusual coincidence of lines of Hg I with Pt II. An indisputable case for isotopic anomalies requires a demonstration based on a number of wavelength shifts in agreement with predictions (cf. Fig. 2). At the time of the initial discovery, many of the ESO observations missed the strongest line 8542 of the IRT because of an order gap in the echelle spectra. After reconfiguration of the UVES spectrograph in November 2004, it was possible to show that all three lines had shifts commensurate with heavy calcium isotopes.
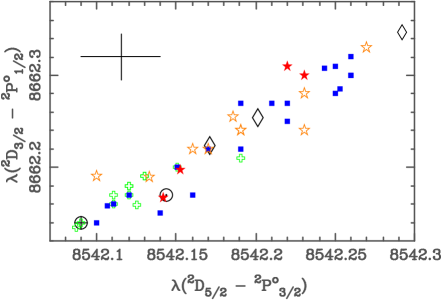
Fig. 5 shows that the displacements of the 8542 and 8662 lines are closely correlated.
In our work, we have assumed it impossible to distinguish between weighted mixtures of 40Ca and 48Ca, and lines from pure isotopes with intermediate weights. Ryabchikova and her colleagues (cf. Ryabchikova 2005, and also her Review, these proceedings) have made careful syntheses of the weakest IRT line, 8498, and find evidence not only of vertical stratification, but isotopic separations. In those stars with minimal Zeeman broadening, the core of the 8498 line is displaced to the red with respect to the wings. This may be explained if the heavy isotope is pushed to the highest atmospheric levels, while the deepest layers may have a nearly solar mixture–primarily 40Ca.
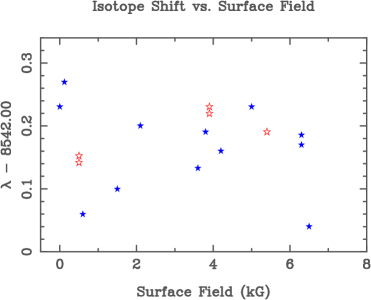
These workers also noted that several stars with surface fields larger than 5 kG had little or no displacement of the 8498 core. They suggested this was a general trend that might be explained if the calcium isotopes were influenced by light induced drift. The effect was found independently by CHCGW who pointed out two complications with the overall trend. One star in particular, HD 154708, has the highest magnetic field of any stars investigated so far (Hubrig, et al. 2005). Nevertheless, its IRT lines show significant shifts indicating heavy calcium. Additionally, a plot of shift of the strongest line, 8542 vs. surface field shows no trend (even if the wildly discordant point for HD 154708 is omitted). This is shown in Fig. 6
6 Regularities and relationships of isotopic anomalies
The intrinsic strength of the IRT makes it possible to observe isotopic shifts over a wide range of effective temperatures. Other anomalies are recognized in much narrower domains. It is unclear to what extent this is due to the physical mechanisms that produce the anomalies or to selection effects. Obviously, for example, 3He-stars could not be found among the CP stars whose atmospheres are too cool to have detectable He I lines.
CHCGW looked for correlations of the calcium and mercury anomalies. No trend is seen for the HgMn stars (CHCGW Fig. 4). The Hg II 3984 line is surely present in some magnetic CP stars, but the line spectrum is too badly blended for credible inferences about the isotopic composition of mercury.
Preston and colleagues (cf. Preston, et al. 1971) noted a general tendency for the heavier Hg isotopes to be found in the coolest HgMn stars. CHCGW found that when a wider class of objects was examined, the overall correlation degenerated. For example, the hottest star for which they measured 3984, Feige 86, showed a very large wavelength shift, indicating 204Hg (cf. their Fig. 5).
CHCGW measured IRT shifts in stars with temperatures ranging from 6600 to 13600K. There is no overall systematic trend of Ca isotopic shifts with temperature. Weak correlations may exist separately, and in the opposite sense for magnetic and non-magnetic CP stars (cf. their Fig. 6).
References
- [1] Aller, L. H., and Ross, J. 1967, in The Magnetic and Related Stars, ed. R. C. Cameron (Baltimore: Mono Book), p. 339
- [2] Bagnulo, S., Jehin, E., Ledoux, C., Cabanac, R., Melo, C., Gilmozzi, R., The ESO Paranal Science Team 2003, ESO Mess., 114, 10
- [3] Bidelman, W. P. 2000, in The Kth Reunion: Proceedings of a meeting held at Case Western Reserve University, 2-3 May, 1998, ed. A. G. Davis Philip, Cont. Inst. Sp. Obs. No. 18 (Schenectady, NY: L Davis Press), p. 61
- [4] Bidelman, W. P. 1962, AJ, 67, 11
- [5] Burbidge, E. M., and Burbidge, G. R. 1956, \aaa, 124, 655
- [6] Castelli, F., and Hubrig, S. 2004, \aaa, 421, L1
- [7] Cowley, C. R., and Hubrig, S. 2005, \aaa, 432, L21
- [8] Cowley, C. R., Hubrig, S., Castelli, F., González, and Wolff, B. 2007, MNRAS, 377, 1579 (CHCGW)
- [9] Das, D., and Natarajan, V. 2007, Phys. Rev. A, 75, 052508
- [10] Dworetsky, M. M. 1969, ApJ, 156, L101
- [11] Dworetsky, M. M., and Vaughan, A. H. Jr. 1973, ApJ, 181, 811
- [12] Engleman, R. J., 1989, ApJ, 340, 1140
- [13] Federer, C. A. 1962, Sky and Telescope, 23, 140
- [14] Fred, M., Tomkins, F. S., Brody, J. K., and Hammermesh, M. 1951, Phys. Rev., 82, 406
- [15] Greenstein, J. L. 1951, ApJ, 113, 531
- [16] Harrison, G. R. 1939, MIT Wavelength Tables, (New York: Wiley)
- [17] Hartoog, M. R. 1979, ApJ, 231, 161
- [18] Hartoog, M. R., and Cowley, A. P. 1979, ApJ, 228, 229
- [19] Heber, U. 1991, in Evolution of Stars: The Photospheric Abundance Connection, ed. G. Michaud and A. Tutukov, IAU Symp. 145, 363.
- [20] Hubrig, S., Castelli, F., and Mathys, G. 1999, \aaa, 341, 190
- [21] Hubrig, S., Nesvacil, N., Scholler, M., and Mathys, G., \aaa, 440, L37
- [22] Iglesias, L., and Velasco, R. 1964, Pub. Inst. Opt. Madrid, No. 23.
- [23] Kurtz, D. W., Elkin, V. G., and Mathys, G. 2007, \aaa, 380, 741
- [24] Leckrone, D. S., Johansson, S., Kalus, G., Wahlgren, G. M., Brage, T., and Profitt, C. R. 1996, ApJ, 462, 937
- [25] McKellar, A. 1948, Pub. Dom. Ap. Obs., 7, 395
- [26] Moore, C. E. 1945, Cont. Princeton Univ. Obs., No. 20
- [27] Nörtershäuser, W., Blaum, K., Icker, K., Müller, Schmitt, A., Wendt, K., and Wiche, B. 1998, Eur. Phys. J., 2, 33
- [28] Polosukhina, N., Shavrina, A., Drake, N., Tsymbal, V., Hack, M., North, P., Khalack, V., Zverko, J., Z̆iz̆novský, and Pavlenko, Ya. 2004, in The A-Star Puzzle, IAU Symposium 224, ed. J. Zverko, J. Z̆iz̆novský, S. J. Adelman, and W. W. Weiss (Cambridge: University Press), 507 (Poster: FP7)
- [29] Preston, G. W., Vaughan, A. H., White, R. E., Swings, J-P. 1971, PASP, 83, 607
- [30] Rufus, W. C. 1916, Pub. Obs. U. Mich., 2, 136
- [31] Ryabchikova, T. 2005, in Element Stratification in Stars: 40 Years of Atomic Diffusion, ed. G. Alecian, O. Richard, and S. Vauclair, ESA Pub. Ser., 17, 253.
- [32] Ryabchikova, T. 2008, this volume
- [33] Sanford, R. F. 1932, PASP, 44, 246
- [34] Sargent, W. L. W., and Jugaku, J. 1961, ApJ, 134, 777
- [35] Shavrina, A., Poloshkhina, N., Khan, S., Pavlenko, Ya., Khalack, V., Wade, G. A., Quinet, P., Mikhailitska, N., Yushchenko, A., Gopka, V., Hatzes, A., Mkritchian, D., and Veles, A. 2004, in The A-Star Puzzle, IAU Symposium 224, ed. J. Zverko, J. Z̆iz̆novský, S. J. Adelman, and W. W. Weiss (Cambridge: University Press), 507 (Poster: FP14), arXiv:astro-ph/0409116v1
- [36] Wannier, P. G. 1980, Ann. Rev. Astron. Ap., 18, 399
- [37] Weinreb, S. 1962, Nature, 195, 367
- [38] Wilson, T. L., and Rood, R. 1994, Ann. Rev. Astron. Ap., 32, 191
- [39] Woolf, V. M., and Lambert, D. L. 1999, ApJ, 521, 414