Infall of Substructures onto a Milky Way-like Dark Halo
Abstract
We analyse the dynamical properties of substructures in a high-resolution dark matter simulation of the formation of a Milky Way-like halo in a CDM cosmology. Our goal is to shed light on the dynamical peculiarities of the Milky Way satellites. Our simulations show that about 1/3 of the subhalos have been accreted in groups. We quantify this clustering by measuring the alignment of the angular momentum of subhalos in a group. We find that this signal is visible even for objects accreted up to , i.e. 8 Gyr ago, and long after the spatial coherence of the groups has been lost due the host tidal field. This group infall may well explain the ghostly streams proposed by Lynden-Bell & Lynden-Bell to orbit the Milky Way. Our analyses also show that if most satellites originate in a few groups, the disk-like distribution of the Milky Way satellites would be almost inevitable. This non-random assignment of satellites to subhalos implies an environmental dependence on whether these low-mass objects are able to form stars, possibly related to the nature of reionization in the early Universe. With this picture, both the “ghostly streams” and the “disk-like configuration” are manifestations of the same phenomenon: the hierarchical growth of structure down to the smallest scales.
keywords:
methods: numerical - Galaxy: formation - galaxies: dwarf - galaxies: kinematics and dynamics - dark matter.1 Introduction
In cold dark-matter (CDM) cosmologies, large galaxies are the result of the aggregation of smaller subunits. Some of these subunits may survive until the present day in the form of satellites, while some may be completely destroyed in the course of time, and contribute to the field. In -body CDM simulations of the formation of galaxy-size dark-matter halos, the satellites (often referred to as substructures or subhalos) show significantly different properties than those of the “luminous” satellites around galaxies like the Milky Way. An example of this discrepancy is the “missing satellite problem”: subhalos outnumber the bright satellites by factors of a hundred or more (Kauffmann, White & Guiderdoni, 1993; Klypin et al., 1999; Moore et al., 1999). Furthermore, their spatial distribution is typically much shallower than observed for the luminous satellites (Gao et al., 2004a; Taylor, Babul & Silk, 2004). Therefore, the relation between resolved substructures/subhalos in dark matter simulations and the luminous satellites in galaxy halos is still unclear. Attempts to reconcile these two populations, using semi-analytic models of galaxy formation (Kauffmann, White & Guiderdoni, 1993; Benson et al., 2002; Kravtsov, Gnedin & Klypin, 2004) or full-fleshed SPH-simulations (Macciò et al., 2006; Libeskind et al., 2007) have produced interesting results, and helped us gain insight into the relevant processes on the smallest galactic scales.
In the past ten years new attention has been drawn to the properties of the satellite population in the Local Group. Starting with Lynden-Bell & Lynden-Bell (1995), the existence of ghostly streams of satellites (dwarf galaxies and globular clusters) was proposed. These objects would share similar energies and angular momenta producing a strong alignment along great circles on the sky (Palma, Majewski & Johnston, 2002). Recently, it has been argued that the MW satellites define a disk-like structure, that is so highly flattened (rms thickness of kpc) that may at first sight be inconsistent with CDM models (Kroupa, Theis & Boily, 2005; Metz, Kroupa & Jerjen, 2007). However, sophisticated modelling combining semi-analytic galaxy formation recipes with dark matter simulations has produced results that are consistent with observations (Kang et al., 2005; Libeskind et al., 2005; Zentner et al., 2005).
In the past two years, about a dozen low surface brightness dwarf satellite galaxies around the MW have been found in the Sloan Digital Sky Survey (Willman et al., 2005a, b; Belokurov et al., 2006, 2007; Zucker et al., 2006a, b; Irwin et al., 2007). This is an increase by a factor of two in the number of known satellites. Because of the strong selection bias (SDSS focus is on the north galactic pole), it is unclear whether these satellites confirm the flattened disk-like structure. It is also unclear whether they help solve the missing satellite problem (Simon & Geha, 2007). Satellites around M31 also show peculiarities in their distribution, such as an excess of objects on the side closest to the Milky Way (McConnachie & Irwin, 2006), and possibly a similar degree of alignment (Koch & Grebel, 2006).
These facts have motivated us to revisit the distribution and properties of the subhalo population in CDM simulations. In particular, here we focus on the infall of substructures onto a Milky-Way like dark matter halo in a CDM cosmogony. We use a high-resolution dark-matter simulation that is a variant of the GA series (Stoehr et al., 2002; Stoehr, 2006) as described in Section 2.1. We find evidence of group infall onto the MW-like halo, which may explain the ghostly streams proposed by Lynden-Bell & Lynden-Bell (1995). This is discussed in Section 2.2. In Section 2.3 we show that the disky configuration of satellites is consistent with CDM if most satellites have their origin in a few groups. Thus both the “ghostly streams” and the “planar configuration” are manifestations of the same phenomenon: the hierarchical growth of structure down to the smallest galactic scales. We present our conclusions in Section 3.
2 Subhalos in the dark matter simulations
2.1 Description of the simulations
We have analysed the GAnew series of high resolution simulations of a MW-like halo (Stoehr, 2006). The simulations were carried out with GADGET-2 (Springel et al., 2001). The halo was selected from the M3 CDM series (see Ciardi, Stoehr & White, 2003) with cosmological parameters , and Hubble constant H0=100 km s-1 Mpc-1. Candidate halos in this simulation were selected according to the following criteria: i) well-resolved, with particles; ii) environment similar to the Local Group (free from nearby rich galaxy clusters); iii) peak circular velocity approximately 220 km s-1, and iv) no major merger since (see Gilmore, Wyse & Norris, 2002). After choosing the best MW-like halo, the zoomed initial conditions technique (Tormen, Bouchet & White, 1997) was used to produce a higher resolution simulation. The MW-like halo was simulated four successive times with the mass resolution increased by a factor each time. In the highest mass resolution simulation (GA3new), there are approximately particles within the virial radius. Each of these re-simulations produced 60 outputs equally spaced in between and . Table 1 summarises the parameters and properties of the GAnew series.
Virialised structures were identified in the high-resolution region of the simulation using the standard friends-of-friends algorithm linking particles separated by less than of the mean interparticle separation. The SUBFIND algorithm (Springel et al., 2001) was then applied to each FOF group to find the gravitationally self-bound subhalos. The smallest resolved subhalo contains 10 particles, and its mass is in GA2new and in GA3new. The number of subhalos present in the final output is for GA2new and increases to for GA3new. The virial mass of the MW-like halo is and the virial radius is kpc at present time in GA3new.
| Name | [] | NHR | zstart | [ kpc] |
|---|---|---|---|---|
| GA0new | 1.677 | 68 323 | 70 | 1.4 |
| GA1new | 1.796 | 637 966 | 80 | 0.8 |
| GA2new | 1.925 | 5 953 033 | 90 | 0.38 |
| GA3new | 2.063 | 55 564 205 | 60 | 0.18 |
2.2 Group Infall of Dark Matter Substructures
2.2.1 Infall pattern
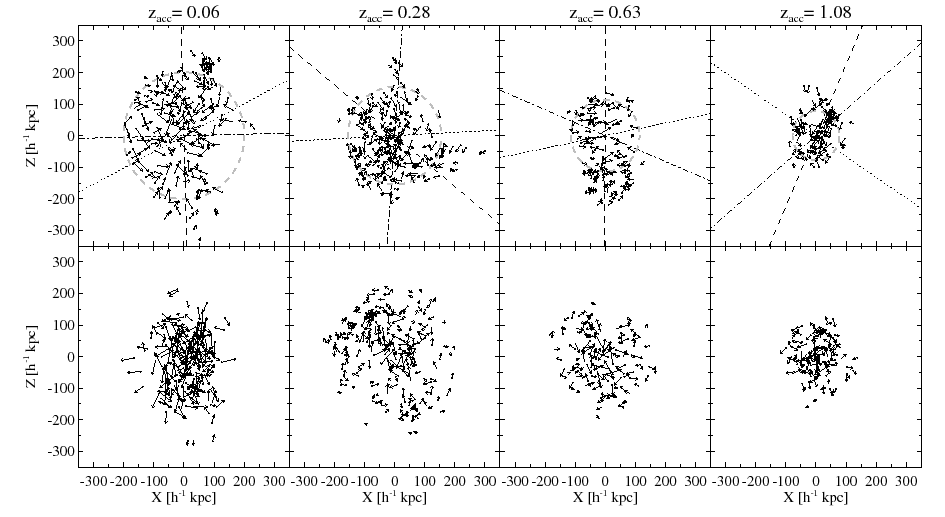
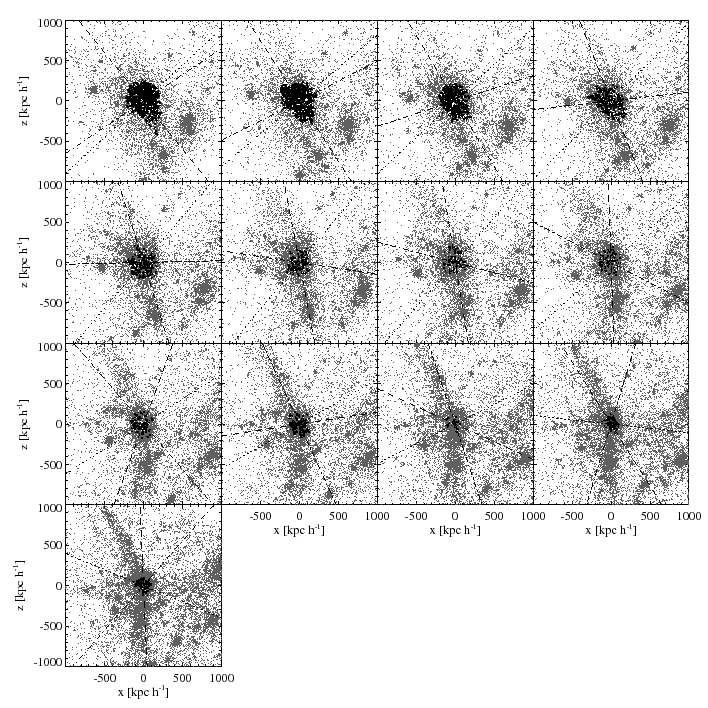
The bottom panels of Fig. 1 show the present-day spatial distribution of subhalos accreted at four different redshifts () in GA3new. We use the most bound particle of a subhalo to represent its position and velocity. The accretion epoch of a subhalo is determined as the time when its most-bound particle becomes part of the FOF group in which the MW-like halo is located. The reference frame used in Fig. 1 is defined by the principal axes of the MW-like halo. Its principal axes have been determined by diagonalising the inertia tensor
| (1) |
where is the coordinate of the th particle with respect to a reference frame centred on the main halo, , and are its coordinates in the principal axes frame (Dubinski & Carlberg, 1991; Zentner et al., 2005). We only consider particles with , and iterate until and have changed by less than . The present time minor-to-major axis ratio of the MW-like halo is , and it has changed by less than 5% over the last 3 Gyr.
The top row of Fig. 1 shows the spatial distribution of subhalos at the time they were accreted onto the MW-like halo. The (grey) dashed circles in top panels show the virial radius at that epoch. There are and subhalos which have survived until present time that were accreted at and respectively. Note that in the first column, we plot for clarity only the first most massive subhalos accreted at .
The distribution of subhalos is elongated roughly along the direction of the major axis of the MW-like halo at each epoch. The projected major axis orientations of subhalos accreted at a given epoch are indicated by the dashed lines in Fig. 1. These are computed using Eq. (1) but without resampling111When the number of subhalos is small, as in the right panel of Fig. 1, an iterative procedure quickly leads to a sample with too few points, and hence to unreliable results.. The alignment between the host and the subhalo’s major axes is prominent except for the snapshot. At this time the accreted subhalos are much more isotropically distributed, preventing a clean determination of the orientation of the principal axes of inertia (since the intermediate-to-major axis ratio is 0.98).
Fig. 1 also shows that the distribution of subhalos is clumpy on small scales. These clumps are formed by subhalos sharing similar velocities (as shown by the arrows in this figure). This indicates that infall does not occur in isolation but in groups. This is very reminiscent of the way that clusters of galaxies grow through the mergers of groups, residing in the intersections of filaments (e.g. Knebe et al., 2004). What we are seeing here is that also galaxy-size halos grow via accretion of “subgroup”-size structures.
The clumps of subhalos seen in Fig. 1 share essentially the same angular momentum at the time of infall. This implies that, even if the spatial clustering is less prominent after a few orbits inside the main halo, the lumpiness may still be present in the space of angular momenta, provided these are nearly conserved.
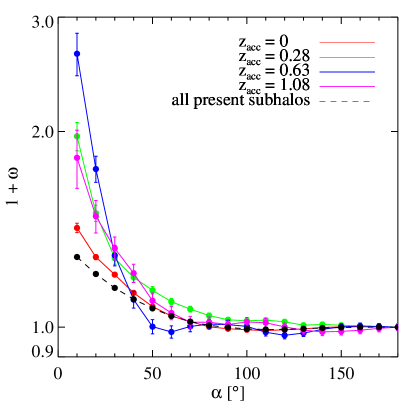
We quantify the degree of clustering by computing the two-point “angular correlation function”, , of the present-day angular momentum of our subhalos. The angle is defined by the relative orientation of the angular momenta of any two subhalos, i.e. ). Therefore the correlation function measures the number of pairs with compared to the expectations of an isotropic distribution. To compute the expected number of random pairs we average over realisations of a uniform distribution on the sphere, whose size is given by the number of “observed” data points. Note that any small scale clustering in angular momentum such as observed in Fig. 1 should manifest itself as an excess of pairs with small angular separations.
Fig. 2 shows the two-point “angular correlation function” computed using the present-day angular momentum of subhalos in our simulations. Different colours correspond to subhalos accreted at different epochs. We see a clear excess of pairs with angular momentum orientation separation less than (and up to ) compared to random samples. This implies that the signature of group infall is preserved in angular momentum even after many Gyrs of evolution. This signal is still discernible even for subhalos accreted at . The correlation function calculated with all surviving subhalos at present is showed as the (black) dashed line.
2.2.2 Properties of groups
We now focus on the characteristics of the groups accreted at the various epochs. To identify groups we link pairs of infalling halos whose angular momentum orientations are separated by and with relative distances kpc at the time of accretion. We found that this combination of and values results in a robust set of groups, maximizing their extent while minimizing the number of spurious links.
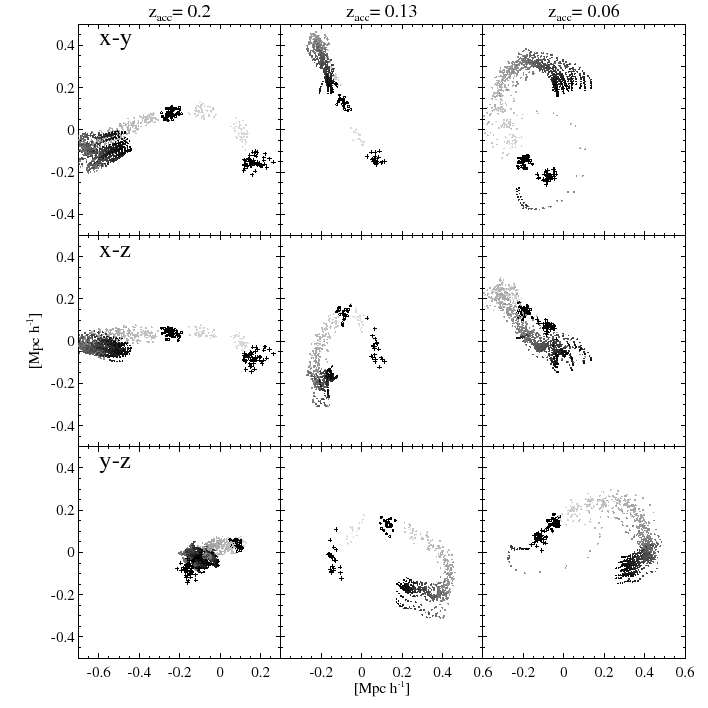
We follow the orbits of the groups identified from redshift until present time. Fig. 3 shows the trajectories of some of the richest groups of subhalos, which were accreted 2.43, 1.65 and 0.84 Gyrs ago respectively. Each dot represents the position of a subhalo colour coded from high-redshift (dark) to the present (light-grey). The crosses correspond to the present-day positions while those at the time of accretion are shown as open circles. Fig. 3 clearly shows that the groups of subhalos follow nearly coherent orbits as early as , long before the time of accretion.


The characteristic size of the groups can be measured by computing the number function of groups, i.e. how many groups have a given number of subhalos. Fig. 4 shows the number function of groups accreted in the four most recent snapshots: present time, 0.84, 1.65, and 2.43 Gyrs ago. As can be seen from this Figure, the shape is quite similar at all times, and most of the groups have a small number of members.
Fig. 5 shows the differential mass function of the groups in Fig. 4 down to our resolution limit (the dashed line, which corresponds to ). Once again we find very similar power-law shapes for the mass functions at different epochs. This power-law shape is reminiscent of the differential mass function of subhalos in cluster and galaxy-size dark matter halos. The slope of the fitted relation is . Note that this is somewhat shallower than that found for subhalos, where (Stoehr et al., 2003; De Lucia et al., 2004; Gao et al., 2004b). This could well be due to insufficient mass resolution: the fact that we are not resolving subhalos below , implies that many subhalos are accreted in isolation, instead of in pairs or in groups. This effect is much stronger at the low mass end of the group mass spectrum. For example, a group with total mass can consist of ten subhalos of or two of . On the other hand a group of can only be the result of a pair of subhalos of in our simulation.
Our limited resolution also prevents us from quantifying the mass function inside the groups. Nevertheless, and for our largest groups we find that these are dominated by a few massive subhalos and many small ones.
The group infall that we have been detecting in our simulation may well be related to the ghostly streams reported by Lynden-Bell & Lynden-Bell (1995). The presence of satellites (dwarf galaxies and globular clusters) sharing a common orbital plane seems rather plausible in the context discussed here. Instead of the disruption of a large progenitor (Lynden-Bell & Lynden-Bell, 1995) or the tidal formation of satellites within gas-rich major mergers (Kroupa, 1997), we would be witnessing the disruption by the tidal field of the Milky Way of a “sub-group”-size object composed by dwarf galaxies. The possible implications of this finding are discussed in the Conclusions.
2.2.3 Link to the Environment
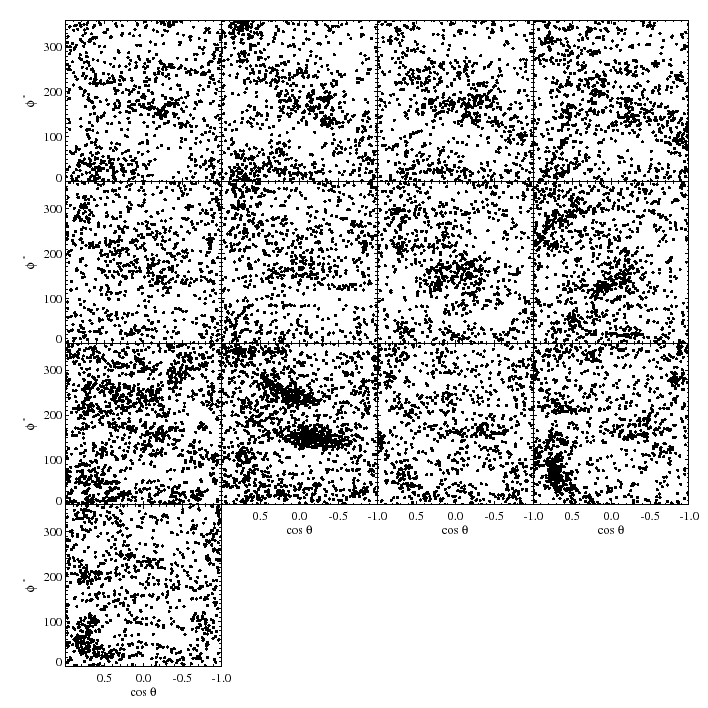
The present-time distribution of angular momentum orientations of subhalos reflects both the anisotropy of the accretion pattern and the dynamical processes that affect subhalos while orbiting the MW-like halo. Fig. 6 shows the orientation of the angular momentum of subhalos accreted in the last 13 snapshots, from the present-day (top left) to (bottom left). Here the angular momentum is calculated using the position and velocity of a subhalo in the simulation box frame right before it was accreted. Note that only a fraction of these subhalos will have survived until the present-time. The small scale clustering visible in this figure once again highlights the group infall. Note the presence of larger-scale patterns lasting over several snapshots (in particular in the top row, which corresponds to the last 2.4 Gyr). This presumably implies that the infall patterns are related with persistent larger scale structures (filaments) in the tidal field.
To understand this in more detail, we proceed to trace the evolution of the tidal field around the main halo in our simulation. To this end we select “field” particles, i.e. those that do not belong to the FOF group of the Milky Way-like halo. The projected spatial distribution of these particles within a Mpc on a side box is shown in grey in Fig. 7. Like in Fig. 6, each panel corresponds to a different redshift, starting from in the bottom left panel to the present day in the top left. The distributions of surviving subhalos accreted at the corresponding epoch are overplotted in black.
Fig. 7 shows that the Milky Way like halo is embedded in a larger-scale filamentary pattern. These filaments are comparable in extent to the halo itself (as e.g. traced by the accreted subhalos). The lumpy nature of the filaments is also clearly visible, showing that the infall is not a continuous flow, but is in groups as discussed above.
Note that the global orientation of the tidal fields near the main halo has not changed much over the last four snapshots, in agreement with what is observed in the top row of Fig. 6. Furthermore, this large scale pattern is more or less aligned with the major axis of the main halo, shown by the dashed line in each panel (as in Bailin & Steinmetz, 2005).
2.3 On the Great Disk of Milky-Way Satellites
Kroupa, Theis & Boily (2005) and Metz, Kroupa & Jerjen (2007) have recently argued that the highly anisotropic distribution of MW satellites could not have been drawn from a nearly spherically distributed subhalo population. Motivated by their claim and the results presented above, we wish to test here under what conditions such a configuration is likely in a CDM simulation like ours.
There are many possible ways to define the degree of flattening of a distribution. We shall here concentrate on the following two measures:
-
1.
The minor-to-major axis ratio derived from the eigenvalues of the diagonalised inertia tensor defined by the satellites positions.
- 2.
In what follows the positions are defined with respect to the centroid of the satellites (or subhalos), rather than with respect to the centre of the MW(-like) halo. For the first measure (i), we use the inertia tensor defined as
| (2) |
Note this inertia tensor differs from that previously used in Eq. (1) in which the positions were normalized by their ellipsoidal distance. Our preference for this new definition is based on the fact that the determination of the ellipsoidal distance is simultaneous to the determination of the eigenvalues of the inertia tensor . This means that an iterative algorithm is used, in which outliers are successively discarded, until the desired level of convergence is reached (see Sec. 2.2). However, when a relatively limited number of data points is available (as in the case of the MW satellites) this is clearly not desirable. Note as well that the shape of is more sensitive to objects at large distances. However, the effect this has on the measured can be quantified, as we shall see below.
In our analysis, we will only consider the eleven “traditional” Milky Way satellites. This enables us to make a direct comparison to the work of Kroupa, Theis & Boily (2005). On the other hand, it ensures we are not affected by the strong observational bias in the sky distribution of the new satellites discovered by SDSS, which reflects the fact that this survey has concentrated on the north galactic cap.
The minor-to-major axis ratio for the set of eleven “traditional” MW satellites is where the uncertainty is due to errors in the Galactocentric distance (which also includes the uncertainty in the distance from the Sun to the Galactic centre, kpc). The plane containing the major and intermediate axes is inclined with respect to the Galactic disk, in good agreement with the value found by Metz, Kroupa & Jerjen (2007).
If we use measure (ii) to quantify the degree of flattening, we find that the best-fit plane of the MW satellites has an orientation identical to that of the inertia tensor. The rms distance to this plane is kpc and the plane is offset from the Galactic centre by kpc. The median distance of the satellites is kpc, which implies that assuming Gaussian errors of all related distances (see also Metz, Kroupa & Jerjen, 2007).
2.3.1 Overall distribution of subhalos
The subhalos in our GAnew simulations show at least two differences in their distributions in comparison to the Galactic dwarfs: 1) their spatial distribution is much less anisotropic; 2) their density distribution is much shallower.
The present-day subhalo population of the Milky Way-like halo has a minor-to-major axis ratio , obtained using Eq. (2), compared to for the MW-like halo itself. These values are fairly consistent with those published by Zentner et al. (2005) and Libeskind et al. (2005). The minor to major axis ratio for those subhalos within kpc is . All these values are significantly larger than the found for the Milky Way satellites.
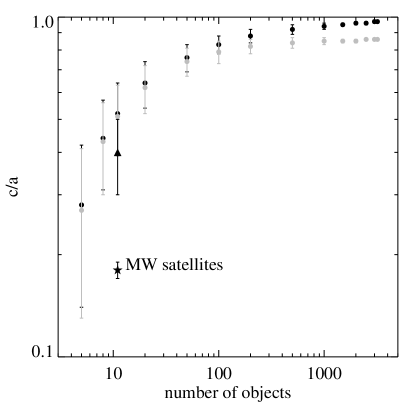
We now wish to test the effect of small number statistics in the determination of the principal axes of the inertia tensor. To this end we randomly select 105 samples of subhalos: i) from the simulated Milky-Way like halo population; ii) from an isotropic distribution with the same radial profile as found in the simulation. In Fig. 8 we plot the mean as a function of the number of subhalos selected. The grey dots correspond to those drawn from present-day subhalo population (case ) while the black points are drawn from an isotropic sample (case ). The error bars denote the standard deviations of the realisations. This figure shows that only when a reliable estimate of the shape of the parent distribution can be obtained. The mean tends to become smaller, i.e. the distribution appears more flattened as the number of subhalos becomes smaller. This is also true when the parent distribution is completely isotropic. When only subhalos are selected, the mean ( for the isotropic case), quite different from that of the parent sample. Nevertheless, this is still significantly larger than observed for the MW satellites.
We noted previously that the density distribution of the satellites of the Milky Way is strongly centrally concentrated. The median radius of the satellite’s distribution is kpc, comparable to the half-mass radius of the Milky Way ( for a concentration of as in Battaglia et al. 2005). On the other hand, the median radius for the subhalos (within kpc) in our simulation is much larger, .
We now quantify the effect of this highly centrally concentrated distribution on the shape of the inertia tensor. We proceed by randomly selecting sets of subhalos from our simulation, but now imposing they follow the observed MW satellites spherically averaged spatial distribution. The mean minor-to-major axis ratio obtained in this way is , and is denoted as a triangle in Fig. 8. This exercise shows that the disk-like configuration of the MW satellites is indeed partially driven by their strongly centrally concentrated density distribution around the Galaxy (see also Kang et al., 2005; Zentner et al., 2005, for a similar discussion). However, this is still only marginally consistent with the MW satellites, i.e. the mean of 11-random-subhalo realisations is away from that observed.
2.3.2 Distribution of grouped subhalos
Inspired by the group infall of subhalos found in Sec. 2.2, we now explore how the presence of such groups of subhalos can affect the chance of obtaining a flattened configuration. Naively, we would expect that if their angular momenta is nearly conserved, the subhalos would spread along their orbit and give rise to a planar structure as observed.
Given the large sensitivity of to sample size, we prefer to use the measure in what follows. This measure intuitively appears to be more robust since it derives from a simple plane-fit to a distribution of points.
Of the subhalos within kpc from the centre of the MW-like halo that have survived until the present-day, subhalos fell in as part of a group. different groups have contributed to the present-day population of subhalos, of which the earliest two were accreted at . From now on, subhalos identified to be part of a group are referred to as “grouped”, while those which are not are termed “field” subhalos.
We first test how often a disk-like structure is obtained when selecting a set of subhalos consisting of a certain number of subhalos from one group () while the rest are from the “field”. Note that , and the condition has to be satisfied. We make realisations of such subsets and compute the fraction that gives rise to a configuration as flat as observed, i.e. . The result is shown in the left panel of Fig. 9 where the disk fraction increases from 4.5% to 73% as the number of selected subhalos increases from to . In comparison, 11-randomly selected subhalos (within kpc) gives rise to flattened configurations of the time. This shows that if the Milky Way satellites fell in together, it would not be very surprising that they would be in a planar configuration at the present-day.
It is important to note that when , we select predominantly from just two groups accreted at relatively high redshift ( and ). Other large groups accreted more recently are still strongly clustered in space, and hence are discarded in this exercise since they cannot be considered as a valid representation of the MW satellite population. Furthermore, although there is a relatively high chance of obtaining a value of as low as observed, this is driven more by the large median distance of the subhalos than by their RMS distance to the best fit plane.
A second possibility is to consider only “grouped” subhalos. That is, we select randomly subhalos from different groups where . The panel on the right of Fig. 9 shows the fraction of disk-like configurations obtained in this way as a function of the number of groups considered. This fraction can be as high as when the subhalos come from only two groups, and of course reaches 73% when they come from just one group. Note that the fraction when selecting from different groups is still much higher than if one selects subhalos randomly.

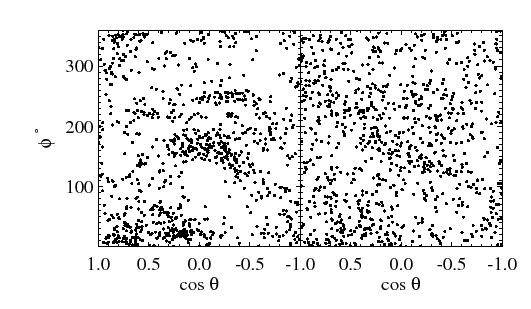
The reason for the larger number of disk-like configurations when selecting subhalos from several groups as in the right of Fig. 9, rather than from just one group and the field, may be understood by examining Fig. 10. This shows the present-day angular momentum orientations for “grouped” (left panel) and “field” (right panel) subhalos. The two distributions differ clearly in the sense that the “grouped” subhalos are generally more clustered (see also Sec. 2.2), also on larger scales. On the contrary, “field” subhalos tend to have their angular momenta more isotropically distributed. Therefore, when selecting subhalos purely from groups, the chance of picking up subhalos with similar angular momentum orientations, is higher than when selecting also from the “field”. The more isotropically distributed orbits of “field” subhalos essentially add noise to the highly correlated orbits of subhalos originating in just one group. Therefore the disk signal gets smeared out quite significantly when more than half of the subhalos are in the field in one realisation, as shown on the left of Fig. 9.
Given the large fraction of flattened configurations found in our simulations, we conclude that the spatial distribution of the Milky Way satellites can be reproduced within CDM. The requirement is that these satellites fell onto the Galactic halo in groups.
3 Discussion and conclusions
We have analysed a high-resolution cosmological simulation of the formation of a Milky Way-like halo, focusing on the properties of the satellite population at the present-day.
We have found that dark-matter subhalos are often accreted in groups in our simulations. Roughly of the surviving subhalos with mass at the present epoch share this property. This is clearly a lower limit since we are not be able to identify accompanying halos below our resolution limit (this is particularly severe at high-redshift).
This group infall is apparent as an enhancement in the number of subhalos whose angular momentum orientation is similar, particularly at the time of infall. This signal is measurable also from the present-day angular momentum of subhalos, even for those accreted 8 Gyr ago. These groups of subhalos share coherent orbits which can be traced back well before the accretion epoch. The differential group mass function follows a power-law distribution with . This is reminiscent of the differential mass function of subhalos in both galaxy and cluster-size halos, albeit with a shallower slope (compared to as in e.g. De Lucia et al. 2004; Gao et al. 2004b).
We have also studied the degree of flattening of the spatial distribution of subhalos in our simulation. The mean minor-to-major axis ratio of the inertia tensor defined by the positions of randomly selected subhalos with kpc is . In comparison the of the “classical” MW satellites is . Imposing the centrally concentrated MW satellite radial distribution leads to and therefore somewhat alleviates the discrepancy with the observations (see also Kang et al., 2005).
We have explored also how this planar configuration may be obtained as a result of the infall of satellites in groups. The observed correlation in the angular momentum orientation of subhalos naturally gives rise to disk-like configurations. For example, we find that if all subhalos are accreted from just one group, it is almost impossible to avoid a disk-like distribution (80% probability), while for accretion from just two groups, the likelihood of obtaining a distribution as planar as observed is 40%.
These results may explain the origin of the ghostly streams proposed by Lynden-Bell & Lynden-Bell (1995). Out of the streams originally proposed, only two appear to have survived the rigour of time, after modern and accurate measurements of proper motions have become available. Palma, Majewski & Johnston (2002) confirmed the LMC-SMC-UMi-Draco stream forms a kinematic group whose angular momentum separation is . More recently Piatek et al. (2005) ruled out with confident level UMi as a member using HST proper motions. The latest measurements of the Fornax proper motion by Piatek et al. (2007) has apparently confirmed the Sculptor-Sextans-Fornax stream (although previous measurements led to conflicting results, see Piatek et al. 2002; Dinescu et al. 2004). If some of the luminous satellites are embedded in dark (sub)halos that fell in together, such coherent structures would be a naturally consequence of the hierarchical build-up of galaxies.
In our simulations, such groups remain coherent in angular momentum (i.e. they share similar orbital planes giving rise to great circle streams) for approximately 8 Gyr. This implies that these groups (or satellites) should have been accreted by the Milky Way at redshifts or below.
One of the possible implications of the reality of the ghostly streams is that its member galaxies formed and evolved in a similar environment before falling into the Milky Way potential. This would have implications on the (earliest) stellar populations of these objects, such as for example, sharing a common metallicity floor (Helmi et al., 2006). On the other hand, this implies that there should be groups that have not been able to host any luminous satellites. This would hint at a strong dependence on environment on the ability of a subhalo to retain gas (Scannapieco et al., 2001), or be shielded from re-ionization by nearby sources (Mashchenko, Carignan & Bouchard, 2004; Weinmann et al., 2007).
Recent proper motion measurements of the Large and Small Magellanic clouds by Kallivayalil, van der Marel & Alcock (2006), as well as the simulations by Bekki & Chiba (2005) suggest that these systems may have become bound to each other only recently. This would be fairly plausible in the context of our results. The Clouds may well have been part of a recently accreted group (see also Sales et al., 2007, for the link to Leo I) and it may not even be necessary for them to ever have been a binary system. This may also have implications on the computations of the past trajectories of these systems, particularly if both are embedded in a larger common dark-matter envelope (Besla et al., 2007).
Our analysis shows that the dynamical peculiarities of the Milky Way satellites can be understood in the context of the concordance cosmological model. Their properties must be a consequence of both the environment as well as of the hierarchical nature of the build up of galactic halos.
acknowledgements
We thank Felix Stoehr for providing us with the GAnew simulations and for the great support in dealing with their analysis; Martin Smith and Simon White for stimulating discussions and suggestions. We are grateful to Laura Sales for a careful reading of the manuscript and for many useful discussions. We acknowledge financial support from the Netherlands Organisation for Scientific Research (NWO).
References
- Bailin & Steinmetz (2005) Bailin J., Steinmetz M., 2005, ApJ, 627, 647
- Battaglia et al. (2005) Battaglia G. et al., 2005, MNRAS, 364, 433
- Bekki & Chiba (2005) Bekki K., Chiba M., 2005, MNRAS, 356, 680
- Belokurov et al. (2006) Belokurov V. et al., 2006, ApJ, 647, L111
- Belokurov et al. (2007) Belokurov V. et al., 2007, ApJ, 654, 897
- Benson et al. (2002) Benson A. J., Frenk C. S., Lacey C. G., Baugh C. M., Cole S., 2002, MNRAS, 333, 177
- Besla et al. (2007) Besla G., Kallivayalil N., Hernquist L., Robertson B., Cox T. J., van der Marel R. P., Alcock C., 2007, ApJ, 668, 949
- Ciardi, Stoehr & White (2003) Ciardi B., Stoehr F., White S. D. M., 2003, MNRAS, 343, 1101
- De Lucia et al. (2004) De Lucia G., Kauffmann G., Springel V., White S. D. M., Lanzoni B., Stoehr F., Tormen G., Yoshida N., 2004, MNRAS, 348, 333
- Dinescu et al. (2004) Dinescu D. I., Keeney B. A., Majewski S. R., Girard T. M., 2004, AJ, 128, 687
- Dubinski & Carlberg (1991) Dubinski J., Carlberg R. G., 1991, ApJ, 378, 496
- Gao et al. (2004a) Gao L., De Lucia G., White S. D. M., Jenkins A., 2004, MNRAS, 352, L1
- Gao et al. (2004b) Gao L., White S. D. M., Jenkins A., Stoehr F., Springel V., 2004, MNRAS, 355, 819
- Gilmore, Wyse & Norris (2002) Gilmore G., Wyse R. F. G., Norris J. E., 2002, ApJ, 574, L39
- Helmi et al. (2006) Helmi A., et al., 2006, ApJ, 651, L121
- Irwin et al. (2007) Irwin M. J. et al., 2007, ApJ, 656, L13
- Kallivayalil, van der Marel & Alcock (2006) Kallivayalil N., van der Marel R. P., Alcock C., 2006, ApJ, 652, 1213
- Kang et al. (2005) Kang X., Mao S., Gao L., Jing Y.P., 2005, A&A, 437, 383
- Kauffmann, White & Guiderdoni (1993) Kauffmann G., White S. D. M., Guiderdoni B., 1993, MNRAS, 264, 201
- Klypin et al. (1999) Klypin A., Kravtsov A. V., Valenzuela O., Prada F., 1999, ApJ, 522, 82
- Knebe et al. (2004) Knebe A., Gill S. P. D., Gibson B. K., Lewis G. F., Ibata R. A., Dopita M. A., 2004, ApJ, 603, 7
- Koch & Grebel (2006) Koch A., Grebel E. K., 2006, AJ, 131, 1405
- Kravtsov, Gnedin & Klypin (2004) Kravtsov A. V., Gnedin O. Y., Klypin A. A., 2004, ApJ, 609, 482
- Kroupa, Theis & Boily (2005) Kroupa P., Theis C., Boily M., 2005, A&A, 431, 517
- Kroupa (1997) Kroupa P., 1997, New Astronomy, 2, 139
- Libeskind et al. (2005) Libeskind N. I., Frenk C. S., Cole S., Helly J. C., Jenkins A., Navarro J. F., Power C., 2005, MNRAS, 363, 146
- Libeskind et al. (2007) Libeskind N. I., Cole S., Frenk C. S., Okamoto T., Jenkins A., 2007, MNRAS, 374, 16
- Lynden-Bell & Lynden-Bell (1995) Lynden-Bell D., Lynden-Bell R. M., 1995, MNRAS, 275, 429
- Macciò et al. (2006) Macció A. V., Moore B., Stadel J., Potter D., 2006, preprint (astro-ph/0609146)
- Mashchenko, Carignan & Bouchard (2004) Mashchenko S., Carignan C., Bouchard A., 2004, MNRAS, 352, 168
- Mateo (1998) Mateo M., 1998, ARA&A, 36, 435
- McConnachie & Irwin (2006) McConnachie A. W., Irwin M. J., 2006, MNRAS, 365, 902
- Metz, Kroupa & Jerjen (2007) Metz M., Kroupa P., Jerjen H., 2007, MNRAS, 374, 1125
- Moore et al. (1999) Moore B., Ghigna S., Governato F., Lake G., Quinn T., Stadel J., Tozzi P. , 1999, ApJ, 524, L19
- Palma, Majewski & Johnston (2002) Palma C., Majewski S. R., Johnston K. V., 2002, ApJ, 564, 736
- Piatek et al. (2002) Piatek S. et al., 2002, AJ, 124, 3198
- Piatek et al. (2005) Piatek S., Pryor C., Bristow P., Olszewski E. W., Harris H. C., Mateo M., Minniti D., Tinney C. G., 2005, AJ, 130, 95
- Piatek et al. (2007) Piatek S., Pryor C., Bristow P., Olszewski E. W., Harris H. C., Mateo M., Minniti D., Tinney C. G., 2007, AJ, 133, 818
- Sales et al. (2007) Sales L. V., Navarro J. F., Abadi M. G., Steinmetz M., 2007, MNRAS, 379, 1475
- Scannapieco et al. (2001) Scannapieco E., Thacker R. J., Davis M., 2001, ApJ, 557, 605
- Simon & Geha (2007) Simon J., Geha M., 2007, ApJ, 670, 313
- Springel et al. (2001) Springel V., White S. D. M., Tormen G., Kauffmann G., 2001, MNRAS, 328, 726
- Stoehr et al. (2002) Stoehr F., White S. D. M., Tormen G., Springel V., 2002, MNRAS, 335, L84
- Stoehr et al. (2003) Stoehr F., White S. D. M., Springel V., Tormen G., Yoshida N., 2003, MNRAS, 345, 1313
- Stoehr (2006) Stoehr F., 2006, MNRAS, 365, 147
- Taylor, Babul & Silk (2004) Taylor J. E., Babul A., Silk J., 2004, ASP Conf. Ser. 327: Satellites and Tidal Streams, 327, 205
- Tormen, Bouchet & White (1997) Tormen G., Bouchet F. R., White S. D. M., 1997, MNRAS, 286, 865
- Weinmann et al. (2007) Weinmann S. M., Macció A. V., Iliev I. T., Mellema G., Moore B., 2007, MNRAS, 381, 367
- Willman et al. (2005a) Willman B. et al., 2005, ApJ, 626, L85
- Willman et al. (2005b) Willman B. et al., 2005, AJ, 129, 2692
- Zentner et al. (2005) Zentner A. R., Kravtsov A. V., Gnedin O. Y., Klypin A. A., 2005, ApJ, 629, 219
- Zucker et al. (2006a) Zucker D. B. et al., 2006, ApJ, 643, L103
- Zucker et al. (2006b) Zucker D. B. et al., 2006, ApJ, 650, L41