The Physics of Protoplanetesimal Dust Agglomerates
II. Low Velocity Collision Properties
Abstract
For the investigation of collisions among protoplanetesimal dust aggregates, we performed microgravity experiments in which the impacts of high-porosity mm-sized dust aggregates into 2.5 cm-sized high-porosity dust aggregates can be studied. The dust aggregates consisted either of monodisperse spherical, of quasi-monodisperse irregular or of polydisperse irregular micrometer-sized dust grains and were produced by random ballistic deposition with porosities between 85% and 93%. Impact velocities ranged from to and impact angles were almost randomly distributed. In addition to the smooth surfaces of the target aggregates formed in our experiments, we “molded” target aggregates such that the radii of the local surface curvatures corresponded to the projectile radii, decreasing the targets porosities to %. The experiments showed that impacts into the highest-porosity targets almost always led to sticking, whereas for the less porous dust aggregates, consisting of monodisperse spherical dust grains, the collisions with intermediate velocities and high impact angles resulted in the bouncing of the projectile with a mass transfer from the target to the projectile aggregate. Sticking probabilities for the impacts into the “molded“ target aggregates were considerably decreased. For the impacts into smooth targets, we measured the depth of intrusion and the crater volume and could derive some interesting dynamical properties which can help to derive a collision model for protoplanetesimal dust aggregates. Future models of the aggregate growth in protoplanetary disks should take into account non-central impacts, impact compression, the influence of the local radius of curvature on the collisional outcome and the possible mass transfer between target and projectile agglomerates in non-sticking collisions.
1 Introduction
Young stars are surrounded by accretion disks. It is now widely accepted that the formation of planetesimals, the km-sized precursors of the terrestrial planets and of the cores of the gas planets, is initiated by the process of agglomeration of protoplanetary dust in these disks. For the young Solar System, the circumstellar disk is also known by the name of ”solar nebula“. Due to the decreasing rate of accretion, the gas disk cools down and fine dust particles condense. Typical initial grain sizes, as evidenced by astronomical observations of circumstellar accretion disks (Kessler-Silacci et al., 2006; Przygodda et al., 2003), primitive meteorites from our own Solar System (Kerridge, 1993), and recent measurements from comets (Harker et al., 2005; Keller et al., 2005; Hörz et al., 2006) are in the (sub-)micrometer size range.
The velocities of these dust grains relative to the gas disk are caused by Brownian motion, gravity-induced drift motion and gas turbulence and result in mutual collisions among the grains (Weidenschilling & Cuzzi, 1993) which can lead to the growth of dust agglomerates. When the collision velocities are sufficiently low, the dust particles show a hit-and-stick behavior (Poppe et al., 2000; Blum & Wurm, 2000; Dominik & Tielens, 1997) and the dust agglomerates are bound by weak van der Waals forces (Heim et al., 1999). As a consequence, fractal dust agglomerates are formed whose fractal dimensions , defined by the relation between agglomerate mass and size , , range from (Blum et al., 2000; Krause & Blum, 2004; Paszun & Dominik, 2006) for Brownian motion-dominated growth to for growth caused by drift motions (Blum et al., 1998) or gas turbulence (Wurm & Blum, 1998). Due to the increasing agglomerate mass and the consequentially increasing collision velocities for protoplanetary dust (Weidenschilling & Cuzzi, 1993), collisions will eventually lead to the compaction of the agglomerates (Dominik & Tielens, 1997; Blum & Wurm, 2000) so that the fractal dimensions will increase to (Weidenschilling & Cuzzi, 1993; Blum, 2004). Such agglomerates are, however, not compact but can be quite porous. Simulation experiments suggest that the volume filling factors, given by
| (1) |
with , and being the porosity, the mass density of the aggregate and of the solid grain material, respectively, should be as low as even if the collision velocities are as high as 50 (Blum & Schräpler (2004); Blum et al. (2006), hereafter referred to as paper I). As long as the collision velocities are , the maximum volume filling factor for loose particle ensembles is (Blum & Schräpler (2004); paper I). Very low collision velocities could lead to even lower volume filling factors of (Ormel et al., 2007).
For fractal dust agglomerates, concurring theoretical (Dominik & Tielens, 1997) and experimental (Blum & Wurm, 2000) results show that above a threshold velocity of , dust agglomerates do no longer stick together but bounce off and fragment upon collision. For non-fractal dust aggregates, impact experiments by Wurm et al. (2005a) and Wurm et al. (2005b), who used cm-sized porous projectiles and decimeter-sized porous targets, showed that for high-porosity targets () no sticking occurs in the velocity range and a crater is formed on the target which leads to a mass loss from the target. For compacted targets (), a mass gain of the target of percent of the projectile mass could be found for impact velocities .
Not much is known about the collision behavior of high-porosity dust agglomerate in the velocity regime around . Earlier experiments by Blum & Münch (1993), who used mm-sized dust agglomerates with and collision velocities in the range , showed that none of the collisions between (almost) equal-sized agglomerates led to sticking, while at the highest collision velocities fragmentation dominated. With our new technology for the formation of high-porosity macroscopic dust agglomerates (Blum & Schräpler (2004); paper I), realistic macroscopic dust agglomerates with volume filling factors in the range are now available with which the collision behavior of protoplanetary dust agglomerates can be investigated.
Sect. 2 gives an overview of the scientific objectives of this work, Sect. 3 presents the experimental technology and the properties of the used dust agglomerates, Sect. 4 gives the experimental results on sticking efficiencies, mass transfer, coefficients of restitution, energy loss, tensile strength, crater formation and impact fragmentation. Sect. 5 discusses the low-velocity impact dynamics of high-porosity dust agglomerates, Sect. 6 gives a summary of our experimental findings, and in Sect. 7, we draw conclusions from our work for the formation of larger objects in the protoplanetary nebula.
2 Objectives
This paper describes novel low-velocity impact experiments between high-porosity dusty projectiles of diameters between mm and mm and high-porosity dusty targets of 2.5 cm diameter. From previous modelling and laboratory work it became clear that above a certain agglomerate size the hitherto present growth of fractal agglomerates is no longer feasible due to the increasing collision energy with increasing agglomerate size (Dominik & Tielens, 1997; Blum & Wurm, 2000). Thus, the agglomerates above a certain size limit should be non-fractal but highly porous in structure (Blum, 2004; Ormel et al., 2007). With a new experimental method, we are able to manufacture macroscopic, high-porosity dust agglomerates (see Sect. 3) with which realistic collision experiments for macroscopic protoplanetesimals are possible. The experiments described below have the following main scientific objectives:
-
1.
Under what physical conditions do high-porosity dust agglomerates stick?
-
2.
What are the possible outcomes of collisions between high-porosity dust agglomerates?
-
3.
What is the influence of projectile mass, velocity, impact angle, local radius of curvature, and porosity on the outcome of a collision?
-
4.
What are the sticking efficiencies in mutual collisions between protoplanetesimal, non-fractal dust agglomerates?
-
5.
What are the coefficients of restitution in non-sticking collisions?
3 Experimental Setup, Samples and Procedures
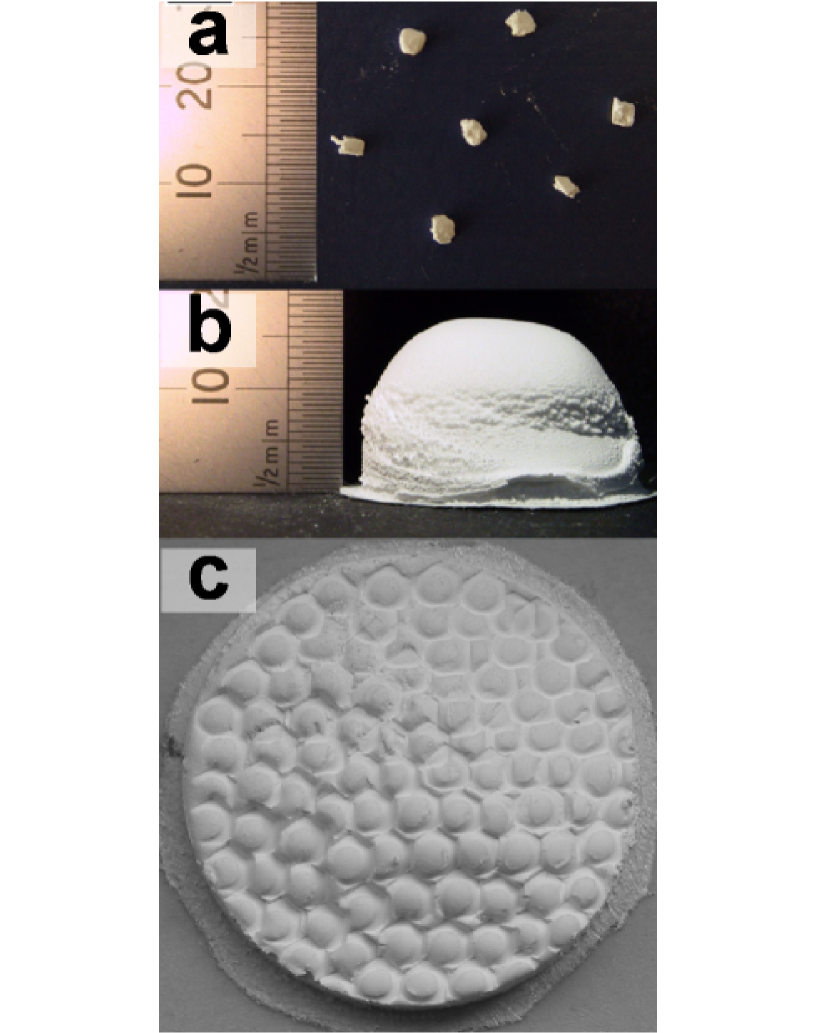
For the experimental simulations of dust-dust collisions between mm-sized and cm-sized dust agglomerates, we used monolithic dust-agglomerate samples of 2.5 cm diameter and cm height as targets and smaller fragments of such samples as projectiles. All samples were formed by random ballistic deposition (RBD; see paper I and Blum & Schräpler (2004) for details of the RBD process). Table 1 summarizes the physical properties of the particles and the resulting RBD agglomerates. Three monomer particle types were used: (1) monodisperse spheres with 1.5 diameter, (2) quasi-monodisperse, irregular diamond particles with diameter, and (3) polydisperse, irregular grains with diameters in the range 0.1 - 10 . The motivation for the use of these three samples was less in their cosmochemical relevance for protoplanetary dust but lay in their span of morphologies and size distributions and the question how these morphologies influence the outcome of the collisions. As was shown by Poppe et al. (2000), the impact of the material on the sticking behavior is smaller than the influence of the individual particle morphology. Our experiments span a wide range in morphological parameters so that we consider them relevant for protoplanetary collision processes.
It is interesting to note that the volume filling factor of the agglomerates (see Table 1), which describes the fraction of volume filled with particles, is dependent on the particle morphology and the width of the particle size distribution (paper I), and varies by a factor of two between monodisperse, spherical monomers () and polydisperse, irregular grains (). The broader the size distribution, the fluffier the agglomerates are. For RBD agglomerates consisting of spherical monodisperse particles, one expects a volume filling factor of (Vold, 1959; Watson et al., 1997) which is exactly found in our samples (see paper I and Blum & Schräpler (2004)).
To simulate the collisional history of protoplanetary dust aggregates and to test the influence of the local target surface curvature on the outcome of a collision, we also performed a series of impact experiments into “molded” targets. These targets, consisting of diameter spheres with an initial volume filling factor of , were slightly locally compacted by a half-spherical mold with 1 mm radius so that they ultimately consisted of asperities with local radii of curvature of 1 mm (representing, e.g., sticking projectiles from previous impacts). X-ray tomography of the “molded” targets showed that the “hills” consisted of uncompressed aggregated dust (), while the “valleys” were slightly compressed to a volume filling factor of . Examples of an unprocessed and a processed target and several projectile agglomerates are shown in Fig. 1.
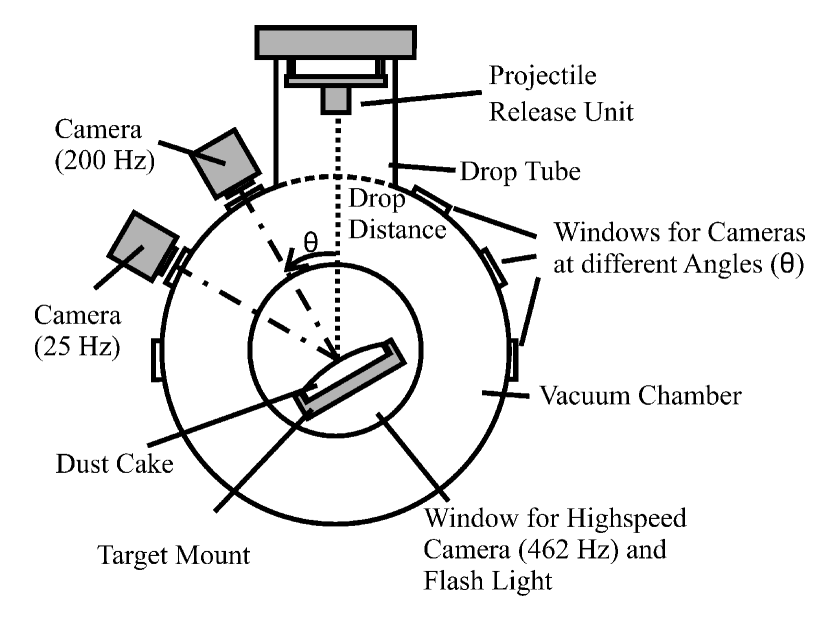
For the realization of collisions between dusty targets and dusty projectiles we developed a setup whose functionality is depicted in Fig. 2.
The experiments are performed under microgravity conditions within a pressurized capsule which is, prior to each impact experiment, held at the top of the microgravity drop tower in Bremen. Inside the experimental setup, a set of five typically mm-sized projectile agglomerates is held in a device which is able to simultaneously release the projectiles when an electrical current is applied to two solenoid magnets. The projectiles’ release is done while the experiment capsule is still held at ambient gravitational acceleration. Due to the gravitational acceleration, the released projectiles gain vertical velocities proportional to their time of flight. After some preselected travel distance (or time of flight), the experiment capsule is released to free fall. Thus, the relative velocity between the projectiles and the target is frozen and the impacts happen at a residual acceleration level of less than , mimicking the conditions in protoplanetary disks. The free-fall height of the projectiles can be adjusted from cm to cm. Due to a limited acceleration length of the projectiles of cm, the maximum impact velocity is , while the actual impact velocity is only determined by the time lapse between projectile release and start of the free-fall phase of the whole experiment. For the simulation of random impacts, the target can be tilted by 30 and 60 degrees relative to the velocity vector of the projectiles. For the exclusion of aerodynamic effects during the collisions, the experiment chamber is evacuated to less than 20 Pa pressure.
During the free-fall time of 4.74 seconds, the impacts are observed by a set of different cameras and illumination schemes (see Fig. 2): (1) A high-speed (462 frames per second [fps]), high-resolution (1k 1k pixels) camera with a field of view (FOV) of is arranged such that it observes the impacts tangential to the target surface; the illumination is provided by a synchronized Xe flash lamp with flash duration. Due to the limited resolution, this camera can only detect particles . (2) Another high-speed (220 fps), low-resolution (256 256 pixels) camera with a FOV of can observe the impacts perpendicular (in the case of non-normal impacts) or almost perpendicular (in the case of normal impacts) to the target surface; additional illumination is provided by a laser curtain with 30 mm width and 1 mm thickness parallel and close to the surface of the target; this camera-illumination combination was specifically installed for detecting small fragments that are otherwise invisible. (3) An additional low-speed (25 fps), low-resolution (720 576 pixels) video camera with a FOV of , located 30 degrees from the target normal, observes the target surface prior and after the impacts; a point-source illumination for the determination of, e.g., crater depths is provided by a halogen lamp located 32 degrees above the target’s “horizon”.
Data analysis consists of a thorough image analysis including the determination of projectile sizes, impact velocities and impact angles with respect to the local target normal, and the determination of the outcomes of the collisions (sticking, rebound or fragmentation) as well as parameters determining the effects during the collisions. These encompass, among others, projectile and fragment sizes, depths of intrusion, crater depths, and fragment velocities.
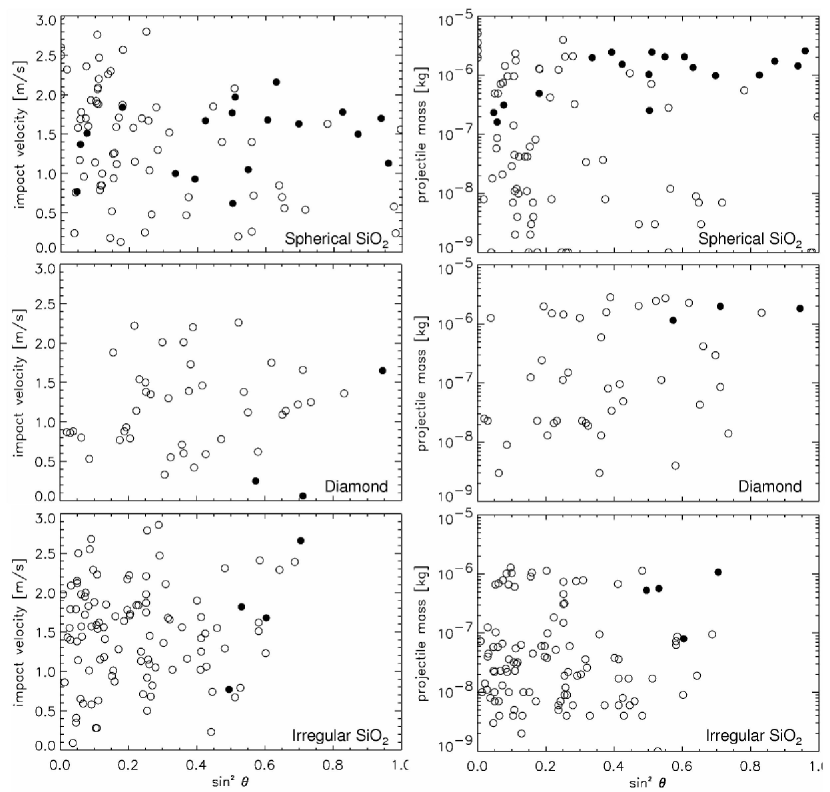
The variable parameters in the experiment are the projectile velocity, the impact angle, the physical agglomerate properties (see Table 1) and the projectile mass. Fig. 3 gives an overview of the projectile masses, the impact velocities and the impact angles for the three agglomerate compositions described in Table 1 and impacts into unprocessed targets. For a better statistical representation, the impact angle (relative to the target normal) is replaced by the squared sine of the above-defined angle, , so that each -interval has the same statistical probability for random collisions. The original projectiles had sizes of typically 1 mm and, thus, masses of kg. During the release of these projectiles, a small fraction of their mass fragmented off and in most cases also hit the target. This means that we could observe, in addition to the original projectiles, several collisions between projectiles of sub-mm sizes and the target agglomerates. The lower limit of agglomerate masses of kg is due to the finite resolution of the cameras (see above). The target masses are in the range g so that for all impacts. Thus, our impact experiments are valid for all target masses and are not restricted to target sizes of centimeters. Impact velocities ranged from to , with a slight systematic increase in velocity with increasing projectile mass. This effect – with a typical difference in impact velocity between the largest and the smallest projectiles of – is due to some residual friction of the travelling projectiles with the rarefied-gas atmosphere of Pa pressure. The total number of microgravity experiments performed for these experiments is 45. The experiments were carried out in three series between November 2003 and October 2004.
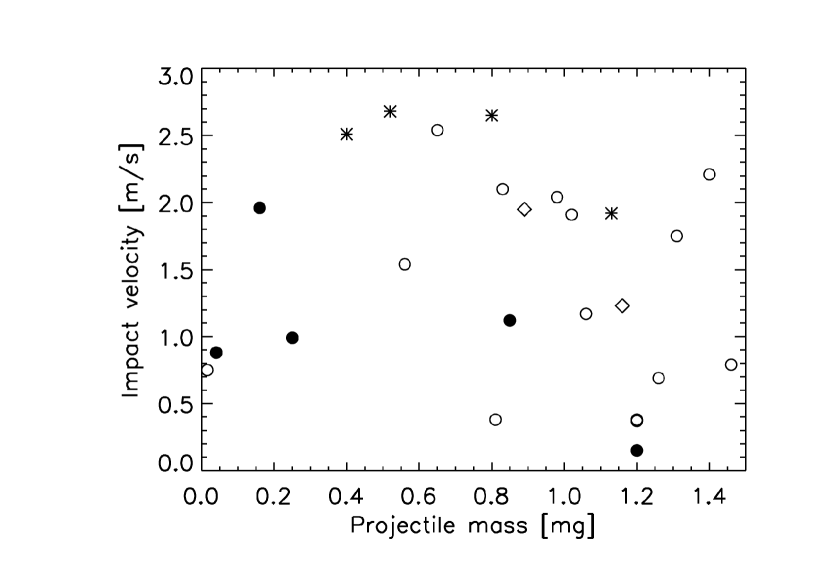
Fig. 4 shows the parameter space of the impact experiments of dust aggregates with into “molded” targets with . These data were collected in a drop-tower campaign comprising 9 flights in April 2006. Due to the morphology of the target surface (see Fig. 1), the variation of the impact angle is irrelevant so that all impacts were carried out normal to the target surface.
4 Experimental Results
4.1 Sticking Properties
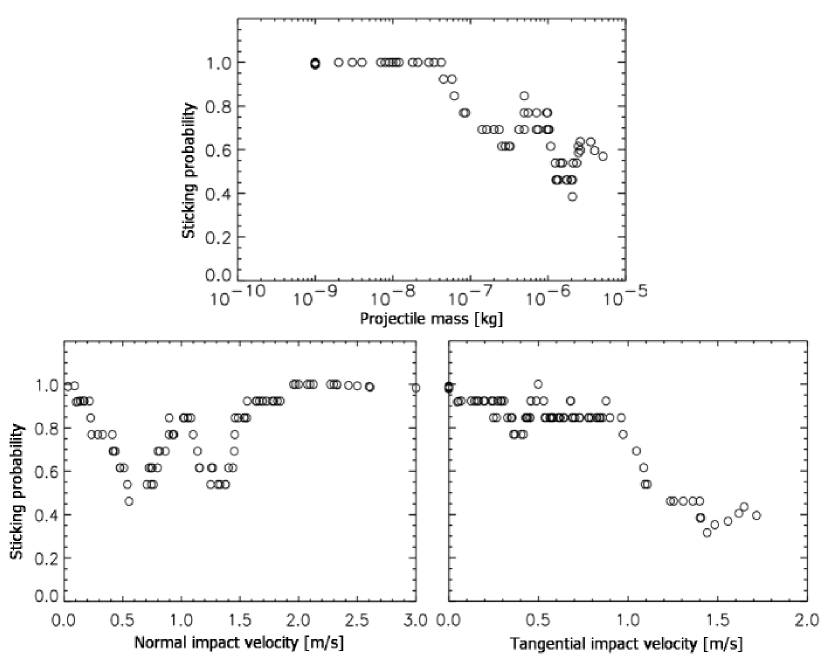
For dust aggregates consisting of irregular and diamond particles the sticking probability in the mass – velocity – impact angle range is very close to unity (see Fig. 3), with only a few projectile aggregates bouncing from the target. For dust aggregates consisting of spherical, monodisperse grains, i.e. for the densest projectiles and targets, the distribution of the sticking (open circles in Fig. 3) and non-sticking collision events (full circles in Fig. 3) in the parameter space is not random. It is evident that the non-sticking collisions into the flat targets occur preferentially for intermediate velocities of , for larger impact angles, and for more massive projectiles. A determination of the sticking probability as a function of projectile mass and the components of the impact velocity normal and tangential to the target surface is shown in Fig. 5. Sticking probabilities were derived by sliding averaging over 13 data points sorted in projectile mass and normal/tangential impact velocity. From Figs. 3 and 5 it is clearly visible that (1) the sticking probability is for aggregates with kg and falls steadily to values for the highest aggregate masses of kg, (2) for both, very low () and very high () normal impact velocities, the sticking probability is (however, mind that projectile velocity and mass are not independent parameters and that the slowest impact velocities stem from the smallest projectiles), whereas the sticking probability drops to for normal impact velocities in the range , (3) the sticking probability decreases steadily for increasing tangential impact velocity and reaches values as low as for the highest tangential velocities of .
For the “molded” and slightly compressed targets, sticking is even the exception (see Fig. 4), while for the flat and fluffy targets most collisions result in mass gain of the target. We find a sticking probability of when the target is slightly compacted and has local radii of curvature comparable to the projectile radii. It was observed that the projectiles stuck to the target only when they accidentally hit a “valley”.
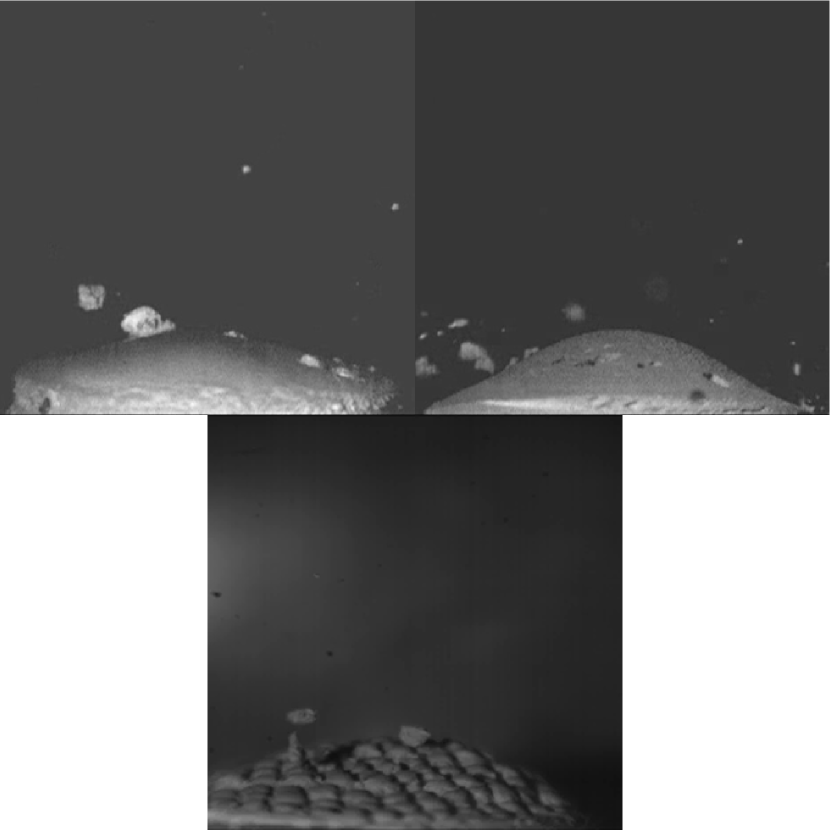
Fig. 6 shows example movies into unprocessed and “molded” target aggregates (online version only).
4.2 Mass transfer in collisions
Due to the low number of non-sticking collisions for the agglomerates consisting of irregular monomers, we could not perform a statistical analysis of the properties of the bouncing agglomerates for non-spherical monomers. Thus, this and the following subsections will mainly deal with the analysis of the non-sticking collisions of agglomerates consisting of spherical, monodisperse particles into flat soft targets of the same material.
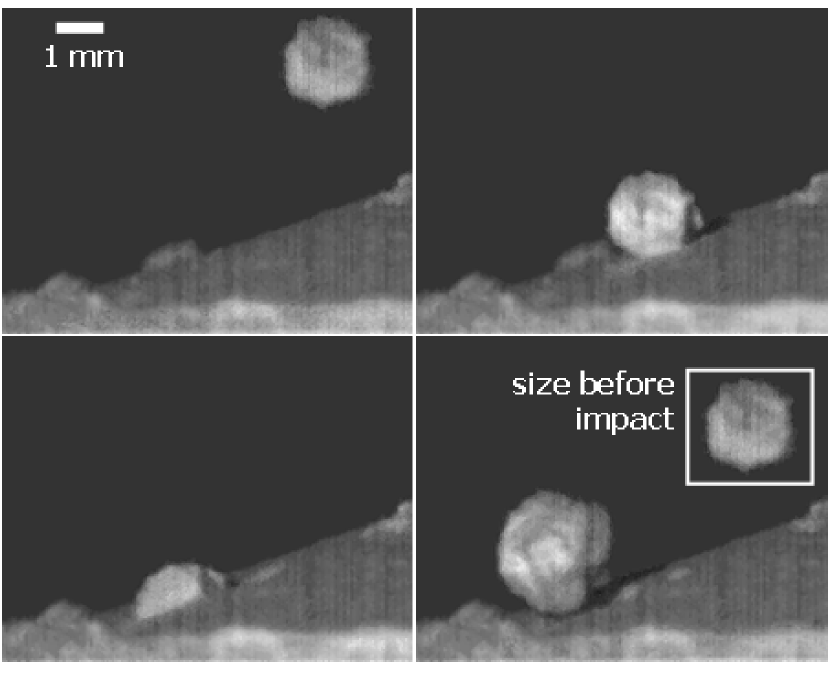
Fig. 7 displays an example of a collision in which the impinging agglomerate bounced off after the collision. From the comparison between the first and the last image of the sequence (see inset) it is evident that the size of the projectile agglomerate changed. We determined the mass ratio of the projectile immediately after and before the impact by
| (2) |
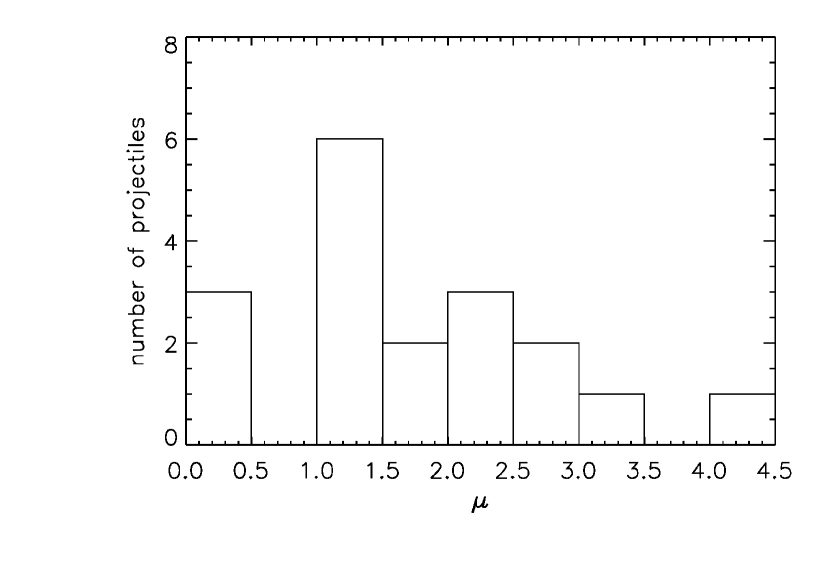
in which , , , and denote the maximum and minimum linear extension of the agglomerate after and before the impact, respectively. Fig. 8 shows the distribution of the derived mass ratios. Although the statistics is still somewhat poor, it can be seen that the mass transfer between target and projectile agglomerate can be considerable and obtains mostly values in the range . The mean mass ratio is . This means that on average a non-sticking impact leads to a considerable mass loss of the (more massive) target agglomerate, a process which has not been considered before.
4.3 Coefficient of restitution and energy loss
In the case of non-sticking the kinetic energy is not fully absorbed within the projectile and target agglomerates. A usual method to describe the amount of plasticity in a collision is by using the coefficient of restitution, defined by
| (3) |
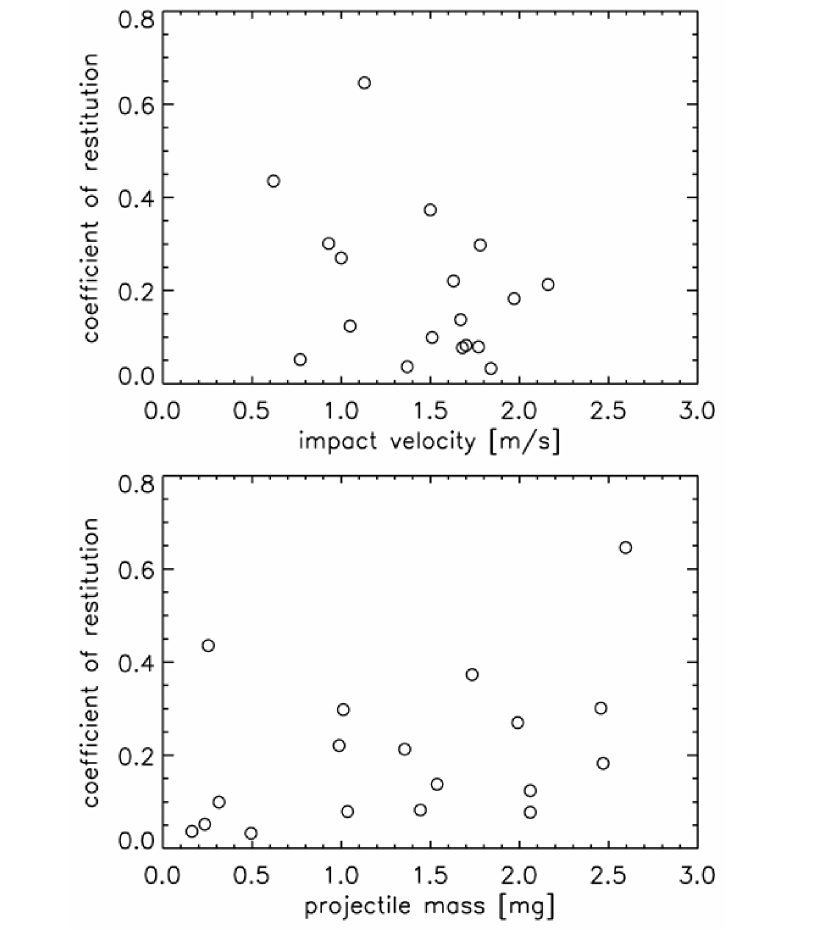
Here and denote the relative velocity between the projectile and the target after and before the collision. Fig. 9 shows the coefficients of restitution for all 18 non-sticking impacts of agglomerates consisting of spheres as a function of impact velocity and projectile mass. The data points are scattered between relative low and rather high values with no apparent dependence of the coefficient of restitution on the impact velocity and on the projectile mass. The mean value of the coefficient of restitution is and the root mean square value is .
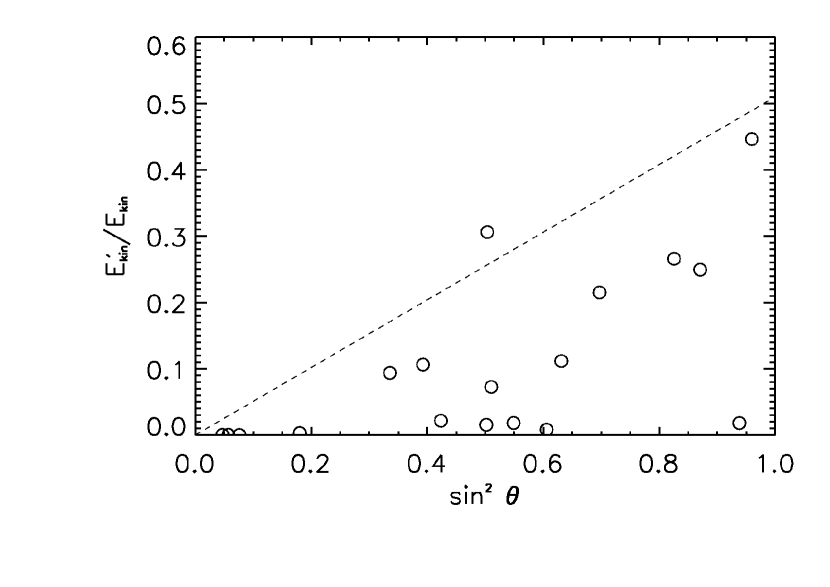
The coefficient of restitution plays an important role in the dense dust-dominated subdisk or inside condensations caused by the streaming instability, in which mutual collisions among the dust aggregates can act as “cooling” (Johansen et al., 2007) . For the physical processes inside colliding dust aggregates, it is, however, more interesting to consider the ratio of total kinetic energy after and before the collision (taking into account the mass transfer from target to projectile) as a function of the squared impact parameter. Fig. 10 shows this data. Also plotted in Fig. 10 is the linear relation
| (4) |
which is for (perfectly inelastic central collisions) and (pure frictional transition from translational to rotational motion and no plasticity for glancing collisions) an upper limit for dust-aggregate collisions (Blum & Münch, 1993). It is evident that our data fall much below the upper limit given by Eq. 4. This means that plasticity does not only play a role for the normal but also for the tangential component of the collision, i.e. the shear strength of the aggregate material is overcome during the impacts. However, the data in Fig. 10 shows an increasing trend of with increasing , which was also observed by Blum & Münch (1993), i.e. the total amount of plasticity decreases with increasing impact parameter.
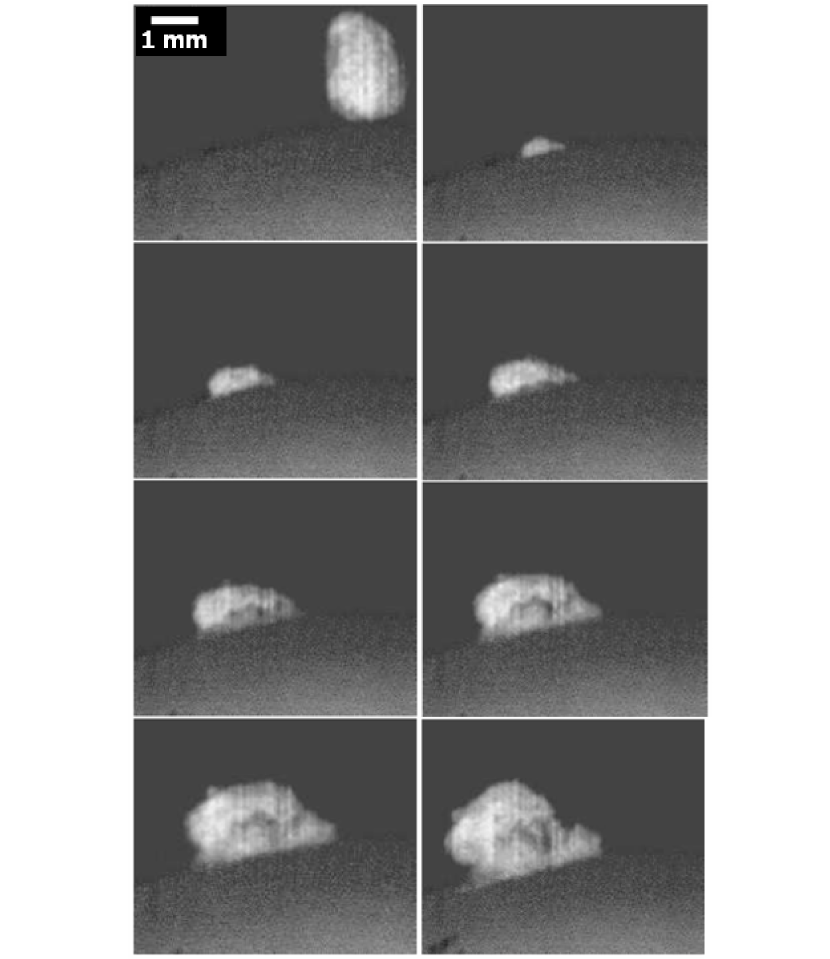
4.4 Semi-elastic rebound and tensile strength
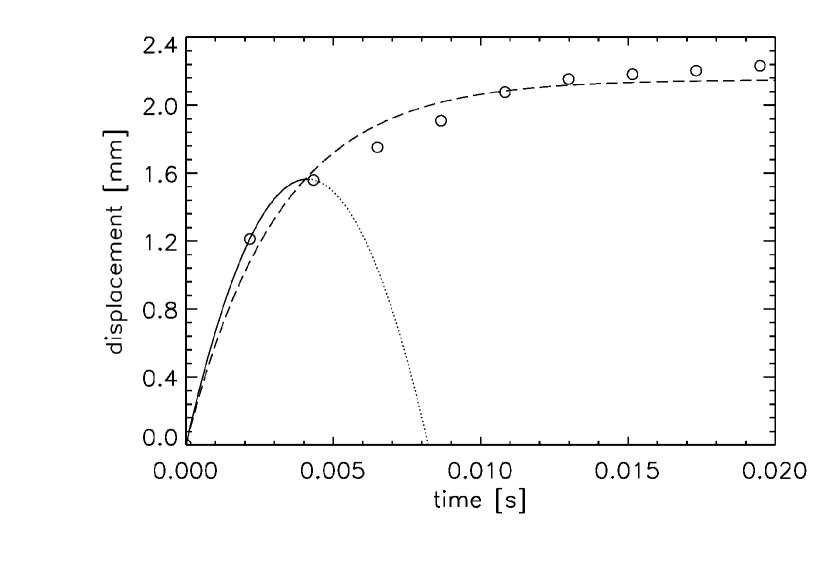
Even for the cases in which the projectile agglomerates stuck to the target after the collision, the total kinetic energy was initially not fully dissipated into plastic deformation of the aggregates. An example is given in Fig. 11. After impacting the target, the projectile (consisting of irregular particles) is rebounding but is not able to escape from the target due to a too strong inter-particle attraction. Fig. 12 shows the temporal dependence of the displacement of the projectile from its deepest penetration during the rebounding phase of its trajectory.
The example in Fig. 11 also demonstrates how the mass transfer described in Sect. 4.2 works: on the way out of the target, the projectile gets decelerated (see Fig. 12) by the adhesion forces between the projectile and the target. As long as the adhesion is larger than the tensile strength (see below), the projectile is attached to the target and drags target material along. In the cases of non-sticking, the tensile strength of the macroscopic dust aggregate (see Table 1) is overcome with some of the target material sticking to the projectile agglomerate. It is clear that the tensile strength is almost reached by the rebounding particle in Fig. 11. Thus, we can use the data in Fig. 12 to estimate the dynamic tensile strength of the high-porosity agglomerate and compare these value to the static measurements of the same material. We can fit a parabolic function
| (5) |
to the first three data points in Fig. 12 and get and for the maximum initial acceleration and velocity of the rebounding projectile (solid curve in Fig. 12). In addition to that, we fit a decaying exponential function of the form
| (6) |
with m and s, to all data points shown in Fig. 12 (dashed curve). Both functions are not motivated by physical considerations but only help to estimate the initial acceleration. Differentiations of the function in Eq. 6 yield the initial velocity and acceleration of and . With an estimated cross section of the particle of and an estimated mass of the rebounding agglomerate of kg (including the mass transfer from the target to the impinging projectile), we get for the lower limit of the tensile strength, , values of
| (7) |
for the parabolic function and of
| (8) |
for the decaying exponential function, respectively. These values are in good agreement with the static values (see paper I and Table 1).
4.5 Intrusion and crater depths
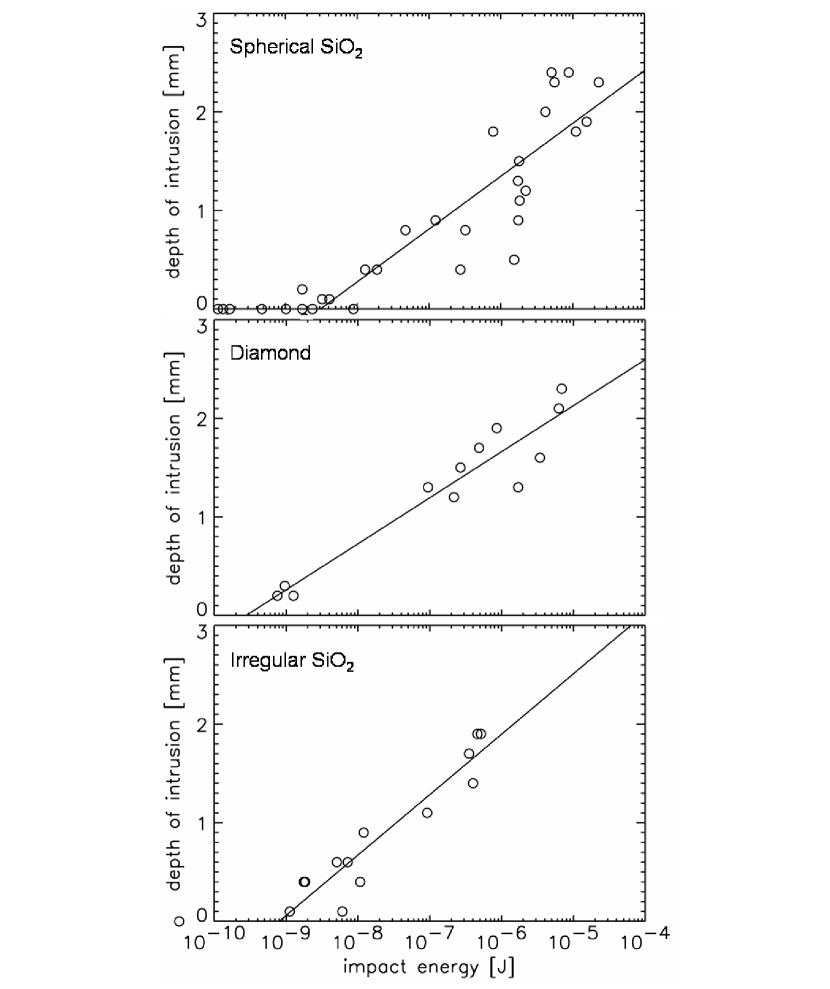
For those impact events in which the projectiles stuck to the target agglomerate we could determine the depth of intrusion perpendicular to the surface. It turned out that the depth of intrusion was generally larger for higher impact energies. Fig. 13 shows the data for all projectile and target materials as a function of the kinetic impact energy of the projectiles.
In order to penetrate into the target agglomerate, the projectiles need to overcome the compressive strength of the target. The data in Fig. 13 suggest that a threshold energy is required to yield a finite penetration depth. For the determination of this value, we assume a linear dependence between the depth of intrusion and the logarithm of the impact energy, as suggested by the data in Fig. 13. A least squares fit of
| (9) |
(for ) results in and for spherical , and for irregular diamond, and and for irregular , respectively (solid lines in Fig. 13).
If we only consider the projectiles whose energies are close to the threshold energy , we find that their masses are kg. With aggregate densities of 300 , 390 , and 182 for spherical , diamond, and irregular , we get typical projectile volumes at the onset of intrusion of , , and , respectively. Using the above-derived minimum impact energies for intrusion, , we can derive the critical impact pressure Pa, Pa, and Pa, respectively, which is remarkably close to the static compressive strengths of the respective target aggregates (see Table 1). Thus, for the onset of penetration, a minimum impact pressure equivalent to the compressive strength is required.
In addition to the depth of intrusion, we also derived for the non-sticking events the crater depths. This was either done by a determination of the shadow lengths inside the craters for oblique illumination or by a measurement of the length of the escaping projectile agglomerate. The crater depth is then approximated by the difference of the length of the escaping projectile (which is, due to the mass transfer between target and projectile, larger than before the impact; see Sect. 4.2) and the length of the part of the projectile protruding out of the target at closest approach. A comparison of the crater depth and the depth of intrusion for the case of spherical monomers (only in that case we have sufficiently many rebounding projectiles) shows that the crater depths are a factor larger than the depths of intrusion. However, the mass transfer is less than a factor of due to only a partial penetration of the projectiles.
4.6 Impact fragmentation and the Influence of Local Surface Curvature and Density Enhancement
In a few cases, the impinging projectile agglomerate fragmented upon impact. Part of the residual fragments left the target agglomerate, the other fragments stuck to the target. Most fragmentation events occurred when the projectile either hit a previously captured projectile or another surface irregularity with low radius of curvature. Thus, we systematically investigated the influence of the local radius of curvature of the target aggregate on the outcome of a collision. For this, we used previously “molded” target aggregates (see Sect. 3 and Fig. 1c) and made a series of impacts of mm-sized, high-porosity projectile aggregates.
As already mentioned in Sect. 4.1 and visible in Fig. 4, the sticking probability is considerably reduced by the surface sculpting. Only 5 out of 25 projectiles stuck to the target, and sticking was apparently restricted to those cases in which the projectile hit a “valley” on the target. In contrast to that, the fragmentation efficiency, while negligible for impacts into smooth flat targets, increases to 24% (6 projectiles). However, most of the projectiles (14) were semi-elastically rebounding after the impact, which makes the rebound probability with 56% the most likely single collisional outcome for the impacts into “molded” targets.
It is clear from these experiments that, besides impact velocity, impact angle, aggregate mass and aggregate packing density, the local radius of curvature and, thus, the collisional history of protoplanetary dust aggregates plays an important role for the outcome of mutual collisions.
5 Discussion: Impact Dynamics of High-Porosity Dust Agglomerates
From the results presented in the previous section, we can derive some fundamental (although approximate and preliminary) dynamical properties of high-porosity dust aggregates. If we assume for simplicity that the aggregates are fully elastic during collisions, we can use the well-known Hertzian equation of motion (Hertz, 1882) for the collision between a spherical particle of radius and mass and an infinitely large sphere
| (10) |
with being the elasticity parameter, defined by
| (11) |
for like materials. Here, and are the modulus of elasticity and Poisson number of the materials, respectively. As our aggregates very likely have Poisson numbers (i.e. they are highly compressive), Eq. 11 reduces to
| (12) |
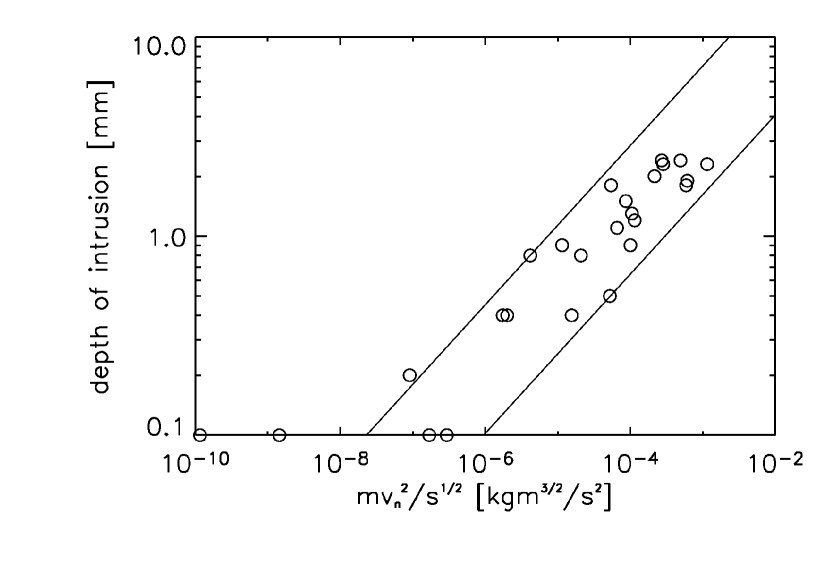
With Eq. 12, Eq. 10 can be solved for the maximum penetration
| (13) |
when is the initial collision velocity. If we identify with the measured intrusion of the projectiles, , and plot these double-logarithmically as a function of the parameter , motivated by the functionality in Eq. 13, we see that we can indeed find a slope close to 2/5 as predicted by Eq. 13 (Fig. 14).
The two straight lines in Fig. 14 formally give Pa and Pa. Taking the geometric mean of these two values, the agglomerates penetrate as deep as if they had a modulus of elasticity of Pa. As the collisions are clearly dominated by plasticity, we expect the compressive strength to be of the same order as the modulus of elasticity, i.e. Pa. A comparison with Fig. 4 from paper I shows that such compressions should lead to a compaction of . Mind, however, that in Eq. 13 needs not to be constant. As was shown by Blum & Schräpler (2004), the compressive stress and the volume filling factor are related through for , with and . Thus, we expect a similar relation between and to be existent.
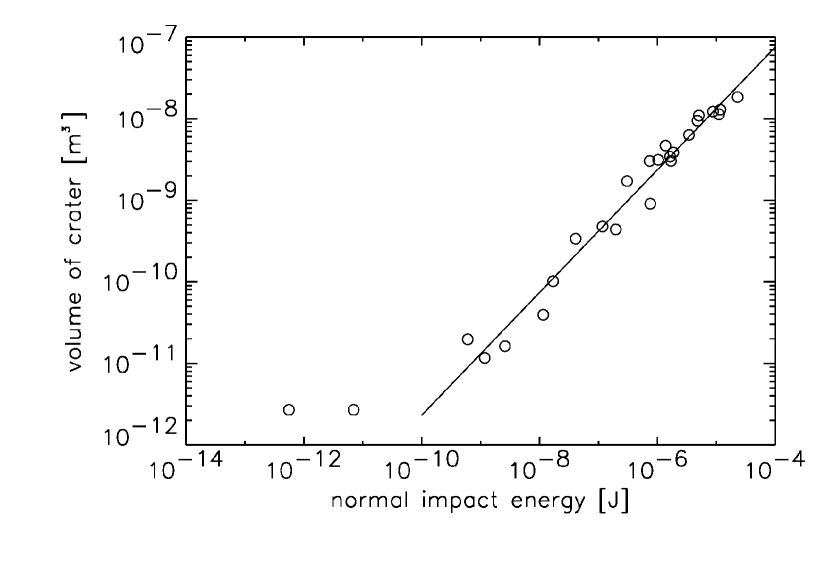
If we define the crater volume by
| (14) |
for and
| (15) |
for , with being the radius of the projectile, we can approximately derive the dynamic impact pressure for fully plastic collisions (Johnson et al., 1985), defined by
| (16) |
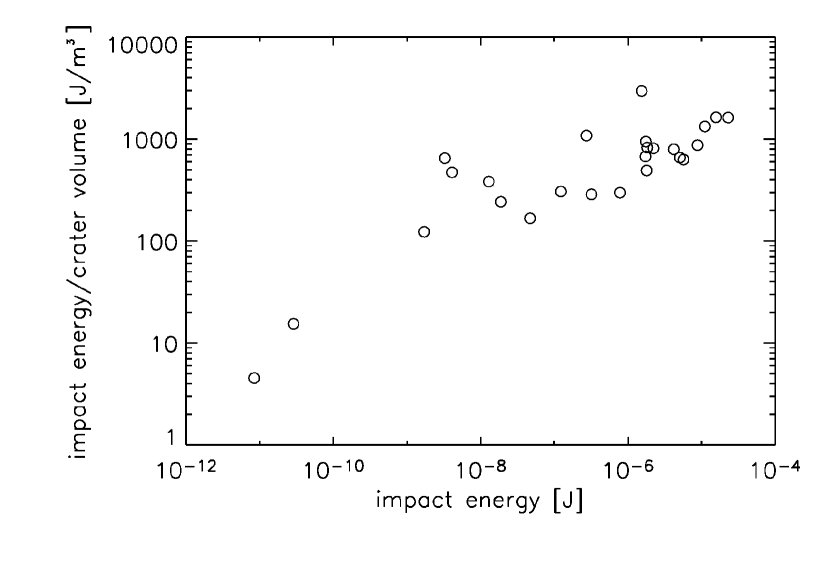
In Fig. 15, we plotted the crater volume as a function of the normal component of the impact energy, . It is evident that there is a strong correlation between these two quantities. We fit a power-law to the data in Fig. 15, with . Thus, the dynamic impact pressure slightly increases with impact energy from Pa to Pa for the impact energy range between J and J (see Fig. 16). The slightly increasing values of towards larger impact energies is probably caused by the compaction of the aggregate volume during impact. For the minimum impact energy for which intrusion was found (see above), , a minimum dynamic pressure of Pa is required to cause the formation of a crater and, thus, compaction of the agglomerate material in the contact zone between projectile and target agglomerate. This pressure is very close to the minimum stress under which the material yields (see Fig. 4 in paper I).
With this data, we can also explain the mass transfer observed in many non-sticking collisions (see Sect. 4.2 and Figs. 7 and 8). During the impact, the projectile and part of the target volume are slightly compacted. As was shown in paper I, aggregate compaction increases the tensile strength of the material. Thus, the compacted parts in the collisional volume have higher inner cohesion so that they are more likely to keep sticking together after the impact.
6 Summary
We performed oblique impact experiments of typically 0.2-3 mm diameter projectile agglomerates into 2.5 cm diameter target agglomerates of identical composition. We used three different particle types (monodisperse spherical with 1.5 diameter, irregular diamond with 1-2 diameter, irregular with 0.1-10 diameter) and produced agglomerates by the random ballistic deposition process (Blum & Schräpler, 2004). Depending on the particle type, the agglomerates had volume filling factors of (for monodisperse ), (for diamond), and (for irregular ), respectively. Impact velocities ranged between 0.1 and 3 m/s.
From the results of our experimental investigation presented in the previous sections, we can draw the following conclusions:
-
1.
For a similar distribution of projectile masses, impact velocities and impact angles, the volume filling factor (porosity) of projectile and target has a considerable influence on the collisional outcome. Whereas very porous dust aggregates () almost always stick, the sticking probability decreases with increasing filling factor for (Figs. 3 - 5).
-
2.
For dust aggregates with volume filling factors , projectiles with diameters mm do only stick in near-central collisions, while near-grazing impacts lead to a rebound of the projectile (see Fig. 3). The reason for the mass dependence of the sticking behavior is the interplay between the energy of the bouncing aggregates (which is, due to an almost mass-independent coefficient of restitution (see Fig. 9), proportional to the aggregate mass) and the contact energy (which is roughly proportional to the aggregates’ cross section). For small aggregates, the inertial energy of the rebounding aggregates is not capable of breaking the contacts, whereas large aggregates easily bounce off. For large aggregates, central collisions lead to a deeper penetration of the projectile aggregate into the target and thus to a larger contact area with stronger binding forces.
-
3.
Collisions which do not lead to sticking between projectile and target agglomerate result, on average, in a mass transfer from the larger to the smaller collision partner, i.e. to a mass loss of the target agglomerate (see Figs. 7 and 8). This can be explained by an impact compaction of material comprising the projectile and part of the target and a resulting higher cohesion (tensile strength) of the compacted material.
-
4.
In the case of non-sticking, most of the kinetic energy of the projectile is dissipated in the collision. The residual energies of the bouncing projectiles (including the mass-transfer effect) are very small for near-central collisions and increase with increasing impact angle up to a few ten percent of the pre-collision energy (see Fig. 10).
-
5.
The tensile strength of the agglomerates made of irregular particles, as estimated in one experiment in which the projectile almost rebound after a collision (see Fig. 11), Pa, is in good agreement with the static measurements (see Table 1). The tensile strength is responsible for aggregate cohesion and sticking upon impact.
-
6.
If we identify the compressive strength of the agglomerates made of spherical particles with the estimated dynamic impact pressure (see Eq. 16 and Fig. 16), we see that the compressive strength increases with impact energy, as was already indicated by the static measurements in paper I. For impact velocities and projectile sizes mm, we get a maximum compressive strength of Pa.
-
7.
Above a threshold value for the impact energy, J, a crater is formed. The crater volume scales with the normal component of the impact energy as . The corresponding dynamical pressure, is only weakly dependent on impact energy, and ranges from Pa to Pa in our experiments. The threshold value for crater formation of Pa corresponds well with the onset of compaction measured by Blum & Schräpler (2004) and paper I. The largest crater volumes were found for the highest impact energies close to the transition between sticking and non-sticking. These crater volumes (see Fig. 15) are typically , Comparison with the masses of the largest (and, thus, most energetic) projectile agglomerates and the projectile densities (see data in Table 1) show that the corresponding projectile volumes are also . Thus, the amount of compaction of the target and projectile agglomerates in these cases is not negligible. From Blum & Schräpler (2004) we can see that at a compression of Pa, the volume filling factor increases from to . If these static compaction measurements are transferrable to the dynamic problem, we conclude that a volume at least as large as twice the projectile’s is compressed to of its previous volume filling factor.
-
8.
Impact fragmentation was only rarely observed for impacts into flat and high-porosity targets. When the target surface was artificially roughened with a local radius of curvature of 1 mm (which resulted in a slight compaction of the target agglomerate to ), the sticking probability was considerably reduced, and bouncing and fragmentation were the dominating processes. Earlier experiments by Blum & Münch (1993) also found impact fragmentation when two similar-sized dust aggregates collide at velocities of a few m/s. Thus, the local radius of curvature of two colliding dust aggregates plays a dominating role in the outcome of the collision.
7 Conclusions
In paper I, we have shown that macroscopic protoplanetary dust aggregates are expected to be very porous. Depending on the collisional history and the size of the aggregates, we expect the dusty objects to have volume filling factors between (for all objects whose collision velocities never exceeded , i.e. for sizes cm) and (for all objects with sizes m). In this paper, we confirmed that collisions among fluffy protoplanetary dust aggregates with velocities lead to impact pressures of Pa and, thus, to a moderate increase in volume filling factor. Collisions between (sub-)mm-sized dust aggregates and cm- to dm-sized fluffy objects are very abundant in the solar nebula and the impact velocities range around (Weidenschilling & Cuzzi, 1993). Thus, our microgravity experiments match the solar-nebula conditions very closely and are directly applicable to growth models.
We find that the sub-mm sized dust aggregates always stick to much larger target aggregates, independent of impact velocity and impact angle. The larger, mm-sized aggregates, however, behave differently. Sticking is restricted to the higher velocities and to the smaller impact angles. This trend was found for dust aggregates consisting of monodisperse spherical particles, for quasi-monodisperse irregular particles as well as for irregular monomer particles with a wide size distribution, although quantitative differences in the sticking probabilities exist. Thus, for random impacts in the solar nebula, the sticking probability in collisions between mm-sized dust aggregates and cm-dm sized dusty bodies is below unity. Moreover, non-sticking (and even fragmentation) is favored when the local radius of curvature at the point of impact of the larger body is similar to the projectile radius. This can be the case for collisions between similar-size dust aggregates or between projectiles and targets with irregular, non-flat surface textures. Another interesting feature we found in our experiments is that non-sticking impacts (i.e. those with higher impact angles) lead to a mass transfer from the larger to the smaller body.
As a consequence, future growth models for protoplanetary dust should take into account that the outcome of a single collision between dust aggregate A and dust aggregate B is not only dependent on the size of A and B and the mutual collision velocity, but is also influenced by the collisional history (e.g. the distribution of local radii of curvature on the surfaces of A and B; compaction) and the (random) impact angle of the particular collision. In addition to that, due to the possible occurrence of mass transfer from a larger body A to a smaller body B (in bouncing collisions) or fragmentation of the smaller object B (e.g. when it hits a surface part of A with a small local radius of curvature), the numerical description of the collisional outcome (and its use in e.g. Smoluchowski’s growth equation) becomes rather complex.
From our experimental findings, we consider it rather unlikely that protoplanetary bodies can grow beyond dm-sizes in a direct and simple hit-and-stick manner. Although our experiments suggest that small projectiles stick at higher velocities than large projectiles, this trend does not imply that km-sized bodies can form by the accumulation of very small dust aggregates or single particles. Recent experiments by Schräpler & Blum (unpublished) show that at impact velocities dust aggregates cannot grow by the accumulation of single grains (and, therefore, also not by the accumulation of small dust aggregates). However, m-sized bodies in protoplanetary disks possess relative velocities with respect to small grains of the order of (Weidenschilling & Cuzzi, 1993). Moreover, experiments by Wurm et al. (2005a) suggest that impacts between dusty projectiles into fluffy dusty targets around never lead to an accumulation of mass on the larger body but lead to strong fragmentation of the projectile and cratering (i.e. mass loss) of the target. A possible way out of this dilemma could be the indirect effect of projectile or fragment capturing by aerodynamic (Wurm et al., 2001a, b) or electrostatic (Blum, 2004) forces or by gravitational collapse in locally overdense regions in the midplane of protoplanetary disks (Johansen et al., 2007).
References
- Blum & Münch (1993) Blum, J., & Münch, M. 1993, Icarus, 106, 151.
- Blum et al. (1998) Blum, J., Wurm, G., Poppe, T., & Heim, L.-O. 1998, Earth, Moon and Planets, 80, 285
- Blum & Wurm (2000) Blum, J., & Wurm, G. 2000, Icarus, 143, 138
- Blum et al. (2000) Blum, J., et al. 2000, Phys. Rev. Lett., 85, 2426
- Blum (2004) Blum, J. 2004, in ASP Conf. Ser. 309, Astrophysics of Dust, ed. A. N.Witt, G. C. Clayton, & B. T. Draine (San Francisco: ASP), 369
- Blum & Schräpler (2004) Blum, J., & Schräpler, R. 2004, Phys. Rev. Lett., 93, 115503
- Blum et al. (2006) Blum, J., Schräpler, R., Davidsson, B. J. R., & Trigo-Rodríguez, J. M. 2006, ApJ, 652, 1768 (paper I)
- Dominik & Tielens (1997) Dominik, C., & Tielens, A. G. G. M. 1997, ApJ, 480, 647
- Harker et al. (2005) Harker, D. E., Woodward, C. E., & Wooden, D. H. 2005, Science, 310, 278
- Heim et al. (1999) Heim, L.-O., Blum, J., Preuss, M., & Butt, H.-J. 1999, Phys. Rev. Lett., 83, 3328
- Hertz (1882) Hertz, H. 1882, J. Reine Angew. Mathematik, 92, 156
- Hörz et al. (2006) Hörz, F., et al. 2006, Science, 314, 1716
- Johansen et al. (2007) Johansen, A., Oishi, J. S., Mac Low, M.-M., Klahr, H., Henning, T., & Youdin, A. 2007, Nature, 448, 1022
- Johnson et al. (1985) Johnson, K. L. 1985, Contact Mechanics (Cambridge: Cambridge University Press)
- Keller et al. (2005) Keller, H. U., et al. 2005, Science, 310, 281
- Kerridge (1993) Kerridge, J. F. 1993, Icarus, 106, 135
- Kessler-Silacci et al. (2006) Kessler-Silacci, J., et al. 2006, ApJ, 639, 275
- Krause & Blum (2004) Krause, M., & Blum, J. 2004, Phys. Rev. Lett., 93, 021103
- Ormel et al. (2007) Ormel, C. W., Spaans, M., & Tielens, A. G. G. M. 2007, A&A, 461, 215
- Paszun & Dominik (2006) Paszun, D., & Dominik, C. 2006, Icarus, 182, 274
- Poppe et al. (2000) Poppe, T., Blum, J., & Henning, T. 2000, ApJ, 533, 454
- Poppe & Schräpler (2005) Poppe, T., & Schräpler, R. 2005, A&A, 438, 1
- Przygodda et al. (2003) Przygodda, F., van Boekel, R., Àbrahàm, P., Melnikov, S. Y., Waters, L. B. F. M., & Leinert, C. 2003, A&A, 412, L43
- Vold (1959) Vold, M. J. 1959, J. Colloid Interface Sci., 14, 168
- Watson et al. (1997) Watson, P.K., Mizes, H., Castellanos, A., & Pérez, A. 1997, in Powders & Grains 97, ed. R. Behringer & J. T. Jenkins (Rotterdam: A. A. Balkema), 109
- Weidenschilling & Cuzzi (1993) Weidenschilling, S. J., & Cuzzi, J. N. 1993, in Protostars and Planets III, ed. E. H. Levy & J. I. Lunine (Tucson: Univ. Arizona Press), 1031
- Wurm & Blum (1998) Wurm, G., & Blum, J. 1998, Icarus, 132, 125
- Wurm et al. (2001a) Wurm, G., Blum, J., & Colwell, J. E. 2001a, Icarus, 151, 318
- Wurm et al. (2001b) Wurm, G., Blum, J., & Colwell, J. E. 2001b, Phys. Rev. E, 64, 046301
- Wurm et al. (2005a) Wurm, G., Paraskov, G., & Krauss, O. 2005a, Phys. Rev. E, 71, 021304
- Wurm et al. (2005b) Wurm, G., Paraskov, G., & Krauss, O. 2005b, Icarus, 178, 253
| Physical property | Symbol | Value | Unit | Reference |
|---|---|---|---|---|
| Spherical particles | ||||
| Material | , non-porous | [A] | ||
| Morphology | spherical | [A] | ||
| Molecular arrangement | amorphous | [A] | ||
| Density | [B] | |||
| Radius | [C] | |||
| Mass | kg | |||
| Surface molecules | Si-OH | [A] | ||
| Surface energy | 0.014 | [D] | ||
| Adhesion force | N | [D] | ||
| Adhesion energy | J | [E,F] | ||
| Rolling-friction force | N | linear extrapolation from [D] | ||
| Rolling-friction energy | J | |||
| Sticking threshold velocity | 1.1 | extrapolated from [E] | ||
| Rolling-threshold velocity | ||||
| Agglomerates of spherical particles | ||||
| Volume filling factor | [I] | |||
| Compressive strength | 500 | [I] | ||
| Tensile strength | 1,100 | [I] | ||
| Irregular diamond particles | ||||
| Material | C, diamond | [G] | ||
| Morphology | irregular | |||
| Density | 3,520 | |||
| Size | [E] | |||
| Agglomerates of irregular diamond particles | ||||
| Volume filling factor | [I] | |||
| Compressive strength | 200 | [I] | ||
| Tensile strength | 200 | [I] | ||
| Irregular particles | ||||
| Material | , non-porous | [H] | ||
| Morphology | irregular | |||
| Density | 2,600 | [H] | ||
| Size | 0.05-5 | 50% of typical particle diameter | ||
| Agglomerates of irregular particles | ||||
| Volume filling factor | [I] | |||
| Compressive strength | 200 | [I] | ||
| Tensile strength | 300 | [I] |
.