Mid-Infrared Spectroscopy of Lensed Galaxies at : The Nature of Sources Near the MIPS Confusion Limit
Abstract
We present Spitzer/IRS mid-infrared spectra for 15 gravitationally lensed, 24 µm–selected galaxies, and combine the results with 4 additional very faint galaxies with IRS spectra in the literature. The median intrinsic 24 µm flux density of the sample is 130 Jy, enabling a systematic survey of the spectral properties of the very faint 24 µm sources that dominate the number counts of Spitzer cosmological surveys. Six of the 19 galaxy spectra () show the strong mid-IR continuua expected of AGN; X-ray detections confirm the presence of AGN in three of these cases, and reveal AGNs in two other galaxies. These results suggest that nuclear accretion may contribute more flux to faint 24 µm–selected samples than previously assumed. Almost all the spectra show some aromatic (PAH) emission features; the measured aromatic flux ratios do not show evolution from . In particular, the high S/N mid-IR spectrum of SMM J163554.2+661225 agrees remarkably well with low–redshift, lower–luminosity templates. We compare the rest-frame 8 µm and total infrared luminosities of star–forming galaxies, and find that the behavior of this ratio with total IR luminosity has evolved modestly from z2 to z0. Since the high aromatic–to–continuum flux ratios in these galaxies rule out a dominant contribution by AGN, this finding implies systematic evolution in the structure and/or metallicity of infrared sources with redshift. It also has implications for the estimates of star forming rates inferred from 24 µm measurements, in the sense that at , a given observed frame 24 µm luminosity corresponds to a lower bolometric luminosity than would be inferred from low-redshift templates of similar luminosity at the corresponding rest wavelength.
Subject headings:
galaxies—infrared: galaxies: high-redshift—galaxies: evolution1. Introduction
The Spitzer Space Telescope (Werner et al., 2004) has been tremendously successful at detecting star–forming galaxies and active galactic nuclei (AGN) at by their emission in the observed–frame 24 µm band. Down to the confusion limit of Jy at 24 µm (Dole et al., 2004), the MIPS instrument (Rieke et al., 2004) can detect luminous infrared galaxies (LIRGs)111Defined as L⊙, where L(TIR) is the total infrared luminosity between 8 and 1000 µm. out to , ultra-luminous infrared galaxies (ULIRGs)222Defined as L⊙. out to , and hyper-luminous infrared galaxies (HLIRGs)333Defined as L⊙. out to even higher redshifts.
Detectability at is increased by strong aromatic emission features, at rest–frame 6–12 µm, that pass through the 24 µm band. Indeed, photometric redshifts place – of the faint 24 µm sources at redshifts above 1.4 (Le Floc’h et al., 2005; Pérez-González et al., 2005; Caputi et al., 2006; Wang, 2006).
For extremely high–luminosity galaxies, spectra have been obtained with the Infrared Spectrograph (IRS, Houck et al. 2004), e.g. Houck et al. (2005); Yan et al. (2007); Menéndez-Delmestre et al. (2007). However, since spectral properties depend strongly on luminosity, results obtained for hyper-luminous galaxies may have limited applicability for the bulk of the IR–detected population. Spectra of lower–luminosity galaxies have been obtained only in a few cases (e.g. Lutz et al. 2005; Teplitz et al. 2007).
Numerous authors (e.g. Caputi et al. 2006; Choi et al. 2006; Reddy et al. 2006) have used the observed 24 µm band as an estimator of star formation rates. Since most of the infrared power is radiated redward of the observed band, the 24 µm diagnostic must be calibrated using low–redshift templates (e.g. Chary & Elbaz 2001; Dale & Helou 2002; Lagache et al. 2004; Brandl et al. 2006; Armus et al. 2007). The central assumption in these works is that the spectra and spectral energy distributions of high-z galaxies are matched accurately by the low–redshift templates. For , the 24 µm band fluxes are strongly influenced by aromatic band emission. Evolution over time either in the behavior of these aromatic bands, in metallicity, or in the geometry and radiative transfer within these infrared sources, could all undermine this central assumption.
To probe these possibilities, we have been obtaining IRS spectra for intrinsically faint 24 µm–selected galaxies at . Our targets are strongly lensed by the gravitational potential of foreground clusters of galaxies, such that their fluxes are amplified by factors of 3–25. Though these galaxies have observed 24 µm flux densities of mJy, sufficient for useful, efficient spectroscopy with IRS, their intrinsic luminosities are down in the LIRG to ULIRG range.
In this paper, we present IRS spectra for the first 15 galaxies in the sample. The median observed flux density is fν(24 µm) mJy, but the median intrinsic flux density is nearly an order of magnitude lower. We compare their aromatic feature flux ratios, and the ratios of their X-ray, aromatic, and total infrared luminosities to those of low–redshift LIRGs and ULIRG samples. We examine in detail the high–quality spectrum of SMM J163554.2+661225, a LIRG at . We merge our sample with four additional objects from the literature (Lutz et al., 2005; Teplitz et al., 2007) to provide a first systematic look at the IRS–measured properties of the faint 24 µm galaxy population.
2. Sample Selection
Our goal was to select sources with intrinsic flux densities close to, or even below, the MIPS 24 µm confusion limit. We first obtained deep 24 µm images of galaxy clusters, generally identified as being massive through high X-ray luminosity. From these 24 µm images, we selected sources within 1.5′ of the cluster center that:
-
•
had observed 24 µm flux densities above 0.4 mJy (to make efficient use of IRS).
-
•
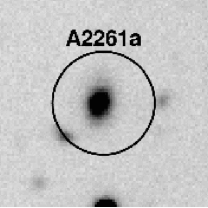
had faint, irregular, or arc–like HST counterparts. This excluded galaxies at the cluster redshift.444A2219a and A2261a lack HST imagery; we instead used ground-based F606W images from the Steward Observatory 90 inch telescope. Both galaxies are known sub-mm sources (see Table 1), and can thus be added to the sample despite the lack of high–resolution optical images.
-
•
had known spectroscopic or probable photometric redshifts .
-
•
had lensing amplification factors calculated to be greater than 3. This restricted selection to clusters with good lensing models. Since amplification depends on the source redshift, if the redshift was unknown, we calculated the amplification for and required amplifications factors greater than 3 over that range.
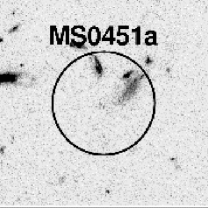
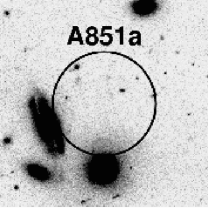
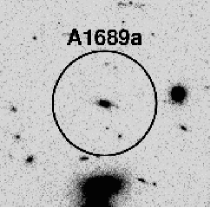
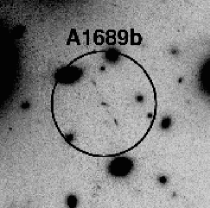
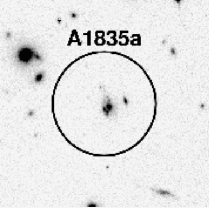
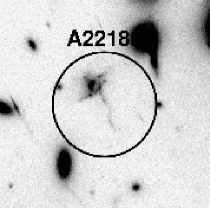
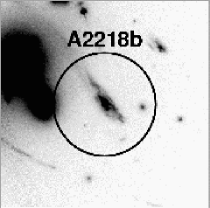
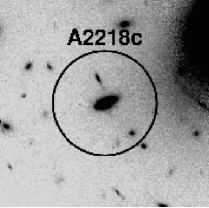
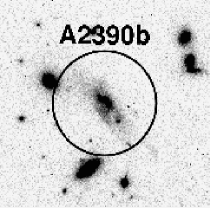
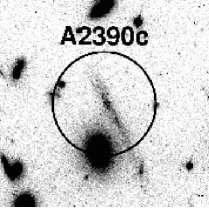
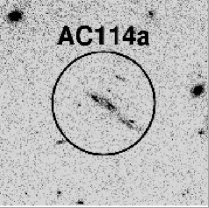
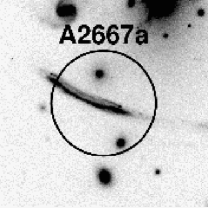
Since submillimeter sources in lensing clusters have been studied extensively, with published amplifications and redshifts, we prioritized sources in the target list with published sub-mm detections. Our sample contains 15 galaxies, targeted in GTO campaigns 82 and 30775. Eight of these galaxies have sub-mm detections in the literature, as referenced in Table 1. Figure 1 shows optical–band images of the sample galaxies.
We supplement the sample with four sources from the literature. We use three of the four sources from Teplitz et al. (2007), with (24 µm) 0.13–0.2 mJy; these are unlensed galaxies at with very long (9–12 hr) IRS exposures, and are not known sub-mm sources. We also use the lensed sub-mm source in A370 from Lutz et al. (2005)555The two other sources from those papers, “2-x” from Teplitz et al. (2007) and the Abell 2125 source from Lutz et al. (2005), have insufficient signal-to-noise for our analysis. with (24 µm)1.36 mJy.
3. Observations and Data Reduction
This paper is based on a combination of imaging with MIPS, spectroscopy with IRS, archival imaging from Chandra, and submillimeter photometry from the literature. Exposure times are summarized in Table 2.
3.1. Spitzer/IRS spectroscopy
Low-resolution IRS spectra were obtained as part of Spitzer GTO programs 82 and 30775 (PI G. Rieke). Data reduction used a package developed by D. Fadda, which has already been successfully used to reduce low-resolution IRS spectra of faint high-z sources (Yan et al., 2007). Residual background, rogue pixels666http://ssc.spitzer.caltech.edu/irs/roguepixels/ (pixels with dark current values abnormally high and variable with time) and cosmic ray hits have to be corrected to obtain an optimal reduction of the data. The package considers all the bidimensional frames produced by the IRS/SSC pipeline. First, background and noise images are produced by coadding frames after masking target and serendipitous spectra on each frame. (The background is better estimated for the PID 30775 observations where both LL1 and LL2 orders provide redundant background measurements, compared to the PID 82 observations using only LL1, where the background can only be determined by differencing nods and thus suffers from contamination by faint sources.)
A robust statistical estimator (biweight) is used to minimize the effects of deviant pixels on the coadded value. This part is iterative in order to allow manual identification of sources. Rogue pixels are then identified by computing the dispersion of the noise around every pixel and flagging pixels which are deviant from the mean local value. Spectral extraction is done optimally (e.g., by using the PSF profile to weight the spectrum), taking into account the spectral distortion, and also rejecting pixels affected by cosmic rays. Finally, the spectra obtained at each position are co-added.
We downloaded and reduced one archival IRS spectrum, from program 3453 (PI P. van der Werf). This is SMM J163555.2+661238, image “A” in Kneib et al. (2004), one of three images of the same triply–imaged sub-mm galaxy in Abell 2218. We obtained an IRS spectrum of the brightest image of this galaxy, SMM J163554.2+661225 (image “B” in Kneib et al. 2004); its 24 µm flux is 1.8 times brighter than the SMM J163555.2+661238. In the archival spectrum, the source was mis-centered across the short axis of the slit, which reduced throughput. Because its signal-to-noise ratio is low, we use the archival spectrum only to confirm the detection of features, and use the spectrum from our program for all analysis.
The IRS spectra are presented in Figure 2. Spectra obtained in programs 82 and 30775 for the same object are plotted separately; observations from the latter program have superior background subtraction. Flux densities are as observed, without any correction for gravitational amplification. When redshifts were known from the literature, or are evident from aromatic emission features in the IRS spectrum, then the upper x-axis shows rest wavelength. Only one source (A2261a) lacks a redshift. Redshifts are listed in Table 1, with a reference if the redshift is from the literature.
The rest–frame spectra were run through PAHFIT (Smith et al., 2007) to fit the continuum and aromatic (PAH) features simultaneously. Measured aromatic fluxes are reported in Table 4.
We allowed PAHFIT to fit the silicate absorption (e.g., we did not specify “NO_EXTINCTION”). Fixing the silicate optical depth at zero changes the best-fit 7.7 µm feature fluxes by (median), the best-fit 8.6 µm feature fluxes by (median), and the best-fit 11.3 µm feature fluxes by (median).
We report fluxes in table 4 for features in which the measured flux is at least twice the uncertainty calculated for that line. We add back in a few features, mostly at 11.3 µm, which are obviously detected even though the errorbars are large.
3.2. Spitzer/MIPS 24 µm and 70 µm photometry
MIPS photometry–mode images at 24 µm and 70 µm were obtained through Spitzer GTO program 83 (PI G. Rieke). Exposure times are given in Table 2 and photometry is given in Table 3. The data were reduced and mosaicked using the Data Analysis Tool (Gordon et al., 2006) with a few additional processing steps (Egami et al., 2006).
Photometry at 24 µm was obtained by PSF fitting, using the IRAF implementation of the DAOPHOT task allstar. The PSF was created empirically using all available images from program 83. An aperture correction of 1.131 was applied, calculated from a Tiny Tim model of the 24 µm Spitzer PSF that extends to ″ (C. Engelbracht, priv. comm.)777 The aperture correction is specific to the DAOPHOT parameters used, in this case sky annulus radii of ″ and ″, and a PSF defined out to ″.
Aperture photometry at 70 µm was performed on the 1.0 pixel scale images. The aperture radius was 16″ (twice the half-width at half-max), the background annulus had radii of 18″ and 39″ (the position of the first airy ring), and an aperture correction of 1.968 was applied.888http://ssc.spitzer.caltech.edu/mips/apercorr/ If the source was undetected, we took the upper limit as the sky noise plus any positive flux in the source aperture.
3.3. Spitzer/IRAC photometry
IRAC images at 3.6, 4.5, 5.8, and 8 µm were obtained as part of GTO program 83 (PI G. Rieke) for five of the six clusters; IRAC data for Abell 1835 were obtained through GTO program 64 (PI G. Fazio). Exposure times are listed in Table 2. IRAC images were mosaicked as described by Huang et al. (2004).
Photometry was obtained by aperture photometry with sky subtraction. The high density of cluster galaxies in the cluster cores necessitated use of irregularly–shaped polygons for both target and sky apertures. The flux density within these polygonal regions was determined using CIAO999http://cxc.harvard.edu/ciao/ Versions 3.2.1 and 3.4.1.1. IRAC photometry is listed in Table 3; the values do not include aperture corrections.
3.4. HST photometry from WFPC2 and ACS
From the HST archive, we downloaded all publically available ACS images for the clusters. We used Multidrizzle (Koekemoer et al., 2002) to distortion–correct each flat-fielded pipeline image, and then cross–correlated the images to measure the small (″) coordinate registration offsets with high precision. The measured offsets were then used by multidrizzle for the final mosaicking. The data were photometered using the same technique as for the IRAC bands.
3.5. Chandra ACIS imagery
From the Chandra archive, we downloaded all publically available ACIS observations of clusters with IRS targets in this sample: observation ID numbers 529 (catalog ADS/Sa.CXO#obs/00529) and 902 (catalog ADS/Sa.CXO#obs/00902) for MS0451; 1663 (catalog ADS/Sa.CXO#obs/01663), 5004 (catalog ADS/Sa.CXO#obs/05004), and 540 (catalog ADS/Sa.CXO#obs/00540) for A1689; 495 (catalog ADS/Sa.CXO#obs/00495) and 496 (catalog ADS/Sa.CXO#obs/00496) for A1835; 1454 (catalog ADS/Sa.CXO#obs/01454), 1666 (catalog ADS/Sa.CXO#obs/01666), and 553 (catalog ADS/Sa.CXO#obs/00553) for A2218; 896 (catalog ADS/Sa.CXO#obs/00896) for A2219; 5007 (catalog ADS/Sa.CXO#obs/05007) and 550 (catalog ADS/Sa.CXO#obs/00550) for A2261; 4193 (catalog ADS/Sa.CXO#obs/04193), 500 (catalog ADS/Sa.CXO#obs/00500), and 501 (catalog ADS/Sa.CXO#obs/00501), for A2390; and 1562 (catalog ADS/Sa.CXO#obs/01562) for AC114.
We used CIAO (3.3) to update the CTI correction when necessary and remove data obtained during periods of high solar flares. We mosaicked multiple overlapping observations following the CIAO thread “Reprojecting Images: Making an Exposure–corrected Mosaic”.
For X-ray detections, fluxes were determined from the individual (not mosaicked) observations as described in Marcillac et al. (2007). X-ray flux upper limits () were determined from the mosaicked images and mosaicked exposure maps as in Donley et al. (2005), except that the encircled energy radius was used, and the Monte–Carlo sky apertures were taken close to the source (within 30″) in order to sample a representative cluster background.
Chandra X-ray fluxes and upper limits for the 2–8 keV and 0.5–8 keV bands are reported in Table 5.
3.6. Long–wavelength photometry from the literature
Eight galaxies in our sample, and one galaxy from the extended (literature) sample, have submillimeter detections in the literature; these are listed and referenced in Table 1. Four sources were detected at 15 µm by ISO: A851a and A2218b (Barvainis et al., 1999), A2390b Lemonon et al. (1998), and A2390c (Metcalfe et al., 2003). We will use this photometry to help determine the total infrared luminosities of the sources.
4. Discussion
4.1. Aromatic Feature Flux Ratios in High–Redshift Galaxies
We now test whether the mid-IR spectra of star–forming galaxies, with their prominent aromatic emission features, show evidence for evolution from to high redshift.
Given its high quality, we first examine the IRS spectrum for SMM J163554.2+661225 in detail. The image is amplified by a factor of (Kneib et al., 2004), such that without lensing, its 24 µm flux density would have been 53 Jy, at the MIPS confusion limit. The galaxy redshift, from H, is (Kneib et al., 2004). Its IRS spectrum, presented in Figure 3, shows highly–significant detections of aromatic features at 6.22, 7.7, 8.33, and 8.61 µm. (The lower-quality spectrum from program 3453 confirms the detection of these aromatic features, though the two longer–wavelength features are detected at low significance.) Overplotted with arbitrary normalization are two spectral templates: a) the starburst galaxy NGC 2798 from the SINGS survey (Dale et al., 2006); and b) the average spectrum of 13 nearby starburst galaxies with little apparent AGN contribution (Brandl et al., 2006), whose mean IR luminosity is L⊙. Coincidentally, this is also the L(TIR) of NGC 2798.
The spectrum in Figure 3 closely resembles the low–redshift, lower–luminosity (by a factor of 15) templates. Aromatic flux ratios are reported in Table 6, along with those we measure for the Brandl template, and those reported for the SINGS sample. The strength of the 8.6 µm feature in SMM J163554.2+661225 relative to those at 6.2 µm and 7.7 µm, is within the – variation within the SINGS sample. In addition, the flux ratios of SMM J163554.2+661225 are a close match to those of the Brandl et al. (2006) average starburst template; while 7.7 µm is relatively stronger than the template, the difference is comparable to the standard deviation of line ratios for individual galaxies that were averaged to create the template. Thus, we conclude that this galaxy has aromatic feature flux ratios that are consistent with those observed for lower–luminosity, starbursting galaxies.
While the other spectra in the sample have lower signal-to-noise ratios, they are still sufficient, in the aggregate, to test whether high–redshift galaxies have markedly different aromatic flux ratios. Figure 4 compares, for four aromatic feature flux ratios, the observed ratios in our sample with those measured for the low–redshift Brandl et al. (2006) template. Though the errorbars in individual measurements are sizable, Figure 4 confirms the result seen for SMM J163554.2+661225: star–forming galaxies at have aromatic feature ratios consistent with those of star–forming galaxies.
Variations in aromatic feature ratios have been reported in certain HII regions—this may be attributable to variations in size, composition, and ionization state of the carriers (Draine & Li 2007 and references therein). In particular, large PAHs emit more strongly at 11.3 µm, and neutral PAHs emit much more strongly at 3.3 and 11.3 µm than charged PAHs (Draine & Li, 2007; Galliano, 2006; Allamandola et al., 1989). That our measured feature ratios at are consistent with those measured at suggests that the dust grain size and ionization distributions are not strongly evolving.
4.2. Evidence for Compact Source Accretion
Active galactic nuclei are detectable in multiple ways—by the dust they heat that radiates in the mid-IR; by X-rays emitted from the accretion disk coronae; and by high–excitation or broad emission lines. We now examine the evidence for AGN activity in our extended sample.
The first AGN diagnostic we examine is X-ray luminosity, plotted in Figure 5 against aromatic luminosity. Most of the sample are X-ray non–detections, at limiting luminosities that rule out X-ray–loud QSOs or bright Seyferts, although an X-ray–weak or highly obscured AGN could still be present (c.f. Donley et al. 2005; Alonso-Herrero et al. 2006). Two of the four galaxies from the literature, and three of the galaxies in our program are detected in X-rays: two have no apparent aromatic features (sources A2261a and A2390a); and the other, source A2390b, is interesting in that it contains a luminous X-ray–emitting AGN, yet its spectrum still shows aromatic features. That source emits roughly equal power in the 7.7 µm aromatic feature (scaled from the 11 µm feature) and at 10–30 keV, reminiscent of the more luminous source CXO GWS J141741.9+522823 discussed by Le Floc’h et al. (2007).
We now consider a second AGN diagnostic, the relative contribution of aromatic versus continuum emission to the mid-IR flux. At low redshift, low aromatic feature equivalent widths have been demonstrated as an effective AGN diagnostic (Armus et al. 2007; Brandl et al. 2006, and Devost et al. (in prep.)). However, it is extremely difficult to measure equivalent widths accurately for the high–redshift IRS sources, due to the limited wavelength baseline, the fact that the aromatic features have broad wings, and most importantly, imperfect sky subtraction which adds a (positive or negative) pedestal to each spectrum. For example, for SMM J163554.2+661225 (our highest–quality spectrum), we cannot measure an accurate equivalent width due to the difficulty in determining the true continuum level. We are able to set a lower limit of µm (rest-frame, conservatively assuming a high continuum level), which is a typical value for low–redshift star–forming galaxies. For the other spectra in the sample, equivalent widths are even harder to measure.
Therefore, we instead create an aromatic-to-mid-IR flux ratio, which we define as the ratio of the flux in the 7.7 µm PAH feature (in erg s-1 cm-2, as fit by PAHFIT) to the MIPS photometry at 24 µm (in Jy, corrected for bandwidth compression to .) This metric does not suffer as strongly from the difficulty in determining the continuum level. In the low–redshift, star–forming comparison sample we construct in § 4.4, this ratio ranges from 7–32 . We thus take as a dividing line between spectra dominated by star formation (above the value), and spectra with substantial AGN contribution (below the value). This discriminant selects the following mid-IR spectra101010For A2390b, we scale from the flux in the 11 µm aromatic feature, using the average 7.7/11 µm flux ratio of 3.6 from Smith et al. (2007). as having substantial AGN contribution: A370a, MS0451a, A1689a, A2218c, A2261a, A2390a. Thus, of 19 galaxies with adequate spectra, 6 show strong indications of AGN contribution to their mid-IR outputs.
A third indication of AGN activity is a mid-IR spectrum that rises steeply with increasing wavelength. Four spectra (A2261a, A2218c, A1689a, and A370a) show this behavior; none has detected aromatic emission.
A fourth indication of AGN activity is the presence of broad or highly excited lines in an optical spectrum. Of the spectroscopy that has been published, or is in preparation, for our sample (see references in Table 1), three show evidence for AGN: A1689a has a Keck spectrum showing highly ionized neon (J. Richard et al. in prep.); A2390a has a Keck spectrum (see Appendix) which shows Lyman with FWHM km s-1, typical of an AGN narrow line region; and the spectrum of A370a is reported to contain AGN lines (Lutz et al., 2005).
A fifth indication of AGN activity is a high ratio of [Ne III] 15.5 µmto [Ne II] 12.8 µm. Solar–metallicity starbursts are not observed to excite this line ratio above unity (Thornley et al., 2000; Rigby & Rieke, 2004), whereas the harder continuum of AGN do. Eight spectra cover rest-frame 12.8µm; [Ne II] is detected in 6 of these. Six spectra cover rest-frame 15.5 µm; [Ne III] is detected in 4. Of the four galaxies where both lines are detected (A1689a, Ab2218b, A2390b, and A2667a), only in A1689a does the [NeIII]/[NeII] ratio exceed unity: . This high line ratio offers additional evidence that A1689a hosts a luminous AGN. The other, lower line ratios are more difficult to interpret.
The results for these AGN diagnostics are compiled in Table 8. Combining these diagnostics, 8 galaxies out of the sample of 19 have at least one indication of AGN activity (X-ray detection, low aromatic contribution to the mid-IR flux, rising mid-IR spectrum, or optical AGN lines). Five galaxies have two different diagnostics that indicate AGN. Thus, we find that of the faint 24 µm sources in this sample have some nuclear activity; the confidence interval is –. Further, in of the sample, the AGN strongly affects or dominates the mid-IR spectrum; the confidence interval is –. (Confidence intervals were calculated using eqn. 26 of Gehrels (1986).)
The high proportion of AGN in our sample of high–redshift LIRGS and ULIRGs mirrors the general behavior of local IR-luminous galaxies, where AGN become substantially more common with increasing luminosity (e.g., Lutz et al. 1998). Though the errorbars are large given the small sample size, the high proportion () of AGN sufficiently powerful to dominate the mid–IR spectra may be inconsistent with the frequent assumption that Jy, sources are dominated by star formation, with AGN a modest contaminant. Our result, if confirmed with better statistics, has implications for 24 µm–derived star formation rates in deep surveys, where it is often assumed that the mid-IR outputs of high–redshift, faint galaxies are dominated by strong aromatic features from star formation. It also implies that a higher fraction of the integrated 24 µm flux on the sky may arise from accretion than previously thought.
4.3. Total infrared luminosity
We now determine the total infrared (TIR) luminosities of the lensed sources, so that we may examine the dependence of aromatic feature emission on total infrared luminosity, and how this behavior may evolve with redshift.
4.3.1 SMM J163554.2+661225
The sub-mm galaxy behind Abell 2218 has exceptionally good photometric coverage from 0.4 to 850 µm. Since it is triply–lensed, we increase the signal-to-noise ratio of its multiband photometry by using fluxes from all three images, weighed by the amplifications given in Kneib et al. (2004). (Bright neighboring galaxies forced us to use only image A and B for the optical and IRAC photometry.) Figure 6 plots this photometry.
We fit redshifted Chary & Elbaz (2001) and Dale & Helou (2002) templates to the 24, 70, 450, and 850 µm photometry, corrected for lensing amplification. For each template family, we determine the best–fit template and the range of acceptable templates, then determine L(TIR) for those templates in a method consistent with the definition given in Table 1 of Sanders & Mirabel (1996) using 12, 25, 60, and 100 µm photometry. We estimate the intrinsic total infrared luminosity of SMM J163554.2+661225 as:
As Figure 6 shows, the best–fit Chary & Elbaz (2001) template over-predicts all µm points, especially at 70 µm. The best–fit Dale & Helou (2002) template is a better match to the shape of the overall infrared SED and also has high aromatic feature equivalent widths, consistent with the spectrum of the source. Thus, this galaxy’s intrinsic luminosity is that of a LIRG.
4.3.2 Other Galaxies
We adopt a similar approach for the other galaxies with sufficient far–infrared and submillimeter data to provide reasonable constraints. We tried both Dale & Helou (2002) and Chary & Elbaz (2001) templates, fitted to fall just below any upper limits so long as they were compatible with the other constraints, i.e., to give a maximal luminosity. Two galaxies are fit poorly by a star–forming template, and much better by an AGN template, Mrk 231; MS0451a may be, as well. The ranges of acceptable luminosities and the preferred templates are listed in Table 3. Dale & Helou (2002) templates provided generally better fits to our sample than Chary & Elbaz (2001) templates, as expected given the results of Marcillac et al. (2006) for galaxies, fitting ISO, Spitzer, and VLA photometry.
4.4. 8 µm (rest)-to-Total Luminosity Ratio
We now consider the aromatic and total infrared (TIR) luminosities of the star–forming galaxies in the lensed sample, and how this ratio behaves as a function L(TIR). We compare to higher–luminosity star–forming galaxies at , as well as comparable–luminosity star–forming galaxies at and . We interpret the properties of the high redshift galaxies strictly in terms of properties that are well–determined for local analogs, so we can test whether inconsistencies emerge.
4.4.1 The comparison sample
To probe rest-frame 8 µm and total infrared (TIR) luminosities for local galaxies, we use the SINGS sample (photometry from Dale et al. 2005) supplemented in the ULIRG range by IRAS 09111-1007, 10565+2448, 12112+0305, 14348-1447, 17208-0014, 22491-1808, and Arp220 (Farrah et al., 2003; Armus et al., 2007), all selected because they appear to be dominated by young stars rather than AGN.111111IRAS 12112+0305 and 14348-447 are double nuclei sources. We also include IRAS 00262+4251, 01388-4618, 02364-4751, 16474+3430, 23128-5919, and 23365+3604 from Rigopoulou et al. (1999). The strength of the aromatic features relative to the continuum indicates that all these galaxies are also dominated by star formation. For the galaxies from Farrah et al. (2003) and Armus et al. (2007), we determined 8 µm photometry from archival IRAC images. In our reductions, we included a correction for the extended source calibration. For those galaxies in Rigopoulou et al. (1999), we converted the tabulated continuum and aromatic 7.7 µm peak fluxes into 8 µm photometric values by comparing with templates for galaxies in common between Armus et al. (2007): IRAS 12112+0305, 14348-1447, 1525+3609, and 22491-1808, plus Arp 220. The peak–to–peak scatter was a factor of two (in agreement with the finding of Chary & Elbaz (2001)). We add a variety of LIRGS (Alonso-Herrero et al., 2006b), again avoiding any galaxies with indications of significant levels of AGN power. We took IRAS measurements from Sanders et al. (2003), and computed L(TIR) to be consistent with the approach taken in that paper. We define L(8 µm) as being proportional to , and use similar definitions for all luminosities at specific wavelengths. Figure 7 shows the relation between rest–frame L(8 µm) and L(TIR) for these galaxies.
4.4.2 Results from the literature at 0.85
We add a sample of infrared galaxies at from Marcillac et al. (2006). This paper utilizes 15 µm data from ISO as well as 24 µm data from Spitzer and, for a subset, radio data from the VLA; the authors found that the galaxies had rest–frame L(8 µm)/L(12 µm) ratios at the high end of the local galaxy dispersion. We make the assumption that L(12 µm) correlates with L(TIR) in that sample, as it is observed to do well at . We computed rest 8 µm luminosities for the members of the sample with 0.55 z 1.2 and adequate 15 µm photometry, and corrected them to the IRAC 8 µm band by comparison with the IRS spectrum of IRAS 2249, a local star-formation–dominated ULIRG. We took L(TIR) from the Dale & Helou (2002) template fits (Marcillac et al., 2006). The results are shown in green in Figure 8.
There is no mid-IR spectroscopy for these galaxies, but if they had strong mid-IR contributions from AGN we would expect substantial dispersion in the L(8µm) to L(TIR) ratio. Such a large dispersion is not seen.
4.4.3 Results from the Literature at
We now compare the behavior of the 8m luminosity vs. L(TIR) at with that seen in local luminous galaxies. We first discuss three results from the literature, and then show how our new measurements complement them.
First, we took the stacked galaxy template of Daddi et al. (2005) and compared the ratio of observed 850 µm to 24 µm flux densities, referred to the appropriate rest wavelengths for each of the local star–forming galaxies where there is sufficient data to construct an accurate SED template (IRAS 1211, 1434, 17208, 2249, and Arp 220). Excluding Arp 220, for which the ratio is 54, the average value for the other four galaxies is 14, whereas the Daddi et al. (2005) template indicates a value of 6.5. Thus, the template indicates stronger emission at rest 8 µm relative to the submm than is typical of local star–forming ULIRGs.
We also compare with total infrared luminosity derived from submm measurements. Since the rest wavelength for the observed 850 µm point in the Daddi et al. template is 293 µm, we construct the average ratio of L(TIR)/L(293 µm) for local LIRGs and ULIRGs with L⊙ and high quality measurements at 350–450 µm (IRAS 09111, 1211, 1434, and 17208, Arp 220, and NGC 1614). We correct the flux densities for the differing effective filter bandwidths using the IRAS 2259 template. We correct to 293 µm assuming a spectral slope of -3.3, determined from a larger sample of local ULIRG templates. We find
L(TIR) () L(293 µm)
and then plot the Daddi et al. point as a red square in Figure 7. We did not fit the observations of lower luminosity galaxies, because the scatter at lower luminosities is very large, probably due to varying amounts of cold and warm dust in the infrared-emitting objects.
Second, we make use of the stacking analysis carried out by Papovich et al. (2007). They report observed–frame 24 µm and 70 µm stacked photometry for galaxies that are both undetected in X-rays and have non–power–law IRAC SEDS, and are therefore assumed to be powered predominantly by star formation. We computed the rest 8 µm and 24 µm flux densities for this category (since they quote values for , the rest wavelengths are represented directly by the measurements). We corrected the 8 µm flux density (derived from that observed at 24 µm) to the equivalent for the IRAC band, again using the SED of IRAS 2249. Finally, we compute L(TIR) from the relation derived from our local galaxy sample:
L(TIR) L(24 µm, rest)α, where .
The rms scatter around this relation is only dex. The resulting values are shown in Figure 7 as red diamonds (we omitted the lowest flux density bin from Papovich et al. because the signal to noise ratio at 70 µm is too low).
Third, we use the results of Yan et al. (2007). We select those galaxies that have , and rest–frame 6.2 µm equivalent widths (measured by Sajina et al. 2007) greater than 0.3 µm. From Armus et al. (2007), this equivalent width threshold should select galaxies dominated by star formation. The galaxies selected (MIPS 289, 8493, 15928, 16144, 22530) are all categorized as “type 1” by Yan et al. (2007), meaning their spectra contain strong aromatic features. The median rest-frame EW(7.7 µm) is 2.5 µm, corroborating that star formation dominates the mid-IR spectra. We converted the tabulated L(5.8 µm) for these galaxies into L(8 µm) from an average template for our local ULIRG sample (IRAS 2249).
We estimate L(TIR) for these sources using the radio-infrared relation. We describe our adjustment of this relation for use at high redshift in detail in a forthcoming publication (N. Seymour et al., in preparation) but give a short summary here. Yun et al. (2001) have quantified the relation for a large number of local galaxies, finding that the average ratio of flux density at 60m to 1.4GHz is 110 independent of luminosity. The results of Yun et al. (2001) have not been K-corrected; since the infrared SEDs drop rapidly toward the blue, while the radio spectrum drops slowly, these corrections are a fairly steep function of redshift. They enter at a significant level only for the high luminosity galaxies, because they tend to be at higher redshift than the lower luminosity ones. Including them increases the indicated ratio to at a L(TIR) L⊙. A second issue is that the radio outputs of LIRGs and ULIRGs often show signs of free-free absorption, which can decrease the outputs at 1.4GHz. To estimate this effect, we took the 19 star forming galaxies with adequate data from Condon et al. (1991) and computed an average slope for them of between 1.49 and 8.44 GHz. Taking the 8.44 GHz value to represent the un-absorbed radio output and assuming the intrinsic slope is (Condon et al., 1991), we revise the IR/radio ratio downward to 140 to take account of absorption; this value is calculated by extrapolating from 8.44 GHz to 1.4 GHz and comparing results for slopes of and . The second concern is that the radio-infrared ratio may be a function of redshift (Kovács et al., 2006; Vlahakis et al., 2007). We tested this suggestion by determining a K-correction between 1.4 GHz and 850m for an average of local LIRG and ULIRG templates (to be published by Alonso-Herrero et al.) and applying it to a large sample of high redshift sources. We find that the K-correction accurately reproduces the observed behavior with no offset, indicating there is no significant evolution of the relation. We have therefore used a value of 140 for the intrinsic flux density ratio at rest wavelengths to convert the radio measurements to TIR ones. We extrapolated the radio fluxes observed to a rest frequency of 1.4 GHz with a slope of . The redshift usefully makes the observed rest frequency significantly higher than 1.4 GHz, reducing the effects of free-free absorption for the high-z galaxies. To convert to L(TIR), we use the relationship from our local sample,
L(TIR) 740 L(60)α, where
with an rms scatter of 0.08 dex.
It is important to point out that both of the corrections we have derived have the effect of reducing the change we find in L(8m)/L(TIR). That is, using the relation derived by Yun et al. (2001) and applying the proposed change at high redshift (Kovács et al., 2006; Vlahakis et al., 2007) would have both resulted in a much larger change than reported. Therefore, we are taking a conservative approach.
We take radio flux densities for the galaxies observed by Yan et al. (2007) from Condon et al. (2003) as tabulated on the SSC website121212http://ssc.spitzer.caltech.edu/fls/extragal/vla.html. Two of the remaining galaxies are detected at low significance as indicated by inspection of the grey scale images for them (MIPS 429 and 506), so we enter rough values of 0.1 mJy for them. For MIPS 289, which is undetected, we assigned an upper limit of 0.1 mJy. We reject the source MIPS 8493 because of fringing in the VLA image at its position. The other four (MIPS 289, 15928, 16144, and 22530) are in regions where the radio images are clean. We correct their observed radio measurements to the rest frame assuming a radio k-correction of , since a typical slope for a starburst radio spectrum is (Condon et al., 1991). We plot the resulting L(TIR) and L(8 µm) values in Figure 8 as circles (filled for the detections, open for the upper limit.)
4.4.4 8 µm-to-TIR ratio for the lensed galaxies
The lensed galaxies described in this paper bridge the luminosity divide between the extremely high–luminosity galaxies in the literature, and the comparison LIRG and ULIRG samples at and . For the lensed sample we can determine which galaxies have mid-IR spectra dominated by star formation, using the aromatic feature strengths. For the subset of lensed galaxies with submm measurements and good upper limits at 70 µm, the SEDs are well enough constrained for a direct determination of L(TIR). Therefore, the lensed galaxies can cleanly test for evolution with redshift in the behavior of the L(8 µm)/L(TIR) ratio.
We use the aromatic-to-mid-IR flux ratio introduced in §4.2 to select galaxies whose mid-IR spectra are dominated by star formation. The ratio selects A2219a, A1689b, A2218a, and A1835a as all having strong aromatic emission; their ratios range from 7–24 , with an average value of . By comparison, our sample of local star–forming LIRGs and ULIRGs has a range in ratio of 7–32 , with an average of . That is, the relative aromatic feature strength is virtually the same for the two samples, with no evidence that AGN have significantly augmented the 8 µm fluxes of our star–forming high–z sub-sample. The EW(6.2 µm) criterion we used for the Yan et al. (2007) sample would have returned the same sample of star–forming lensed galaxies, except that A2219a lacks 6.2 µm coverage and thus would not have been selected.
We plot the four lensed galaxies as red triangles in Figure 8.
4.5. Comparison of 8 m-to-TIR ratio at high and low redshift
The L(8 m)/L(TIR) ratio is important for two reasons: 1) it is one of the most accessible measures of the physical behavior of infrared emission as a function of redshift; and 2) many studies rely on fluxes at observed–frame 15 or 24 µm to deduce L(TIR) and related properties of galaxies at or 2, and are thus relying on the behavior of L(8 m)/L(TIR). Figures 7 and 8 illustrate the important result that this ratio is well–behaved for star–forming galaxies out to . In fact, this good behavior is a reasonably demanding test, since the various samples at are subject to different selection effects and have L(TIR) derived in different ways, yet they all follow a single trend. To recapitulate the different methods: the lensed galaxies are selected largely on amplification factor, and we measured L(TIR) directly from template fits to rest frame mid- and far-IR and submm photometry. The four galaxies from Yan et al. (2007) were selected on the basis of colors and brightness at 24 µm, and we estimated L(TIR) from the radio-infrared relation. The stacked galaxies from Papovich et al. (2007) were selected based on faint K-band and 24 µm detections; we estimated L(TIR) from rest 24 m measurements. The stacked galaxies from Daddi et al. (2005) were originally selected from BzK colors indicating they are at and were stacked based on selections at a variety of wavelengths, and we used rest submillimeter measurements to estimate L(TIR).
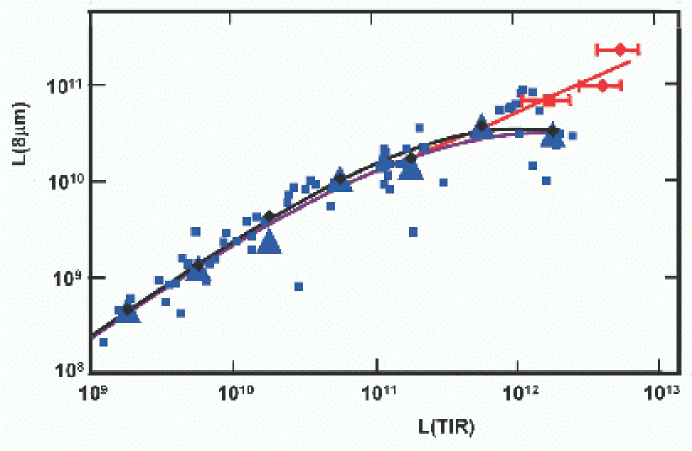
Having noted the overall uniform behavior, and the general similarity of this behavior independent of redshift, we now evaluate the evidence from Figures 7 and 8 for modest evolution with redshift. Specifically, there is a tendency for the ratio L(8m)/L(TIR) to decrease with increasing luminosity for the local galaxies for L L⊙, but this tendency seems reduced for the galaxies at . In fact, the high redshift galaxies appear to have SED behavior similar to normal local galaxies of lower luminosity in this regard.
We have made two tests of the significance of this difference. The first is based on the stacking results of Daddi et al. (2005) and Papovich et al. (2007). Both studies select the galaxies to stack on the basis of K-band detections, and therefore the mid– and far–infrared characteristics of the galaxies should be representative of the entire population of IR-active galaxies (i.e., there is no bias toward a specific L(8m)/L(TIR). To have an analogous set of data for the local galaxies, we have averaged their L(8m)/L(TIR) ratios in luminosity intervals of ; these averages are shown as the large blue triangles in Figure 7. We have then fitted the averaged data points, shown as a blue line. To test whether the high redshift stacked results were compatible with the same fit, we carried out a second fit in which we included the three stacked points. For the galaxies above L⊙, we then compared for the low redshift galaxies only in the two cases. We found that this is 4.5 times larger if the three stacked points at are included in the fit; that is, there is a strong indication that a single functional fit cannot be used for both the local galaxies and for those stacked at .131313This analysis makes the assumption that low–luminosity galaxies have similar behavior at low and high redshift.
To determine whether a few anomalous local galaxies could affect this conclusion, we repeated the procedure but using a more robust average for the luminosity-binned ratios. For each bin with ten or more items, we discarded the two highest and two lowest ratios and then averaged the remainder. Where there were less than ten items, we retained the straight average. The highest luminosity bin, which is responsible for most of the change in slope of the relation between the two luminosities, has ten objects and hence its average was recomputed. The results were virtually identical to those with the straight averages, as shown in Figure 7.
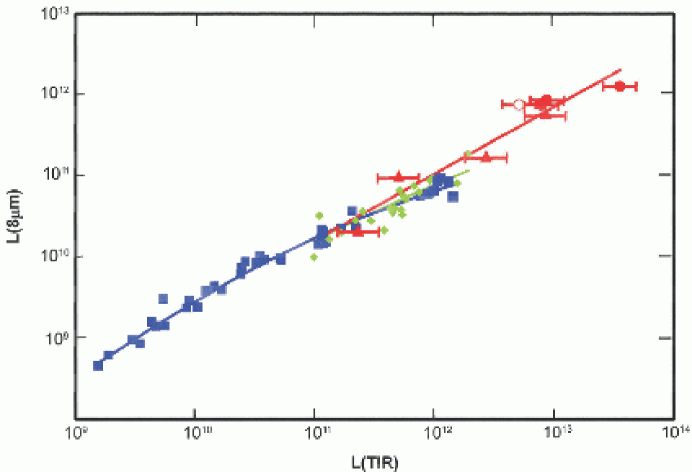
A second test was applied to the high redshift galaxies measured individually, either by Yan et al. (2007), or by us. In the case of the Yan et al. sample, we expect a strong bias toward objects with a large ratio of L(8m)/L(TIR), because they selected relatively bright objects for spectroscopy, given the sensitivity limitations of the IRS. Our sample was selected on a combination of 24m flux density and lensing amplification, so a bias is likely, although perhaps less severe.
To compare with these two studies, we selected a local sample with relatively high 8 m output by removing all the galaxies that are below the fit made to the averaged values (above). This sample is shown in Figure 8. It is noteworthy that the scatter in L(8m)/L(TIR) is small, with no outliers toward high L(8m), so this is an appropriate comparison sample for cases where a bias is suspected. As before, we carried out two fits, one just to the local galaxies, and another to them plus the eight individually measured high redshift ones. We found that for the low redshift sample with L L⊙ increased by a factor of 2.5 if we included the high redshift galaxies in the fit. Comparing Figure 8 with Figure 7, the discrepancy would be substantially larger if we had included all the local galaxies in our fits. This result confirms that found for the stacked samples, namely that a single functional fit is not a good fit to the data over all redshifts.
Another comparison can be made with the sample of infrared galaxies at from Marcillac et al. (2006). The results fall in a region occupied by both low and high redshift fits in Figure 8, which confirms the relatively modest change in L(8m)/L(TIR) with redshift, but (not surprisingly given the small difference between and 2) does not definitively deviate from either fit. In making this comparison, we have assumed that the galaxies studied by Marcillac et al. (2006) have a bias toward bright 15m observed flux densities. If instead we treat them as an unbiased sample and average them in luminosity intervals, they fall along (or slightly above) the fit for the sample in Figure 7.
The tendency at high redshift for relatively strong 8m emission could arise either through a contribution of an extra, AGN-powered component at 8 m (e.g. the extra 5.8 µm continuum claimed by Sajina et al. 2007 and the mid-IR excess galaxies with hard X-ray emission discussed by Daddi et al. 2007b), or to a change in the properties of the stellar–powered infrared–emitting regions. The AGN explanation runs counter to our selection of individual galaxies with strong aromatic features that correspond to equivalent widths typical of purely star forming local galaxies. It is also counter to the precautions taken in the stacking analyses to exclude AGN (e.g., Papovich et al. 2007). In addition, AGN contributions would come in a broad range, so it would be hard to explain the consistent behavior of the five high redshift samples in Figures 7 and 8 if AGN were causing the departure from the behavior from local star forming galaxies. Finally, the behavior we see is similar to that found by Zheng et al. (2007) in a stacking analysis at ; specifically, they report that the far-IR SEDs appear to resemble those of local galaxies of lower luminosity. Thus, while AGN may boost 8 µm emission in other sources, it is unlikely that AGN contamination is responsible for the behavior seen in Figures 7 and 8.
We conclude that star-forming galaxies have a mild trend toward increasing L(8 µm)L(TIR) ratio with redshift that reaches up to a factor of at . In other words, L(8 µm) does not turn over with increasing L(TIR) for galaxies as it does at low redshift. This probably helps explain why some high–redshift galaxies have higher µm aromatic equivalent widths than are observed for local ULIRGs (Desai et al., 2007; Menéndez-Delmestre et al., 2007; Sajina et al., 2007), though direct comparisons cannot be made because there are not local galaxies with such extremely high luminosities. Because the lensed galaxies and stacked samples directly probe the – L⊙ range at , we can directly compare to galaxies at similar luminosity rather than extrapolating.
That aromatic luminosities do not turn over with L(TIR) in high redshift galaxies may be related to lower densities and optical depths of the infrared–emitting regions in the high-z galaxies. Lower optical depths would result in part if the metallicity were lower, resulting in a higher gas-to-dust ratio. Draine et al. (2007) show that the dust content of galaxies has a very steep dependence on their metallicity. The densities and optical depths of the star forming regions would also be lower if the high luminosities are associated with star formation on large spatial scales in the high–redshift galaxies, as opposed to strongly–concentrated, major-merger–associated nuclear star formation in local ULIRGs. Such very dense regions in local ULIRGs appear to account for the scattering of points below the trend line.
Use of local templates to estimate L(TIR) for high-z galaxies detected at 24 m has indicated the existence of very high luminosities at and beyond (e.g., Yan et al. 2007.) The change in L(8 µm)/L(TIR) suggested here would reduce L(TIR) for a given L(8 µm) by a factor of . As shown in the figure, in our sample there is only one galaxy selected to be dominated by star formation that has a L(TIR) significantly exceeding L⊙.141414This galaxy was selected as star–forming based on its EW(6.2 µm) (Sajina et al., 2007), but its EW(7.7 µm) is unusually low, which may indicate a substantial AGN contribution. A luminosity of L⊙ corresponds to a star formation rate of M⊙ yr-1 if we use the local calibration (Kennicutt, 1998), and is suggestively close to the theoretical maximum luminosity that a starburst is allowed by causality arguments—that star formation throughout a galaxy should not transpire faster than the dynamical timescale (Lehnert & Heckman, 1996; Elmegreen, 1999). (The actual maximum value depends on efficiency and dynamical mass.) Thus, our lower calibration for L(8 µm)/L(TIR) may remove the discrepancy between L(TIR) inferred for high redshift galaxies and plausible upper limits on what a starburst can produce. Spatially–resolved imaging of high–redshift starbursts (e.g. Nesvadba et al. 2007) can test whether they are in fact forming stars at the dynamical limit.
5. Summary and Implications
The 24 µm photometric band of Spitzer efficiently detects galaxies out to , and is being used as an extinction–robust measure of star formation rates in the distant universe. We present new IRS spectra and MIPS photometry of gravitationally–amplified galaxies, and use them in concert with archival Chandra images and published submillimeter photometry to investigate the nature of the very faint 24 µm sources.
The aromatic feature flux ratios observed in our spectra agree well with those of star–forming template spectra at . This result implies that dust size and ionization distribution are not strongly evolving with redshift. Thus, for star–forming galaxies with little AGN contribution, the mid-IR spectra can be approximated by star–forming templates.
At , the 24 µm data probe the 8 µm rest wavelength region. We find that the ratio of rest-frame 8 µm luminosity to total infrared luminosity is approximately the same as for local galaxies of similar L(TIR). However, the relationship does not appear to hold perfectly. Combining data from the literature with this sample, we demonstrate that star–forming galaxies have higher L(8 µm) luminosities for a given L(TIR) than low–redshift analogs. Functionally, the break in the L(8 µm) vs. L(TIR) relationship occurs at a 10-times-higher L(TIR) at than it does at . We speculate that this is due to lower optical depths in the IR–emitting regions of the high–z galaxies, perhaps because of lower metallicity or because star formation is more spatially extended than in local ULIRGs (e.g., across a disk rather than in a compact nucleus). This result has important implications for mid-IR–derived star formation rates at , and may indicate a maximum star–forming luminosity of a few L⊙.
The results just summarized were found for sources where AGN do not contribute substantially to the mid-IR spectra, as determined by the aromatic-to-mid-IR flux ratio. But 6 of the 19 mid-IR spectra in our extended sample do show a strong AGN. Including other AGN diagnostics (X-ray detections and optical emission lines), 8 of the 19 galaxies show evidence for nuclear activity. The prevalence of AGN in this sample may contradict the frequent assumption that the 24 µm flux density in 100 Jy sources at is dominated by star formation, with AGN a modest contaminant.
Appendix A Notes on Individual Sources
A.1. Source A2390a
Johan Richard obtained a Keck spectrum for this source, shown in Figure 9. The strong Lyman emission is redshifted by , and the line velocity spread (FWHM km s-1) indicates that the source is an AGN.
A.2. Source A2261a
This sub-mm galaxy (Chapman et al., 2002) lacks a spectroscopic redshift; submillimeter and radio-based photometric estimates place it at Chapman et al. (2002) and (Aretxaga et al., 2003). It is the only source without a redshift in our sample. Our spectrum should be sensitive to the 11 µm complex for , and to the 7.7 µm aromatic feature for . Thus, for the aromatic features to fall outside the IRS spectral coverage, the source would have to have very low () or very high () redshift. If the source were at , it must be times more luminous than M82 to have produced the observed 24 µm flux density. It seems more probable that this source lies at and lacks aromatic emission.
References
- Akiyama et al. (2003) Akiyama, M., Ueda, Y., Ohta, K., Takahashi, T., & Yamada, T. 2003, ApJS, 148, 275
- Allamandola et al. (1989) Allamandola, L. J., Tielens, G. G. M., & Barker, J. R. 1989, ApJS, 71, 733
- Alonso-Herrero et al. (2006) Alonso-Herrero, A., et al. 2006, ApJ, 640, 167
- Alonso-Herrero et al. (2006b) Alonso-Herrero, A., Rieke, G. H., Rieke, M. J., Colina, L., Pérez-González, P. G., and Ryder, S. D. 2006, ApJ, 640, 167
- Appleton et al. (2004) Appleton, P. N., et al. 2004, ApJS, 154, 147
- Aretxaga et al. (2003) Aretxaga, I., Hughes, D. H., Chapin, E. L., Gaztañaga, E., Dunlop, J. S., & Ivison, R. J. 2003, MNRAS, 342, 759
- Armus et al. (2007) Armus, L., et al. 2007, ApJ, 656, 148
- Barvainis et al. (1999) Barvainis, R., Antonucci, R., & Helou, G. 1999, AJ, 118, 645
- Bicay & Helou (1990) Bicay, M. D., & Helou, G. 1990, ApJ, 362, 59
- Brandl et al. (2006) Brandl, B. R., et al. 2006, ApJ, 653, 1129
- Caputi et al. (2006) Caputi, K. I., et al. 2006, ApJ, 637, 727
- Chapman et al. (2002) Chapman, S. C., Scott, D., Borys, C., & Fahlman, G. G. 2002, MNRAS, 330, 92
- Charmandaris et al. (2004) Charmandaris, V., et al. 2004, ApJS, 154, 142
- Chary & Elbaz (2001) Chary, R., & Elbaz, D. 2001, ApJ, 556, 562
- Choi et al. (2006) Choi, P. I., et al. 2006, ApJ, 637, 227
- Condon et al. (1991) Condon, J. J., Huang, A.-P., Yin, Q. F., & Thuan, T. X. 1991, ApJ, 378, 65
- Condon et al. (2003) Condon, J. J., Cotton, W. D., Yin, Q. F., Shupe, D. L., Storrie-Lombardi, L. J., Helou, G., Soifer, B. T., & Werner, M. W. 2003, AJ, 125, 2411
- Cowie et al. (2002) Cowie, L. L., Barger, A. J., & Kneib, J.-P. 2002, AJ, 123, 2197
- Daddi et al. (2007a) Daddi, E., et al. 2007a, submitted to ApJ, astro-ph/0705.2831v1
- Daddi et al. (2007b) Daddi, E., et al. 2007b, submitted to ApJ, astro-ph/0705.2832v1
- Daddi et al. (2005) Daddi, E., et al. 2005, ApJ, 631, L13
- Dale et al. (2005) Dale, D. A., et al. 2005, ApJ, 633, 857
- Dale et al. (2006) Dale, D. A., Smith, J.D., Armus, L., et al. 2006, ApJ, 646, 161
- Dale & Helou (2002) Dale, D. A., & Helou, G. 2002, ApJ, 576, 159
- Desai et al. (2007) Desai, V., et al. 2007, ApJin press, (arXiv:0707.4190)
- Dole et al. (2004) Dole, H., et al. 2004, ApJS, 154, 93
- Donley et al. (2005) Donley, J. L., Rieke, G. H., Rigby, J. R., & Pérez-González, P. G. 2005, ApJ, 634, 169
- Downes & Solomon (2003) Downes, D., & Solomon, P. M. 2003, ApJ, 582, 37
- Draine et al. (2007) 2007ApJ…663..866D Draine, B. T., et al. 2007, ApJ, 663, 866
- Draine & Li (2007) Draine, B. T., & Li, A. 2007, ApJ, 657, 810
- Ebbels et al. (1998) Ebbels, T., Ellis, R., Kneib, J.-P., Leborgne, J.-F., Pello, R., Smail, I., & Sanahuja, B. 1998, MNRAS, 295, 75
- Egami et al. (2006) Egami, E., Rieke, G. H., Fadda, D., & Hines, D. C. 2006, ApJ, 652, L21
- Egami et al. (2006) Egami, E. et al. 2006, ApJ, 647, 922
- Elmegreen (1999) Elmegreen, B. G. 1999, ApJ, 517, 103
- Farrah et al. (2003) Farrah, D., Afonso, J., Efstathiou, A., Rowan-Robinson, M., Fox, M., & Clements, D. 2003, MNRAS, 343, 585
- Frayer et al. (1998) Frayer, D. T., Ivison, R. J., Scoville, N. Z., Yun, M., Evans, A. S., Smail, I., Blain, A. W., & Kneib, J.-P. 1998, ApJ, 506, L7
- Frayer et al. (1999) Frayer, D. T., et al. 1999, ApJ, 514, L13
- Freedman et al. (2001) Freedman, W. L., et al. 2001, ApJ, 553, 47
- Frye & Broadhurst (1998) Frye, B., & Broadhurst, T. 1998, ApJ, 499, L115
- Garrett et al. (2005) Garrett, M. A., Knudsen, K. K., & van der Werf, P. P. 2005, A&A, 431, L21
- Galliano (2006) Galliano, F. 2006, ArXiv Astrophysics e-prints, arXiv:astro-ph/0610852
- Gehrels (1986) Gehrels, N. 1986, ApJ, 303, 336
- Gordon et al. (2006) Gordon, K. D., Rieke, G. H., Engelbracht, C. W. et al. 2005, PASP, 117, 503
- Helou et al. (1985) Helou, G., Soifer, B. T., & Rowan-Robinson, M. 1985, ApJ, 298, L7
- Houck et al. (2004) Houck, J. R., et al. 2004, ApJS, 154, 18
- Houck et al. (2005) Houck, J. R., et al. 2005, ApJ, 622, L105
- Huang et al. (2004) Huang, J.-S., et al. 2004, ApJS, 154, 44
- Ivison et al. (2000) Ivison, R. J., Smail, I., Barger, A. J., Kneib, J.-P., Blain, A. W., Owen, F. N., Kerr, T. H., & Cowie, L. L. 2000, MNRAS, 315, 209
- Kennicutt (1998) Kennicutt, R. C., Jr. 1998, ARA&A, 36, 189
- Kneib et al. (2004) Kneib, J.-P., van der Werf, P. P., Kraiberg Knudsen, K., Smail, I., Blain, A., Frayer, D., Barnard, V., & Ivison, R. 2004, MNRAS, 349, 1211
- Knudsen (2007) Knudsen, K. K., van der Werf, P. P., Kneib, J.-P. 2007, MNRAS, submitted
- Knudsen (2004) Knudsen, K. K. 2004, Ph.D. Thesis, Leiden University
- Knudsen et al. (2006) Knudsen, K. K., et al. 2006, MNRAS, 368, 487
- Koekemoer et al. (2002) Koekemoer, A., Fruchter, A., Hook, R., Hack, W. 2002, HST Calibration Workshop, p. 337
- Kovács et al. (2006) Kovács, A., Chapman, S. C., Dowell, C. D., Blain, A. W., Ivison, R. J., Smail, I., & Phillips, T. G. 2006, ApJ, 650, 592
- Lagache et al. (2004) Lagache, G., et al. 2004, ApJS, 154, 112
- Le Floc’h et al. (2007) Le Floc’h, E., et al. 2007, ApJ, 660, L65
- Le Floc’h et al. (2005) Le Floc’h, E., et al. 2005, ApJ, 632, 169
- Lehnert & Heckman (1996) Lehnert, M. D., & Heckman, T. M. 1996, ApJ, 472, 546
- Lemonon et al. (1998) Lemonon, L., Pierre, M., Cesarsky, C. J., Elbaz, D., Pello, R., Soucail, G., & Vigroux, L. 1998, A&A, 334, L21
- Lutz et al. (1998) Lutz, D., Spoon, H. W. W., Rigopoulou, D., Moorwood, A. F. M., & Genzel, R. 1998, ApJ, 505, L103
- Lutz et al. (2005) Lutz, D., Valiante, E., Sturm, E., Genzel, R., Tacconi, L. J., Lehnert, M. D., Sternberg, A., & Baker, A. J. 2005, ApJ, 625, L83
- Marcillac et al. (2006) Marcillac, D., Elbaz, D., Chary, R. R., Dickinson, M. E., Galliano, F., & Morrison, G. 2006, A&A, 451, 57
- Marcillac et al. (2007) Marcillac, D., Rigby, J. R., Rieke, G. H., & Kelly, D. M. 2007, ApJ, 654, 825
- Menéndez-Delmestre et al. (2007) Menéndez-Delmestre, K., et al. 2007, ApJ, 655, L65
- Metcalfe et al. (2003) Metcalfe, L., et al. 2003, A&A, 407, 791
- Motohara et al. (2005) Motohara, K., et al. 2005, AJ, 129, 53
- Nesvadba et al. (2007) Nesvadba, N. P. H., et al. 2007, ApJ, 657, 725
- Papovich et al. (2007) Papovich, C. et al. 2007, ApJ, submitted
- Pello et al. (1991) Pello, R., Sanahuja, B., Le Borgne, J.-F., Soucail, G., & Mellier, Y. 1991, ApJ, 366, 405
- Pérez-González et al. (2005) Pérez-González, P. G., et al. 2005, ApJ, 630, 82
- Reddy et al. (2006) Reddy, N. A., Steidel, C. C., Fadda, D., Yan, L., Pettini, M., Shapley, A. E., Erb, D. K., & Adelberger, K. L. 2006, ApJ, 644, 792
- Rieke et al. (2004) Rieke, G. H., et al. 2004, ApJS, 154, 25
- Rigby & Rieke (2004) Rigby, J. R., & Rieke, G. H. 2004, ApJ, 606, 237
- Rigopoulou et al. (1999) Rigopoulou, D., Spoon, H. W. W., Genzel, R., Lutz, D., Moorwood, A. F. M., & Tran, Q. D. 1999, AJ, 118, 2625
- Sand et al. (2005) Sand, D. J., Treu, T., Ellis, R. S., & Smith, G. P. 2005, ApJ, 627, 32
- Sanders et al. (2003) Sanders, D. B., Mazzarella, J. M., Kim, D.-C., Surace, J. A., & Soifer, B. T. 2003, AJ, 126, 1607
- Sanders & Mirabel (1996) Sanders, D. B., & Mirabel, I. F. 1996, ARA&A, 34, 749
- Sajina et al. (2007) Sajina, A. Yan, L., Armus, L., Choi P., Fadda, D., Helou, G., & Spoon, H. 2007, astro-ph/0704.1765
- Siebenmorgen & Krügel (2007) Siebenmorgen, R., & Krügel, E. 2007, A&A, 461, 445
- Smail et al. (2000) Smail, I., Ivison, R. J., Owen, F. N., Blain, A. W., & Kneib, J.-P. 2000, ApJ, 528, 612
- Smail et al. (2002) Smail, I., Ivison, R. J., Blain, A. W., & Kneib, J.-P. 2002, MNRAS, 331, 495
- Smail et al. (2005) Smail, I., Smith, G. P., & Ivison, R. J. 2005, ApJ, 631, 12
- Smith et al. (2005) Smith, G. P., Kneib, J.-P., Smail, I., Mazzotta, P., Ebeling, H., & Czoske, O. 2005, MNRAS, 359, 417
- Smith et al. (2007) Smith, J. D. T., Draine, B. T., Dale., D. A., et al. 2007, ApJ, 656, 770
- Spergel et al. (2003) Spergel, D. N., et al. 2003, ApJS, 148, 175
- Teplitz et al. (2007) Teplitz, H. I., et al. 2007, ApJ, 659, 941
- Thornley et al. (2000) Thornley, M. D., Schreiber, N. M. F., Lutz, D., Genzel, R., Spoon, H. W. W., Kunze, D., & Sternberg, A. 2000, ApJ, 539, 641
- Vlahakis et al. (2007) Vlahakis, C., Eales, S., & Dunne, L. 2007, MNRAS, 379, 1042
- Wang (2006) Wang, Y. P. 2006, ApJ, 638, 138
- Werner et al. (2004) Werner, M. W., et al. 2004, ApJS, 154, 1
- Yan et al. (2007) Yan, L., et al. 2007, ApJ, 658, 778
- Yun et al. (2001) Yun, M. S., Reddy, N. S., & Condon, J. J. 2001, ApJ, 554, 803
- Zheng et al. (2007) Zheng, X. Z., Dole, H., Bell, E. F., Le Floc’h, E., Rieke, G. H., Rix, H.-W., & Schiminovich, D. 2007, ApJ in press, astro-ph/0706.0003
| RA(J2000) | DEC(J2000) | sub-mm name | ref | PID | z | ref | amp | |
|---|---|---|---|---|---|---|---|---|
| Our sample | ||||||||
| MS0451a | 04:54:07.12 | 03:00:36.4 | 1 | 1 | ||||
| A851a | 09:42:54.55 | +46:58:44.3 | SMM J09429+4658 | A | 2 | 1 | ||
| A1689a | 13:11:28.04 | 01:19:18.7 | 2 | 2 | ||||
| A1689b | 13:11:29.14 | 01:20:46.5 | SMM J13115-01208 | B | 2 | 2 | 25–47 | |
| A1835a | 14:01:04.96 | +02:52:24.8 | SMM J140105+025223.5 | C | 12 | 3 | ||
| A2218a | 16:35:54.18 | +66:12:24.8 | SMM J163554.2+661225 | D | 1 | 4 | ||
| A2218b | 16:35:55.16 | +66:11:50.8 | SMM J163555.2+661150 | E | 2 | 5 | ||
| A2218c | 16:35:59.12 | +66:11:47.4 | 2 | 1 | 6.7 | |||
| A2219a | 16:40:19.50 | +46:44:00.5 | SMM J16403+46440 | F | 1 | 1 | ||
| A2261a | 17:22:21.00 | +32:07:05.5 | SMM J17223+3207 | F | 12 | 1 | ||
| A2390a | 21:53:33.24 | +17:42:10.6 | 12 | 6 | ||||
| A2390b | 21:53:34.43 | +17:42:21.6 | 12 | 7 | ||||
| A2390c | 21:53:34.540 | +17:42:03.0 | ‘Source 14’ | G | 2 | 8 | ||
| AC114a | 22:58:49.79 | 34:48:47.0 | 2 | 1 | ||||
| A2667a | 23:51:40.00 | 26:04:52.0 | 2 | 9 | ||||
| Additional sources from the literature | ||||||||
| Teplitz-1 | 3:32:44.00 | -27:46:35.0 | 8 | 2.69 | 10 | 1.0 | ||
| Teplitz-1-BzK | 3:32:38.52 | -27:46:33.5 | 8 | 2.55 | 10 | 1.0 | ||
| Teplitz-2 | 3:32:34.85 | -27:46:40.4 | 8 | 1.09 | 10 | 1.0 | ||
| A370a | 2:39:51.87 | -1:35:58.78 | SMM J02399-0136 | A | 9 | 2.81 | 11 | 2.45 |
Note. — Columns:
1) source;
2–3) coordinates;
4) sub-mm name, if source has a sub-mm detection in the literature;
5) reference for detected sub-mm counterpart: “A” is Smail et al. (2002); “B” is Knudsen (2004) and Knudsen (2007); “C” is Smail et al. (2000); Ivison et al. (2000); “D” is Kneib et al. (2004); “E” is Knudsen et al. (2006); “F” is Chapman et al. (2002); “G” is Cowie et al. (2002).
6) Spitzer program in which IRS spectra were obtained: “1” signifies PID 82; “2” signifies PID 30775; “8” signifies PID 252; “9” signifies PID 3241;
7) redshift;
8) redshift reference: “1” means redshift was determined from our IRS spectra; “2” is based on Keck spectra (J. Richard et al. in prep.); “3” is from Frayer et al. (1999); “4” is from Kneib et al. (2004); “5” is from Ebbels et al. (1998); “6” is from Keck spectra presented in the Appendix; “7” is from Pello et al. (1991); “8” is from Frye & Broadhurst (1998); “9” is from Sand et al. (2005); “10” is from Teplitz et al. (2007); “11” is from Frayer et al. (1998) and also Lutz et al. (2005).
9) amplification estimated from the lensing models. Values from the literature are footnoted; un-footnoted values are new;
| Cluster | t(24 µm) | t(3.6 µm) | t(IRS, LL) | t(Chandra) |
|---|---|---|---|---|
| MS0451 | 3.66bbOnly order LL1. | 53 | ||
| A851 | 6.34aaBoth LL1 and LL2 were given this exposure time. | 0 | ||
| A1689 | 40 | |||
| a | 7.31aaBoth LL1 and LL2 were given this exposure time. | |||
| b | 14.63bbOnly order LL1. | |||
| A1835 | 3.66bbOnly order LL1.; 3.66aaBoth LL1 and LL2 were given this exposure time. | 29 | ||
| A2218 | 58 | |||
| a | 3.66bbOnly order LL1. | |||
| b | 3.66aaBoth LL1 and LL2 were given this exposure time. | |||
| c | 7.31aaBoth LL1 and LL2 were given this exposure time. | |||
| A2219 | 3.66bbOnly order LL1. | 41 | ||
| A2261 | 5.85bbOnly order LL1.; 7.31aaBoth LL1 and LL2 were given this exposure time. | 33 | ||
| A2390 | 109 | |||
| a | 3.66bbOnly order LL1.; 5.61aaBoth LL1 and LL2 were given this exposure time. | |||
| b | 3.66bbOnly order LL1.; 5.61aaBoth LL1 and LL2 were given this exposure time. | |||
| c | 7.31aaBoth LL1 and LL2 were given this exposure time. | |||
| AC114 | 7.31aaBoth LL1 and LL2 were given this exposure time. | 70 | ||
| A2667 | 1.95aaBoth LL1 and LL2 were given this exposure time. | 9.2 |
Note. — Exposure times, in kiloseconds, for the following bands: Spitzer/MIPS 24 µm; Spitzer/IRAC 3.6 µm; and Spitzer/IRS long-low grating. The 24 µm exposure time is the median (per-pixel) exposure time within the central 4′ by 4′ box.
| f(3.5 µm) | f(4.5 µm) | f(5.7 µm) | f(8.0 µm) | f(24 µm) | (PAH/tot) | f(70 µm) | L(TIR) | template | |
|---|---|---|---|---|---|---|---|---|---|
| MS0451a | 6.3E-11 | CE aaMrk 231 template may also fit. | |||||||
| A851a | 8.4E-11 | 2.7 (2.3–3.6) bbUsing amplification factor of 1.3. | DH | ||||||
| A1689a | |||||||||
| A1689b | 2.4E-10 | 1.6 (0.43–2.4) | DH | ||||||
| A1835a | 1.4E-10 | 6.8 (4.2–11) | DH | ||||||
| A2218a | 2.0E-10 | 7.6 (5.7–9.5) | DH | ||||||
| A2218b | 4.8 (2.8–5.3) | DH | |||||||
| A2218c | 1.3 (0.88–2.0) | Mrk 231 | |||||||
| A2219a | 7.1E-11 | 2.9 (2.7–3.4) | DH | ||||||
| A2261a | —ccL(TIR) cannot be usefully constrained because the redshift is unknown. | ||||||||
| A2390a | 5.8E-11 | ||||||||
| A2390b | 1.7 (1.1–2.5) | Mrk 231 | |||||||
| A2390c | 8.2 (5.5–11) | DH | |||||||
| AC114a | 1.4E-10 | ||||||||
| A2667a | |||||||||
| Literature sample | |||||||||
| Teplitz-1 | |||||||||
| Teplitz-1-BzK | |||||||||
| Teplitz-2 | |||||||||
| A370a | |||||||||
Note. — Columns: 1) Source name. 2–5) IRAC photometry, in Jy. Formal errors from the photometry are quoted, though field crowding probably and aperture corrections probably introduce additional – errors. The photometry for A2218a is superior since it is multiply imaged (with different crowding). Crowding is too severe to quote photometry for A1689b, A2219a, and A2390c. 6) Observed 24 µm flux density, in mJy, from DAOPHOT PSF-fitting. Errorbars from DAOPHOT are overly optimistic and not quoted; we use errorbars of 0.1 mJy for template fitting. 7) Aromatic–to–mid-IR flux ratio, as defined in §4.2, for the sample. 8) Observed 70 µm flux density, in mJy, from aperture photometry. Errorbars are dominated by the sky. 9) Total infrared luminosity, our best–fit and the range of acceptable templates, in L⊙. 10) Best-fitting template: Chary & Elbaz (2001) or Dale & Helou (2002).
| src | 6.2 | 7.7 | 8.3 | 8.6 | 11.3 | 12.0 | 12.6 | 13.6 | 14.2 | 16.4 | 17 | |||||||||||
|---|---|---|---|---|---|---|---|---|---|---|---|---|---|---|---|---|---|---|---|---|---|---|
| MS0451a | ||||||||||||||||||||||
| A851a | 2.8 | 0.6 | 15.6 | 0.8 | 2.4 | 1. | 2.7 | 0.8 | ||||||||||||||
| A1689a | ||||||||||||||||||||||
| A1689b | ||||||||||||||||||||||
| A1835a | ||||||||||||||||||||||
| A2218a | ||||||||||||||||||||||
| A2218b | ||||||||||||||||||||||
| A2218c | ||||||||||||||||||||||
| A2219a | ||||||||||||||||||||||
| A2390a | ||||||||||||||||||||||
| A2390b | ||||||||||||||||||||||
| A2390c | 35 | 11 | 11. | 8 | 17. | 12 | 6.3 | 1.5 | ||||||||||||||
| AC114a | ||||||||||||||||||||||
| A2667a | 102 | 11 | 12 | 3 | 22 | 4 | 29 | 7 | 9.1 | 3 | 16 | 3 | 5.6 | 1.9 |
Note. — Measured aromatic dust emission feature fluxes and uncertainties, measured with PAHFIT. Units are erg s-1 cm-2. Columnn headers give the central wavelength, in µm, of each feature. For features comprised of multiple components (like 7.7 µm), total flux and uncertainty were calculated using PAHFIT’s “main feature” function.
| src | f(2–8 keV) | f(0.5–8 keV) |
|---|---|---|
| erg s-1 cm-2 | erg s-1 cm-2 | |
| MS0451a | ||
| A851a | ||
| A1689a | ||
| A1689b | ||
| A1835a | ||
| A2218a | ||
| A2218b | ||
| A2218c | ||
| A2219a | ||
| A2261a | ||
| A2390a | ||
| A2390b | ||
| A2390c | ||
| AC114a | ||
| A2667a |
Note. — X-ray limits are the sky background plus any additional counts at the source position, as described in §3.5.
| lines | ratio | SINGS | Starburst |
|---|---|---|---|
| 7.7µm/6.2µm | 3.6 (1.3–4.8) | 3.9 | |
| 7.7µm/8.6µm | 5.7 (4.7–9.0) | 5.1 | |
| 6.2µm/8.6µm | 1.5 (1.2–3.0) | 1.3 |
| src | [Ne II] | [Ne III] | [Ne III]/[Ne II] | |||
|---|---|---|---|---|---|---|
| MS0451 | – | |||||
| A851 | ||||||
| A1689a | 0.93 | 0.26 | 2.0 | 0.43 | 2.15 | 0.76 |
| A1689b | ||||||
| A2218a | ||||||
| A2218b | 2.9 | 0.6 | 0.91 | 0.31 | 0.31 | 0.13 |
| A2218c | – | – | ||||
| A2219 | ||||||
| A2390a | ||||||
| A2390b | 2.2 | 0.57 | 0.90 | 0.69 | 0.41 | 0.33 |
| A2390c | 0.83 | 0.47 | – | |||
| AC114a | 1.6 | 0.29 | ||||
| A1835a | ||||||
| A2261a | ||||||
| A2667a | 2.5 | 0.49 | 0.92 | 0.51 | 0.37 | 0.22 |
| Tep1 | ||||||
| T1-bzk | ||||||
| Tep 2 | ||||||
| A370a |
Note. — Measured fine structure line fluxes, from PAHFIT, in units of erg s-1 cm-2. “ ” means the wavelength regime was not covered; “–” means the line was covered but not detected.
| src | X | weak aromatic | rising | opt |
|---|---|---|---|---|
| MS0451a | X | |||
| A851a | ||||
| A1689a | X | X | X | |
| A1689b | ||||
| A1835a | ||||
| A2218a | ||||
| A2218b | ||||
| A2218c | X | X | ||
| A2219a | ||||
| A2261a | X | X | X | |
| A2390a | X | X | X | |
| A2390b | X | |||
| A2390c | ||||
| AC114a | ||||
| A2667a | ||||
| Tep-1 | X | |||
| Tep-1-BzK | ||||
| Tep-2 | ||||
| A370a | X | X | X | X |
Note. — Columns: 1) source name 2) X-ray detection; 3) low aromatic flux contribution, as defined in §4.2; 4) mid-IR spectrum rises strongly toward the red; 5) AGN lines in optical spectrum.


![[Uncaptioned image]](/html/0711.1902/assets/x17.png)
Fig. 2 — continued.