Molecular Star Formation Rate Indicators in Galaxies
Abstract
We derive a physical model for the observed relations between star formation rate (SFR) and molecular line (CO and HCN) emission in galaxies, and show how these observed relations are reflective of the underlying star formation law. We do this by combining 3D non-LTE radiative transfer calculations with hydrodynamic simulations of isolated disk galaxies and galaxy mergers. We demonstrate that the observed SFR-molecular line relations are driven by the relationship between molecular line emission and gas density, and anchored by the index of the underlying Schmidt law controlling the SFR in the galaxy. Lines with low critical densities (e.g. CO J=1-0) are typically thermalized and trace the gas density faithfully. In these cases, the SFR will be related to line luminosity with an index similar to the Schmidt law index. Lines with high critical densities greater than the mean density of most of the emitting clouds in a galaxy (e.g. CO J=3-2, HCN J=1-0) will have only a small amount of thermalized gas, and consequently a superlinear relationship between molecular line luminosity (Lmol) and mean gas density (). This results in a SFR-line luminosity index less than the Schmidt index for high critical density tracers. One observational consequence of this is a significant redistribution of light from the small pockets of dense, thermalized gas to diffuse gas along the line of sight, and prodigious emission from subthermally excited gas. At the highest star formation rates, the SFR-Lmol slope tends to the Schmidt index, regardless of the molecular transition. The fundamental relation is the Kennicutt-Schmidt law, rather than the relation between SFR and molecular line luminosity. Our model for SFR-molecular line relations quantitatively reproduces the slopes of the observed SFR-CO (J=1-0), CO (J=3-2) and HCN (J=1-0) relations when a Schmidt law with index of 1.5 describes the SFR. We use these results to make imminently testable predictions for the SFR-molecular line relations of unobserved transitions.
Subject headings:
galaxies: ISM – galaxies: starburst – ISM: molecules – stars: formation – radio lines: galaxies – radio lines: ISM1. Introduction
The rate at which stars form in galaxies has historically been parameterized in terms of “laws” relating the star formation rate (SFR) to the density of available gas. Schmidt (1959) originally proposed a power-law form for the SFR such that SFR (hereafter, referred to as a Schmidt Law).
Observed SFR relations typically come in two flavors. The first, relating surface SFR density to surface gas density takes the form:
| (1) |
Observations of local galaxies have constrained the surface density SFR index, , to roughly =1.40.15 (e.g. Kennicutt, 1998a, b; Kennicutt et al., 2007, and references therein).
The second varietal of SFR indicators relates the SFR to the mass of molecular gas above a given volumetric density. For example, local galaxy surveys have shown a relation exists between the SFR and molecular gas such that the SFR (as traced by the infrared luminosity - hereafter LIR) is proportional to the 12CO (J=1-0) luminosity to the 1.4-1.6 power (Sanders et al., 1991; Sanders & Mirabel, 1996, and references therein). Because the J=1-0 transition of 12CO (hereafter CO) can be excited at relatively low densities (102-103 cm-3), and lies a modest 5 K above ground, it serves as a valuable tracer of total molecular H2 gas content down to relatively low densities. These observed relations have been broadly interpreted as an increasing star formation efficiency (SFE; the SFR divided by ) as a function of molecular gas mass (Gao & Solomon, 2004a, b; Sanders et al., 1991).
Recent observations of HCN have suggested that a perhaps more fundamental volumetric SFR relation for galaxies exists in terms of the dense molecular gas. Because HCN (J=1-0) has a relatively high critical density (105 cm-3) compared to that of CO (J=1-0), HCN is typically only thermalized in the dense cores of molecular clouds. Thus, in the limit that the bulk of HCN luminosity originates from thermalized gas, HCN serves as a good tracer of the dense molecular gas that is actively involved in the star formation process. This is in contrast to CO (J=1-0) which tends to emit from both dense cores as well as diffuse molecular filaments and cloud atmospheres.
Pioneering millimeter-wave observations by Gao & Solomon (2004a, b) uncovered a tight linear correlation between the infrared luminosity and HCN luminosity in a sample of local galaxies, ranging from quiescent spirals to luminous and ultraluminous infrared galaxies (LIRGs and ULIRGs, respectively). This relationship was found by Wu et al. (2005) to hold in individual star forming cores in the Milky Way as well. Observations of a roughly linear correlation between LIR and CO (J=3-2) emission (with critical density 104 cm-3) in a similar sample of galaxies further corroborated this result, and provided evidence against HCN-related chemistry driving the observed Gao & Solomon (2004a, b) relations (Narayanan et al., 2005; Yao et al., 2003).
Despite a plethora of observations, a consensus physical interpretation of the seemingly disparate LIR-HCN (J=1-0), LIR-CO (J=1-0) and LIR-CO (J=3-2) relations has yet to be borne out of the literature. Gao & Solomon (2004a, b) suggest that the linear relationship between LIR-HCN (J=1-0) reflects a scenario in which the SFR in galaxies is directly proportional to the amount of dense molecular gas, and similarly, a constant star formation efficiency in terms of dense molecular gas. In this picture, LIRGs and ULIRGs simply have a higher fraction of their molecular gas in a dense gas phase which is reflected in the linear LIR-HCN (J=1-0) slope111Throughout this paper we use the term slope interchangeably with ’index’ (as in the exponent in a given SFR relation - e.g. Equation 1). We do this as we are considering all relations in log-log space. and non-linear LIR-CO (J=1-0) slope. Narayanan et al. (2005) suggest a similar interpretation for their observed relation of LIR CO (J=3-2)0.92.
Wu et al. (2005) extended these interpretations to include the observed linear LIR-HCN (J=1-0) relation within the Galaxy. These observations suggested that dense molecular cores may represent a fundamental unit of star formation. In this case, the only difference between a ULIRG like Arp 220 and a Galactic star forming region is the number of individual star forming units present. This leads to a natural linear relationship between the SFR and amount of dense molecular gas.
From the theoretical side, Krumholz & Thompson (2007) made headway towards understanding the observed relations by providing a model which quantitatively reproduces the observed LIR-CO (J=1-0) and LIR-HCN (J=1-0) relations for star forming clouds. By combining 1D non-local thermodynamic equilibrium (LTE) radiative transfer calculations with models of giant molecular clouds (GMCs), these authors found that the relationship between the SFR and molecular line luminosity in star forming clouds depends on how the critical density of the molecule compares to the mean density of the observed source. Lines with critical densities which are typically below the mean density in a galaxy (e.g. CO J=1-0) probe the total molecular gas commonly from galaxy to galaxy. In this scenario, the SFR-molecular line exponent can be represented by the index that relates SFR to total volumetric gas density (i.e. the Schmidt index). Conversely, observations of molecules which typically trace densities well above the mean density of the galaxy (e.g. HCN J=1-0) trace similar conditions from galaxy to galaxy - i.e. the peaks in the density spectrum. In these cases, the molecular line luminosity rises faster than linearly with increasing gas density and the corresponding relation between SFR and line luminosity is near linear. A key direction forward beyond these models is understanding the effects of emitting GMCs on a galaxy-wide scale, with the potential effects of molecular line radiative transfer.
In this paper, we build on the body of observational and theoretical work by providing a physical model for the origin of the observed molecular SFR indicators on galaxy-wide scales, and relating them to observed relations. We additionally make model-distinguishing testable predictions for how the SFR in galaxies relates to as yet unobserved transitions in CO and HCN. We do this by combining 3D non-LTE molecular line radiative transfer codes (Narayanan et al., 2006a, b, 2007a, 2007b) with smoothed particle hydrodynamic (SPH) simulations of both isolated star forming galaxies and galaxy mergers. Our methodology includes the effects of both collisional and radiative molecular excitation and de-excitation, a multi-phase ISM, and star formation (Springel, Di Matteo & Hernquist, 2005). We additionally include a methodology for black hole growth and the winds associated with both black hole growth and star formation, though note that these processes play a minimal role on the SFR-Lmol relation in our simulations.
The paper is outlined as follows. In § 2 we describe our hydrodynamic and radiative transfer simulations. In § 3 we quantitatively describe the origin for the observed SFR-CO and SFR-HCN slopes and follow by making testable predictions for submillimeter-wave telescopes in § 4. In § 5 we compare our results to the body of observational work in this field, and in § 6, relate these simulations to other models and interpretations for molecular SFR indicators. In § 7, we conclude with a summary. Throughout the work we assume a CDM cosmology with =0.7, =0.7, =0.3.
2. Numerical Methods
2.1. Hydrodynamics
For this work we have modeled both isolated disk galaxies and major mergers. We do this as the Gao & Solomon (2004a, b) and Narayanan et al. (2005) samples include both disk galaxies as well as ongoing mergers. The merger snapshots are spaced equally temporally with a sampling of 5 Myr. We note, however, that the results in this paper are not dependent on our usage of any particular combination of disk galaxies or mergers.
The hydrodynamic simulations were conducted with a modified version of the publicly available -body/SPH code GADGET-2 (Springel, 2005). The prescriptions used to generate the galaxies, as well as the algorithms involved in simulating the physics of the multi-phase ISM, star formation, and black hole growth are described fully in in Springel, Di Matteo & Hernquist (2005) and Springel & Hernquist (2002, 2003). We refer the reader to these works for further details though summarize the aspects most relevant to this study here.
GADGET-2 accounts for radiative cooling of the gas (Davé et al., 1999; Katz et al., 1996), and a multi-phase ISM which is considered to consist of cold clouds embedded in a hot, pressure confining ISM (e.g. McKee & Ostriker, 1977). This is realized numerically through ’hybrid’ SPH particles in which cold clouds are allowed to grow through radiative cooling of the hot ISM, and conversely star formation can evaporate the cold medium into diffuse, hot gas. Pressure feedback from supernovae heating is treated via an effective equation of state (EOS) (see Figure 4 of Springel, Di Matteo & Hernquist, 2005). Here we utilize an EOS softening parameter of =0.25.
Star formation is constrained to fit the observed Kennicutt-Schmidt laws (Kennicutt, 1998a, b; Schmidt, 1959). In particular, star formation is assumed to be related to the gas density and local star formation time scale:
| (2) |
where quantifies the mass fraction of stars which are short-lived and effectively immediatley supernova, and is the timescale for star formation.
A Salpeter IMF with slope -1.35 and mass range 0.1-40 M☉ returns a value of 0.1. The parameter is assumed to be proportional to the local dynamical time scale.
| (3) |
Detailed studies by Cox et al. (2006c) and Springel & Hernquist (2003) have found that a proportionality constant of = 2.1 Gyr reproduces both the normalization and slope of the Kennicutt (1998a, b) observed SFR surface density relations over mergers with a wide variety of isolated galaxy and galaxy merger models. The dispersion in the modeled relations lay well within the observed dispersion. Similar results have been found by Mihos & Hernquist (1994a, b, 1996) and Springel (2000). Hence, we use this formulation for the star formation rate.
Black holes are optionally included in our simulations which accrete via a Bondi-Lyttleton-Hoyle parameterization with a fixed maximum rate corresponding to the Eddington limit. The black hole radiates such that its bolometric luminosity is set by the accretion rate with with accretion efficiency =0.1. We further assume that 5% of this energy couples isotropically to the surrounding ISM as feedback energy (Di Matteo et al., 2005; Springel, Di Matteo & Hernquist, 2005), a number chosen to match the normalization of the locally observed - relation. We have run identical simulations both with and without black holes for this work, and found that the inclusion of black holes makes little difference on the final result. We note, however, that we focus our molecular line comparisons to the SFR, and not LIR (which could, in principle, have a contribution from buried AGNs at the highest luminosities) as a complete treatment of modeling the infrared SED (e.g. Chakrabarti et al., 2007a, b; Jonsson, 2006; Li et al., 2007b) is outside the scope of this study.
We consider both isolated disk galaxies with varying gas fractions and masses, as well as two equal mass binary mergers. We utilized 15 isolated galaxies exploring a parameter space with gas fractions=[0.2, 0.4, 0.8] and virial velocities=[115, 160, 225, 320, 500 km s-1]. All disk galaxies (including the progenitors for the merger simulations) were initialized with a Hernquist (1990) dark matter profile, concentration index =9, and spin parameter =0.033. For all galaxies we utilize 120,000 dark matter particles, and 80,000 total disk particles. The softening lengths were 100 pc for baryons and 200 pc for dark matter.
For the mergers, the progenitor galaxies were identical to the disk galaxies described here, with =160 km s-1, and 40% gas fraction. For reference, the mergers are simulations ’no-winds’ and ’BH’ as described in Narayanan et al. (2007b). The first merger snapshots considered are when the molecular disks of the progenitors are overlapped as the galaxies approach final coalescence. We utilize multiple snapshots throughout the evolution of the merger simulations beyond this point to represent observed merging pairs caught in various stages of evolution (e.g. close pairs such as the Antennae to more evolved mergers such as Arp 220 and NGC 6240). All merger snapshots are during the period of highest star formation activity, when the galaxy can be considered a LIRG/ULIRG (model IR luminosities for these merger simulations can be found in Chakrabarti et al. (2007a)). Sample CO images of the merger simulations employed here, as well as some of the model disk galaxies can be found in Narayanan et al. (2007b).
It is an important point to note that no particular choice or combination of models affects the presented results. While some of the disk galaxies used may nominally have larger circular velocities or gas fractions than galaxies observed in the local Universe, because the results are general, not including them does not change our results or interpretation. We include a wide range of model galaxies to increase the number statistics and dynamic range of our simulations. The generality of our results will be shown more explicitly in § 3 and § 4.
2.2. Non-LTE Radiative Transfer
The propagation of a line through a medium with lower density than the line’s critical density requires a full non-LTE treatment. Specifically, in this regime, both collisions and radiative processes contribute to the excitation and de-excitation of molecules. This formalism for molecular line transfer has long been applied to interpretations of galaxy observations via large velocity gradient codes (e.g. Goldreich & Kwan, 1974), though has only recently been incorporated in full 3 dimensions in galaxy-wide models (Greve & Sommer-Larsen, 2006; Narayanan et al., 2006a, 2007a, 2007b; Wada & Tomisaka, 2005; Yamada et al., 2007). We employ the radiative transfer methodology of Narayanan et al. (2007b), and refer the reader to that work for full details. Here, we briefly summarize.
The radiative transfer is performed in two phases. First, the molecular level populations (and consequently source functions) are explicitly calculated using the 3D non-LTE code, Turtlebeach (Narayanan et al., 2006a, 2007b). In this, a solution grid to the level populations is guessed at, and model photons are emitted isotropically in a Monte Carlo manner. The level populations are updated by assuming statistical equilibrium, and balancing radiative and collisional excitations, de-excitation and stimulated emission (Bernes, 1979). A new series of model photons is emitted and the process is repeated until the level populations are converged.
Once the level populations and source functions are known, the model intensity can be found by integrating the equation of radiative transfer along various lines of sight. Formally:
| (4) |
where is the frequency-dependent intensity, is the source function, is the physical depth along the line of sight, and is the optical depth.
The SPH outputs are smoothed onto a grid with 160 pc spatial resolution for the radiative transfer. In order to more accurately describe the strongly density-dependent collisional excitation and de-excitation rates, we model the gas in grid cells to be bound in a mass spectrum of GMCs constrained by observations of Milky Way clouds (Blitz et al., 2006). The GMCs are modeled as spheres with power-law density gradients, and radii given by the Galactic GMC mass-radius relation (e.g. Rosolowsky, 2005, 2007; Solomon et al., 1987). These GMCs are placed randomly in the grid cells (which we refer to as “cells” hereafter). Of the SPH simulations utilized here in particular, the maximum volume-averaged H2 density seen in a cell was of order 1000 cm-3, though higher maximum densities are of course realized in the subgrid GMCs, dependent on the mass of the GMC (typically central core densities reached 106-107 cm-3 in the nuclear regions of star forming galaxies in our simulations; Narayanan et al., 2007b). Because the sub-grid GMCs are posited on the grid in post-processing, the SFR (Equation 2) calculated during the hydrodynamic simulations utilizes the volume-averaged densities achieved at the hydrodynamic resolution (which is of order 100 pc). More details concerning the subgrid formalism for including GMCs on a galaxy-wide scale, and resolution tests may be found in (Narayanan et al., 2007b).
Observational evidence suggests a range of power-law indices for GMCs, ranging from =1-2 (Andre et al., 1996; Fuller & Myers, 1992; Walker, Adams & Lada, 1990). Tests utilizing a number of cloud density power-law indices within this range (in which the total mass of the cell was conserved, and thus the central density in the clouds allowed to vary) show that the results in this work are not sensitive to this parameter choice. Similarly, in the study of Blitz et al. (2006) and Rosolowsky (2007), GMC mass spectrum indices were found to range from -1.4 to -2.8. Again, tests of mass spectrum indices showed that the results of this paper are not sensitive to parameter choices within the range of observational constraints. We nominally employ indices of =1.5 and =-1.8 for the cloud density and GMC mass spectrum power-laws (Rosolowsky, 2007). This methodology allows us to faithfully capture the emission processes from both dense molecular cores and more diffuse GMC envelopes (Narayanan et al., 2007b).
We have benchmarked our radiative transfer codes against published non-LTE radiative transfer tests (van Zadelhoff et al., 2002), and present the results for these tests in Narayanan et al. (2006b). Our methodology for applying 3D non-LTE molecular line radiative transfer has shown success in reproducing characteristic observed CO line widths, morphologies, excitation conditions and intensities in isolated disk galaxies, local ULIRGs and quasars from 2-6 (Narayanan et al., 2006a, 2007a, 2007b).
The molecular gas mass fraction is assumed to be half, as motivated by local volume surveys (e.g. Keres, Yun & Young, 2003), and the molecular abundances set uniformly at Galactic values (Lee, Bettens & Herbst, 1996). In this work, typically 1107 model photons were emitted in the non-LTE calculations per iteration, and we considered transitions across 11 molecular levels at a time. The mass spectrum of GMCs had a lower mass cutoff of 110 and an upper mass cutoff of 110.. The collisional rate coefficients were taken from the Leiden Atomic and Molecular Database (Schöier et al., 2005).
3. Origin of Observed SFR-CO and SFR-HCN Slopes
3.1. General Argument


In Figure 1 we plot the SFR-CO relations and SFR-HCN (J=1-0) relation as derived from our models of isolated disk galaxies and mergers with best fitting slopes overlaid. Here, we show the emission from a sample of model galaxies as a whole (e.g. simulated unresolved observations of galaxies). We plot the line intensities, though note that they are proportional to molecular line luminosity (, Solomon & Vanden Bout (2005)), the standard quantity reported in the observational literature222(4 ln 2)(1+)-3 where is the main beam angular size, is the molecular line intensity, is the luminosity distance, and is the redshift (Gao & Solomon, 2004a).. Included in the plot are a random sampling of 35 of the 15 disk galaxies and 80 merger snapshots in our parent sample. The points are all different simulated galaxies, and not simply multiple viewing angles of the same galaxy. We first note the general agreement of the best fit slopes and dispersion with observed relations by Gao & Solomon (2004a, b), Narayanan et al. (2005), and Sanders et al. (1991). The dispersion in Lmol at a fixed SFR arises owing to variance in the mean density of the emitting gas in galaxies at a given SFR. We will discuss the physical reasoning behind the slopes shortly. Second, we note that we have utilized a randomly drawn sample of our simulated galaxies to demonstrate the generality of our results. From this, we see that any given combination of model disk galaxies and/or merger snapshots give roughly the same fits. We have quoted as “error” values the 1 dispersion in 100 random draws of 35 model snapshots. The generality of these results occurs because the origin of the SFR-molecular line relations arise from the nature of the molecular emission from the individual galaxies themselves.
To see this, consider a galaxy which is forming stars at rate:
| (5) |
where is the mean molecular gas mass density. The relationship between the SFR and the luminosity of a molecular line from a cell of clouds
| (6) |
is dependent on the relationship between the molecular line luminosity and the mean gas density in a cell of clouds:
| (7) |
where =N/. Therefore, for a given Schmidt law index, , the root issue in determining how the SFR relates to molecular line luminosity is understanding how the molecular line traces molecular gas of different densities ().
The global relationship between molecular line luminosity and mean gas density traced () is driven by how the critical density of the molecular line compares with the density of the bulk of the clouds across the galaxy. In short, lines which have critical density below the mean density of most of the emitting gas cells will be thermalized and rise linearly with increasing cloud density. These lines will consequently have SFR-line luminosity relations () similar to the Schmidt index controlling the SFR.
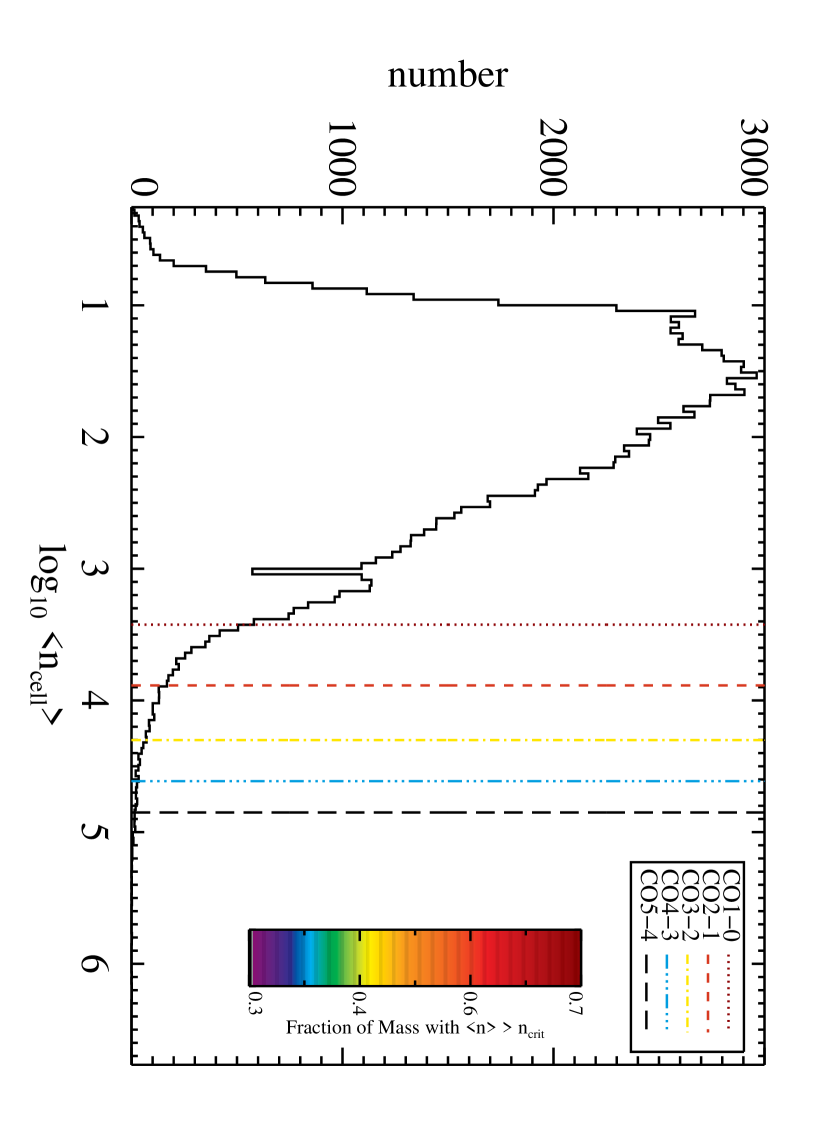
Lines which have critical density well above the mean density of most of the emitting gas cells will be thermalized in only a small fraction of the gas. To see this, in Figure 2, we plot the distribution of mean cell densities for a fiducial disk galaxy (with 40% gas fraction and 160 km s-1 circular velocity; this will be a fiducial disk galaxy which we center the remainder of the discussion around as a reference point, though the results are general)333In order to account for the destruction of molecules in photodissociation regions (e.g. Hollenbach & Tielens, 1999), we do not consider emission from regions with column density 1.51021 cm-2. This typically corresponds to cells with mean cloud density 50 cm-3 in our simulations.. We additionally plot the critical densities of a sample of CO lines overlaid as an indicator of the relative gas fractions above given critical densities. In the case of high critical density tracers such as e.g. CO (J=3-2), a small fraction of the gas is thermalized. As the mean density increases, the fraction of thermalized gas (and consequently photon production) increases superlinearly, driving an e.g. SFR-CO (J=3-2) relation with index less than that of the Schmidt index. This is similar to the physical mechanism driving the SFR-Lmol relation in star forming GMCs by Krumholz & Thompson (2007).
An important question to understand is, how does this global model for the observed SFR-Lmol relations (also considered by Krumholz & Thompson, 2007) manifest itself when considering the actual transfer of molecular line photons in physical models of isolated galaxies and galaxy mergers? In particular, high critical density photons from the dense, thermalized nucleus may be reabsorbed by diffuse gas along the line of sight. How, then, considering this redistribution, is the observed SFR-Lmol relation realized? In short, in galaxies where , large amounts of diffuse gas along the line of sight are subthermally (radiatively) excited owing to line trapping. Emission from subthermally excited gas can be thought of as a scattering process in that the high critical density photon originates in dense, thermalized molecular gas, and is redistributed to more diffuse gas. Subthermal emission from radiatively excited cells tends to have a superlinear Lmol- relation as the relatively diffuse gas owes its luminosity to molecules who have been pumped by radiation from denser regions. As such, the radiation is indicative of denser, thermalized regions where the photons were originally created, but the diffuse gas along the line of sight reduces the sightline-averaged mean density. In these cases, the SFR-line luminosity relation () has an index less than that of the underlying Schmidt law for the galaxy. There are details, of course, specific to the relationship between CO (J=1-0), CO (J=3-2) and HCN (J=1-0) luminosities and gas density traced which require a more in depth analysis, but these underlying themes are robust. This is inherently an alternative but equivalent way of viewing the previous point. The net number of high critical density photons depends on the quantity of dense, thermalized gas. The bulk of the gas along the line of sight (which is responsible for the line trapping) is diffuse, resulting in a superlinear Lmol- relation along the line of sight.
We devote the remainder of this section to examining the driving mechanisms behind the relationship between line luminosity and mean gas density () in greater detail, and utilize these to formulate a general model for observed SFR-molecular line luminosity relations in galaxies. We will utilize the aforementioned fiducial disk galaxy as a reference point. We will couch the discussion (at least for the high critical density tracers - e.g. HCN J=1-0 and CO J=3-2) in terms of both the global relationship between and , as well as the redistribution of photons from thermalized gas to diffuse, subthermally excited cells. The reason we do this is the following. The SFR-Lmol relation in galaxies is globally set by the number of high critical density photons produced as a function of the mean density of the emitting clouds along the line of sight (e.g. the relationship between and ; Figure 2). While these high critical density photons are originally produced in the small number of thermalized cores in galaxies, this does not necessarily reflect the final emitting surface in the galaxy. The photons are redistributed from dense cores to being absorbed and re-emitted by diffuse gas along the line of sight. The details of how the SFR-Lmol relation is driven in a realistic model for a galaxy are subtle, and require more analysis than the global arguments presented thusfar. Moreover, the large quantities of subthermally excited gas is a direct observational consequence of this physical model for the observed SFR-line luminosity relations. For these reasons, we continue forward framing the understanding of the observed relations between SFR and line luminosity in terms of both global properties as well as the subthermally excited gas along the line of sight. That said, the details outlined in the remainder of this section are just that. The remainder of the predictions presented in this paper are not dependent on the finer points regarding the excitation patterns in galaxies.
3.2. Detailed Understanding of an Individual Galaxy
We first note that a significant portion of the intrinsic luminosity in the galaxy escapes. While the optical depths can become large locally, velocity gradients across the galaxy serve to shift native absorption profiles out of resonance with the emission line on larger scales. Specifically, we see 60% of the emission across most CO and HCN transitions escape the galaxy. The gas cells contributing to emission that escapes are of a fixed size, and distributed across the galaxy. These cells exhibit a wide range of mean cloud densities. We therefore focus on the properties of individual gas cells in our simulations (of all masses and densities) in order to build an understanding of how their summed properties drive the global line luminosities-gas density relation, and the consequent SFR-molecular line luminosity relation.
The observed SFR-molecular line relations (Gao & Solomon, 2004a, b; Narayanan et al., 2005) are representative of three regimes: one in which the mean density of the bulk of the emitting clouds is higher than the line’s critical density; one in which the mean density is lower than the line’s critical density; and one in which the mean density is lower than the line’s critical density and the line considered is a ground-state transition. We explore these three cases here with respect to our fiducial disk galaxy (though note again that the results are general).
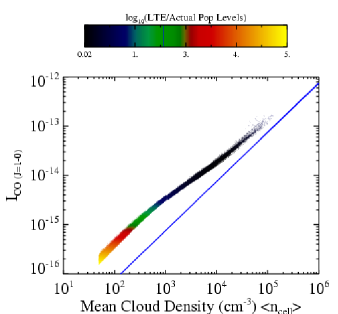
In Figure 3, we show empirically how the line of sight velocity-integrated intensity from CO (J=1-0), CO (J=3-2) and HCN (J=1-0) relate to the sightline-averaged mean density along 502 sightlines for the fiducial disk galaxy444Note that this is now plotting the Lmol- relation for individual sightlines for a single disk galaxy (with implied spatial resolution equal to that of the simulation of 160 pc). This is in contrast to Figure 1 which plotted simulated unresolved observations of galaxies as a whole.. The solid line in each case shows linearity, with arbitrary normalization. In Figure 4, we plot the line luminosity versus mean density on a cell by cell basis for the CO (J=1-0), (J=3-2) and HCN (J=1-0) transitions from our fiducial disk galaxy. We remind the reader that a ’cell’ is a grid cell in our fiducial galaxy which contains potentially numerous GMCs whose effects are simulated in a subgrid manner (Narayanan et al., 2007b). We will refer to these two figures throughout the forthcoming discussion.


3.2.1
We first consider the regime in which the mean density of the bulk of the emitting clouds is typically higher than the line’s critical density. We see empirically from the left panel of Figure 3 that the CO (J=1-0) luminosity traces sightlines of increasing mean density linearly in our fiducial galaxy (). Utilizing equations 5-7, this translates into a globally observed relation in a sample of galaxies in which the SFR relates to Lmol with an index similar to the underlying Schmidt index (here, =1.5). What causes this linear relation between Lmol and ?
At the critical density, the line is approaching thermalization and, in the limit that constant molecular abundances apply (with respect to H2), the clouds are typically optically thick. In this scenario, the emission arises primarily from the outer (lower column density) regions of clouds, and serves as a measure of the number of emitting clouds in a given cell. While groups of clouds are locally optically thick, on a galaxy-wide scale they are optically thin. Thus, the velocity dispersion of the bulk of clouds along a given line of sight has the effect of spreading the molecular line emission out in frequency space, permitting physically overlapping clouds to be counted. Because the mean cloud density increases with number of clouds in a given cell, in the optically thick limit, a roughly linear relation between molecular line emission and mean cloud density is natural.
In Figure 4 (left panel), we illustrate this effect by showing the CO (J=1-0) intensity as a function of mean cell density in our fiducial galaxy. The points are individual grid cells containing (potentially) numerous GMCs. Overlaid in color is the level of thermalization. The bulk of the CO (J=1-0) emission comes from cells that are either in LTE or nearly thermalized. We therefore arrive at the conclusion that transitions that have critical density well below the mean critical density of most emitting clouds will be roughly thermalized, and the SFR-line index will be similar to the underlying Schmidt-law index. When an underlying Schmidt index of =1.5 is in place, the SFR-Lmol relation matches observations well. This is similar to the explanation posited by Krumholz & Thompson (2007) for their models of GMCs.
).
3.2.2

If the critical density of the transition is toward the high density tail of the gas density distribution function, as one considers galaxies of increasing mean density, the luminosity from that molecular transition will increase superlinearly. This owes to an increase in thermalized gas both from an increased quantity of gas in the galaxy, as well as an increased fraction of gas above the critical density. This effect is seen in simulated global unresolved observations of galaxies (which show effectively a single, unresolved sightline in a galaxy) as well as simulated higher resolution observations. We illustrate this intuitive argument in the middle and right panels of Figure 3 where we show 502 observed sightlines through our fiducial disk galaxy.
The superlinear Lmol- relation in high critical density tracers drives a relation between SFR and Lmol which has index less than the Schmidt index (Equations 5-7). This is similar to the interpretation advocated by Krumholz & Thompson (2007) in their models of the SFR-Lmol relation in GMCs.
As discussed before, this physical model drives the global SFR-Lmol relation in our model galaxies. That said, the connection between this and how the Lmol- relation is realized on a cell by cell basis when considering physical models of galaxies, and the effects of radiative transfer and light redistribution is more subtle. In the remainder of this section, we examine the two case examples of of CO (J=3-2) and HCN (J=1-0) in detail.
Non Ground-State Transition
We first consider the case in which the gas density is in large part below the critical density of the emission line (which is not a ground state transition - e.g. CO J=3-2) on a cell by cell basis for our fiducial disk galaxy. In the lowest density cells, high critical density tracers such as CO (J=3-2) are subthermally excited. Unlike the case where , the emission from the lower mean density cells does not drop monotonically with decreasing mean cloud density. Rather, the molecular excitation (and consequent emission) is supported by radiative excitation from neighboring cells with higher mean density.
The cells with the lowest mean density show a relatively constant flux level which is higher than would nominally be allowed if collisions alone drove the molecular excitation (Figure 4). To see this, consider the dependence of the cell’s intensity on the molecular level populations:
| (8) |
where and are the upper and lower state level populations, and , and are the Einstein coefficients for spontaneous emission, absorption, and stimulated emission, respectively. In subthermally populated levels, , and consequently . When both and are subthermal, and increase in lock step superlinearly with increasing mean cloud density. This owes to a combination of the effects of collisional excitations (which increases linearly with density) and the additional contribution of radiative excitations. Because and both increase monotonically with gas density, there will be little change in the intensity as a function of increasing gas density. Consequently, the value of the intensity is roughly constant at ()/() where and are inflated (above the effects of collisional excitation alone) by line trapping (Figure 4).
At higher mean cloud densities, when the collisions begin to contribute significantly to the excitation processes for the state, continues to increase superlinearly with increasing density whereas increases only linearly. Thus, increases with respect to with increasing mean cloud density, and the line intensity begins to rise with cloud density (Equation 8). Emission in these cells is coming both from subthermally excited gas, and the small fraction of thermalized gas (in cloud cores) in these relatively low mean density cells. At the highest mean cloud densities, the and states are both thermally populated, and the emission rises linearly with increasing mean density as in § 3.2.1. In Figure 5, we plot an illustrative example of how the level populations evolve with increasing mean cloud density by showing the CO level population distributions for three cells with different mean densities in our fiducial disk galaxy. These rates of level population increase with increasing mean gas density translates to the relationship between and gas density for the CO (J=3-2) transition as shown in Figure 4 (middle panel).
At first glance, Figure 4 suggests that the CO (J=3-2) intensity traces the gas density () sublinearly, which is contradictory to what we would expect given the nearly linear SFR-CO (J=3-2) index (; Equations 5-7). However, the important quantity to consider is the total integrated intensity summed along sightlines through the galaxy (Figure 3). The gas in the low density subthermally populated regions along the line of sight is excited by emission from warmer, higher density gas, and thus has a characteristic intensity reflective of a higher brightness temperature than the meager densities in these gas cells would normally allow for via collisional excitation alone. Conversely, emission from higher density gas is more representative of the dense regions the photons originate from. If one could see directly into the thermalized nucleus, the CO (J=3-2) emission would be characteristic of the density of gas traced, and the consequent -gas density relation would be linear (e.g. § 3.2.1). However, line of sight observations of the galaxy contain a contribution both from the dense nucleus, and the subthermal cells along the LOS which have a rather high Lmol/ ratio. The contribution to the emission from lower mean density regimes along the line of sight results in a total superlinear relation between intensity and line of sight mean gas density ().
We show this more quantitatively in Figure 6, where we plot the relative light (line flux) to density ratios versus the mean cell density along a single sightline peering through the nucleus of our sample disk galaxy. We plot the light to density ratios for the CO (J=1-0) and CO (J=3-2) transitions, and normalize the ratios at the highest density cell. In Figure 6, it is evident that the lower density gas along the line of sight toward the nucleus proportionally emits substantially more CO (J=3-2) intensity as a function of cell density than than the thermalized gas 555It is important to note that there is no “extra” photon production from subthermally excited gas. The emission from this diffuse gas is simply redistributed light which largely originated in thermalized cores. It is the increased relative light to density ratio (Figure 6) in this subthermally excited gas along the line of sight that causes the superlinear index (Equation 7).. This translates to the CO (J=3-2) intensity tracing the sightline-integrated mean gas density superlinearly (Figure 3).

Ground State Transition
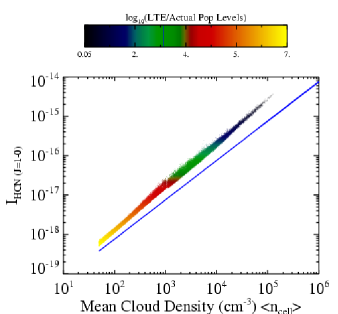
We now briefly turn our attention toward the SFR-HCN (J=1-0) relation as it represents an instructive combination of the phenomena driving the SFR-CO (J=1-0) and SFR-CO (J=3-2) relations. At its root, the characteristic emission pattern from HCN (J=1-0) falls into a similar category as that of CO (J=3-2). That is to say, it is dominated by subthermally excited gas, and the emission from these cells traces the gas density in a superlinear manner (e.g. Figure 6, which was shown for CO J=3-2, but the results are applicable to HCN J=1-0 as well). Indeed, the result is expected as the critical densities from the two lines are only an order of magnitude different, and both are substantially higher than the mean density of most clouds in our model galaxies. The difference between HCN (J=1-0) emission and the CO (J=3-2) emission is that there is no flat portion of the line intensity-gas density curve as it is a ground state transition (Figure 4, right panel). The superlinear emission continues monotonically with cell density across the full range of densities in the example galaxy owing to nearly constant J=0 level populations and rising J=1 level populations (Equation 8). This was explicitly seen in Figure 5 for the case of CO (though qualitatively the case of HCN is similar). The intensity rises superlinearly with increasing gas density because the excitation processes to the J=1 rotational state have a large contribution from the molecular line radiation field. The source of excitations from line trapping increases superlinearly because the source of radiation for the excitation - dense, thermalized cores - increases superlinearly with . This superlinear relation between Lmol and in the emitting gas cells results in a nearly linear relationship between the SFR and HCN (J=1-0) luminosity in our models, consistent with the well established observational results of Gao & Solomon (2004a, b).
We therefore arrive at the following conclusions driving observed molecular line-SFR relations:
-
•
For lines with critical densities well below the mean density of the clouds in the galaxy, the emission line will trace the total molecular content of the galaxy. In these cases, we find an SFR-molecular line luminosity index equivalent to the Schmidt-law index. This results in an SFR-CO (J=1-0) slope of 1.5 when the SFR is constrained by SFR. Observationally, the SFR-CO (J=1-0) index is found to lie between 1.4-1.6.
-
•
For lines with high critical densities, a superlinear relation exists in Lmol and in the gas owing to thermalized gas lying only on the high density tail of the density distribution. The light from the thermalized cores is redistributed such that the final surface of emission is diffuse, subthermally excited gas along the line of sight. When the line is a ground state transition (e.g. HCN J=1-0), the intensity from gas cells rises monotonically with mean cloud density, though superlinearly owing to heavy contribution to the excitation from line trapping. When the line is a transition above the ground state (e.g. CO J=3-2), emission from the subthermally excited cells is roughly constant with increasing mean gas density until the level populations involved in the transition begin to approach LTE, at which point the intensity is roughly linear with mean cloud density. In either case, for high critical density lines, a superlinear increase in thermalized gas and high critical density photon production with mean gas density results in an SFR-line luminosity index () lower than the Schmidt-law index. In the example of CO (J=3-2) and HCN (J=1-0) presented here, this results in SFR-line luminosity indices of 1, consistent with the measurements of Narayanan et al. (2005) and Gao & Solomon (2004a, b).
3.3. Implications of Results
The results presented thus far are a natural solution to the observed SFR-CO and SFR-HCN relations. Without any special tuning of parameters, the same simulations are seen to additionally reproduce characteristic CO emission line morphologies, intensities, excitation conditions and effective radii of local disk galaxies and mergers (Narayanan et al., 2006a, 2007b), as well as quasars at 6 (Narayanan et al., 2007a). More broadly, the same galaxy evolution simulations have shown successes in reproducing a large body of characteristic observable features of starburst galaxies, ULIRGs and quasars from z=0-6 (§ 2.1, and references therein). In this sense, the modeled reproduction of the observed SFR-CO and SFR-HCN relations are a natural result of a series of simulations which have reproduced many observed phenomena.
Second, we re-emphasize that the relationship between SFR and CO/HCN emission is built in to the excitation mechanisms of both diffuse and dense gas in galaxies, though should be taken in an ensemble sense. Because the average physical conditions of the disk galaxies and merger snapshots in our simulations result in molecular line-gas density relations compatible with the observed SFR-molecular line relations, no particular combination of disk galaxies and/or merger snapshots was necessary for the reproduction of observed relations in Figure 1.
A natural question is whether or not any given SFR-molecular luminosity relation holds particular significance as a physical SFR “law” relating the SFR to a property of the gas itself. The results in this section show that all SFR-molecular line relations are reflective of the underlying Schmidt law relating the star formation rate to gas density. That is, our models suggest that the observed linear SFR-molecular line luminosity relations (for high critical density tracers) do not represent a fundamental indicator of the SFR, but are rather simply indicative of the underlying Schmidt law. Because we assumed that the SFR, the resultant SFR-molecular line relations from the models matched the observed relations rather well (Equations 5-7). To some degree, these models suggest that the observed SFR-CO and SFR-HCN relations reflect a physical SFR law similar to the ones assumed for this model (with index 1.5). Moreover, simulations have shown that this choice of an SFR law reproduces the observed surface density Kennicutt (1998a, b) SFR laws well (Cox et al., 2006c; Springel, 2000). In this sense, the predicted molecular SFR relations in this section are simply reflective of the existing surface density SFR laws, as well as volumetric gas density SFR laws.
Finally, we note that a general consequence of our models is that at the highest SFRs, the SFR-Lmol slope will naturally turn toward the underlying Schmidt index. This is because at these SFRs, the mean density of the galaxies is typically high enough that the mean density is of order the critical density of the molecular transition. In these cases, the molecular line emission will be essentially counting clouds in a manner similar to the CO (J=1-0) emission described earlier, and an SFR-Lmol index of 1.5 will result. This is similar to the interpretation advocated by Krumholz & Thompson (2007).
4. Testable Predictions
In Figure 1, we showed for a random drawing of our sample of 100 disk galaxies and merger snapshots that our model results displayed consistent SFR-CO and SFR-HCN indices with observations of local galaxies (Gao & Solomon, 2004a, b; Narayanan et al., 2005; Yao et al., 2003). We can further extend these model results to make testable predictions for the indices of unobserved SFR-CO and SFR-HCN transitions.
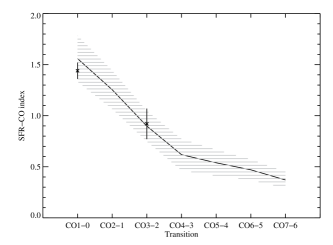
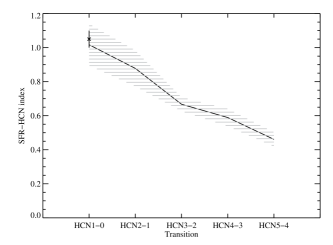
We plot the predicted indices for the range of readily observable SFR-CO and SFR-HCN transitions in Figure 7. To derive these results, we randomly drew 35 of our 100 galaxies and took the best fitting slope between the SFR and molecular line luminosity from the entire galaxy. Because we are modeling unresolved observations of entire galaxies in our simulation sample, these predictions can be directly applied to observations. We did this for each transition 100 times, and in Figure 7 denote the mean of these results with the solid line, and the standard deviation in the dispersion with the hatched region. We additionally plot the observed data from the surveys of Gao & Solomon (2004b) and Narayanan et al. (2005) with associated error bars. The model results are quite consistent with the three observational data points. Moreover, the dispersion in the prediction is consistent with the resultant dispersion in slopes of a random sampling of a comparable fraction of galaxies in the Gao & Solomon (2004a, b) sample.
The slope of the SFR-CO (J=1-0) relation roughly follows the assumed Schmidt law as the CO (J=1-0) serves as an accurate tracer of the total molecular gas. Higher lying transitions become shallower as the relationship between the transition and the gas density (globally) becomes superlinear. At the highest transitions (e.g. CO 4), the decrease in the SFR-LCO slope begins to flatten. Broadly, this owes to a relative plateau in the critical densities as a function of increasing rotational transition.
The SFR-Lmol index for tracers with critical density higher than HCN (J=1-0) or CO (J=3-2) is directly predicted to be sublinear. This owes to the increasingly small fraction of gas in galaxies which is thermalized in these transitions. As the mean density of galaxies increases, the amount of gas thermalized in these transitions (in the most extreme peaks of the density distribution; e.g. Figure 2) increases superlinearly. Alternatively said, the fraction of emission dominated by subthermal emission in galaxies increases as the critical density of the tracer increases. Consequently, the Lmol- transition becomes increasingly superlinear.
The predictions seen in Figure 7 may serve as model-distinguishing observational tests. That is, the standard interpretation of the linear relationship seen between LIR and HCN (J=1-0) luminosity and CO (J=3-2) luminosity is that the molecular line emission traces dense gas more physically involved in the star formation process (e.g. 104-5cm-3). In that picture, observations of HCN and CO transitions with even higher critical densities ought to similarly show a linear relationship between LIR and molecular line luminosity as they continue to probe dense star forming cores (e.g. Gao & Solomon, 2004a, b). In contrast, our models suggest that the observed relations between SFR and molecular line luminosity are driven by a superlinear increase in Lmol with increasing , and will consequently have a sublinear SFR-Lmolslope for higher critical density lines than CO (J=3-2) or HCN (J=1-0) (Figure 7). Observations of alternative CO lines (e.g. CO J=2-1) or higher lying CO or HCN transitions in galaxies will provide a direct test of these models.
We note that while the models of Krumholz & Thompson (2007) do not explicitly predict the SFR-Lmol index for transitions beyond the ground state, because the physical reasoning for their derived SFR-Lmol relation for GMCs is similar to that predicted here, in principle similar results can be expected. We discuss this work in the context of their models more in § 6.
The dependence of the SFR-Lmol relations on the relationship between and lends two other natural tests of the models to be borne out. First, galaxies with the highest SFRs typically have the largest mean densities. For these galaxies, because , an SFR-Lmol index equal to the underlying Schmidt index (here, 1.5) is to be expected. That is, the slope of the SFR-Lmol relation should steepen for high critical density tracers at the highest SFRs. We remind the reader that the SFR-Lmol relations typically use LIR as a proxy for the SFR, which may contain contamination from embedded AGNs (which we have not included in these models). Thus, salient point of these models, as well as those of Krumholz & Thompson (2007) regarding these high luminosity points is that regardless of the potential contribution of embedded AGNs these dense, star forming systems will systematically lie above the linear relation between LIR and HCN (J=1-0)/CO (J=3-2) seen for lower luminosity (LIR 1012L☉) systems.
Second, regions within galaxies with higher mean critical density will have a different SFR-Lmol index than global measurements. Lines of sight which probe the dense nucleus of an e.g. ULIRG may have densities approaching that of the critical density of high critical density tracers. In these cases, a superlinear SFR-Lmol relation may be found.
5. Comparison with Observations
The model results presented here quantitatively reproduce the observed SFR-CO (J=1-0), SFR-CO (J=3-2), and SFR-HCN (J=1-0) indices for local galaxies. These are found to be reflective of the ensemble-averaged excitation conditions in these galaxies, and the manner in which the molecular line luminosity is related to mean cloud density.
Surveys of Galactic GMC cores have shown that high dipole moment molecules such as CS and HCN serve as an accurate tracer of dense gas mass (e.g. Shirley et al., 2003; Wu et al., 2005). However, the interpretation from extragalactic sources is mixed. Varying results have come from the observational literature regarding the origin of traditional tracers of dense gas (such as HCN) from extragalactic surveys. For example, Greve et al. (2006) find the HCN emission in some systems to arise from dense, thermalized cores, whereas Papadopoulos (2007) cite Arp 193 as an example in which the bulk of the HCN emission arises from subthermally populated gas. More broadly, constraints on high lying transitions in CO, HCO+ and HCN from the observational samples of Greve et al. (2006), Narayanan et al. (2005), Papadopoulos (2007), Papadopoulos, Isaak & van der Werf (2007) and Yao et al. (2003) among others evidence a wide range of molecular excitation conditions. In this regard, the models presented here are consistent with these observational results.
Sensitive observations of high redshift galaxies are beginning to measure sources in the early Universe in terms of their place on the SFR-molecular line relation as well (e.g Gao et al., 2007; Greve et al., 2005; Hainline et al., 2006; Riechers et al., 2006; Wagg et al., 2005, 2007; Weiß et al., 2007, for an extensive review, see Solomon & Vanden Bout 2005 and references therein). Owing to its relatively high abundance, most detections at high- have been in CO (with a smattering of HCN, HCO+ and other molecules), and thus we focus our comparisons with high- galaxies on CO. A summary of a nearly-current sample may be found in Figure 5 of Riechers et al. (2006).
In general, the interpretation of SFR-molecular line relations at high redshift are muddied by two factors. First, the increasing fraction of AGN in high redshift infrared luminous sources almost certainly contaminates the LIR from the observed galaxies and quasars, thus causing a potentially significant overestimate in the SFR. Second, as the objects span a large range in redshifts, the rest frame transitions observed are typically quite diverse, and thus not always probing the same phase of gas. The cumulative LIR-CO luminosity (over numerous transitions) index for sources from z=06 as reported by Riechers et al. (2006) is 1.4, similar to the local SFR-CO (J=1-0) relation. Certainly, at lower luminosities (LIR1012L☉), the molecular line data is dominated by CO (J=1-0) observations of local galaxies. The relationship between LIR and CO luminosity for these sources then is consistent with the results of our simulations if the LIR in the lower luminosity sources is dominated by dust heating by O and B stars. At higher luminosities (LIR 1012 L☉) the sources are characteristically high redshift quasars, submillimeter galaxies and radio galaxies. While the observed CO transition in these sources is typically greater than the ground state transition, the relationship between LIR and CO luminosity retains an index of 1.4. In contrast, our models (§ 3) would predict a slope less than 1.4-1.6 if a Schmidt law index of 1.4-1.6 was valid for these high redshift sources. One possible origin for this steeper slope is a contribution to the LIR from embedded AGN.
Alternatively, the models presented here (as well as those of Krumholz & Thompson, 2007) suggest that high critical density tracers such as HCN (J=1-0) and high lying CO transitions may show a natural upturn from the SFR-line luminosity relation at the highest luminosities even without the contribution of embedded AGN. The galaxies at this end of the luminosity range are typically massive starbursts and/or advanced mergers with significant amounts of dense gas. As discussed previously, and shown in Figure 4 in the high mean gas density regime, tracers of dense gas such as CO (J=3-2) and HCN (J=1-0) become thermalized. The galaxies in our simulations with the highest SFRs (typically recently coalesced mergers) contain a large amount of dense gas, and thus most of their e.g. CO (J=3-2) emission arises from thermalized cells. The luminosity from this gas rises linearly with increasing cloud density (), and the consequent SFR-molecular line relation () will be superlinear (nearly equivalent to the Schmidt SFR index) for a sample of these galaxies. This is consistent with the modeling results of Krumholz & Thompson (2007) who find a similar upturn in their SFR-molecular line relations when the mean cloud density is much greater than the critical density of the molecular line, as well as the observational results of Gao et al. (2007).
We reiterate caution, however, that the observed SFR is typically derived from LIR measurements, and at these high infrared luminosities, the LIR may have a non-negligible contribution from a central AGN (e.g. Kim, Veilleux & Sanders, 2002; Tran et al., 2001; Veilleux, Kim & Sanders, 2002). While in principle our hydrodynamic simulations have the capability to investigate the potential contribution from growing black holes, a full calculation of the IR SED as well as relating it to inferred SFR properties is outside the scope of this work, and is deferred to a future study.
6. Relationship to Other Models and Interpretations
We now turn our attention toward other models and interpretations for the observed SFR-molecular line relations, and how our solution compares to these works.
Gao & Solomon (2004b) interpret the tight linear correlation between LIR and HCN (J=1-0) luminosity as evidence for an increasing fraction of dense gas in the most luminous sources in their sample, as well as a constant star formation efficiency in terms of dense (105cm-3) molecular gas mass. Because stars form in the dense cores of clouds, the linear relationship between LIR (which is powered by star formation) and HCN (J=1-0) luminosity is interpreted as a natural one.
Our models find that the fraction of dense molecular gas naturally increases with star formation rate. This is true both for the mergers which funnel cold gas into the central kiloparsec (fueling starbursts of 100 M☉yr-1), as well as isolated disk galaxies. Indeed this is an expected result as the SFR in our simulations is parametrized in terms of the cold gas density. This results in a higher fraction of the gas being thermalized in high critical density tracers in the systems with the highest SFRs (and, by extension, highest infrared luminosities). Indeed, this is what causes the upturn in the SFR-Lmol relation for high critical density tracers at the highest SFRs.
Utilizing observations of Galactic cloud cores, Wu et al. (2005) found that the dense Galactic cloud cores showed a linear relationship between LIR and HCN (J=1-0) emission. Using these results, they posited that the linear relationship between LIR and HCN (J=1-0) emission arises from HCN tracing fundamental star forming units which scale self-similarly from star forming regions in the Galaxy to ULIRGs. In the context that even high critical density tracers such as HCN and CS are thermalized in star forming cores (a result supported by both observational and theoretical evidence, e.g. Shirley et al., 2003; Walker, Maloney & Serabyn, 1994; Walker, Narayanan & Boss, 1994), the model results presented here may suggest that a Kennicutt-Schmidt index of =1.5 may not apply to the star formation rate of dense cores. The simulations here show that when the mean cloud density approaches the critical density of a molecular line, the line luminosity faithfully traces the cloud density (e.g. Figure 4, left panel). Thus, in the context of these models, the relationship between the SFR and line luminosity in dense, thermalized Galactic cores is expected to take an index of =1.5 if this index controls the Kennicutt-Schmidt SFR law for these objects. It may be, then, that in light of the linear relation between LIR and HCN (J=1-0) that a linear SFR law (e.g. SFR) describes star formation in dense cores (Wu et al., 2005).
The recent study by Krumholz & Thompson (2007) utilized radiative transfer modeling coupled with physical models of GMCs (consistent with turbulence-regulated star formation) to derive a motivation for the observed SFR-molecular line relations. These authors found that for individual star forming clouds, the line luminosity from high critical density tracers such as HCN (J=1-0) increased superlinearly with mean gas density owing to a superlinear increase in the fraction of thermalized gas with increasing mean cloud density. This results in a linear relationship between SFR and HCN (J=1-0) luminosity. While the simulations by Krumholz & Thompson (2007) were geared toward physical models of GMCs (in contrast to the hydrodynamic models of galaxies and galaxy mergers presented here), the physical mechanisms driving the SFR-Lmol relation are the same in both cases. In our simulations, a small fraction of the gas is typically thermalized in high critical density tracers (recall Figure 2). As the mean density of the distribution of cloud densities increases (e.g. as a galaxy achieves a higher SFR, typically through compression of gas in the nuclear regions), the fraction of gas that is thermalized in high critical density tracers moves toward the mean and increases superlinearly. An observable consequence of this in our simulations is the excitation of subthermal gas along the LOS, which is readily testable in local galaxy samples. In this sense, it is quite appealing that two different modeling techniques of systems of different size scales (GMCs versus models for galaxies) find the same physical mechanism driving the observed SFR-Lmol relation. In both cases, the fundamental SFR relation is indeed the Schmidt relation. The model results presented here may be directly tested as they predict that tracers of higher critical density than HCN (J=1-0) or CO (J=3-2) will be thermalized in a small fraction of the galaxy’s gas mass, and show a sublinear relationship between SFR and line luminosity (Figure 7).
Finally, we note that we include constant molecular abundances throughout our model galaxies, as a full chemical reaction network is both outside the scope of this work and not feasible given our spatial resolution limitations. In this sense, we are unable to evaluate these models in terms of potential HCN chemistry in the vicinity of a hard X-ray flux as has been argued by some authors. (e.g. Combes, 2007; Graciá-Carpio et al., 2006; Lintott & Viti, 2006). We do note, though, that our models quantitatively reproduce the observed relations between SFR and CO (J=1-0), CO (J=3-2) and HCN (J=1-0) emission in local galaxies while utilizing constant fractional molecular abundances. This may imply that potential chemistry-related effects have a negligible effect on observed SFR-molecular line relations.
7. Conclusions and Summary
We have utilized a combination of 3D non-LTE radiative transfer calculations with hydrodynamic simulations of isolated disk galaxies and galaxy mergers to derive a physical model for the observed SFR-molecular line relations. We specifically focus on the examples of the SFR-CO (J=1-0), CO (J=3-2) and HCN (J=1-0) relations as they are the best constrained observationally, and show that our model quantitatively reproduces the observed relations when a Schmidt index of 1.5 is assumed.
While the linear relationship between SFR and high critical density tracers such as HCN (J=1-0) and CO (J=3-2) in galaxies have been standardly interpreted as a fundamental SFR law owing to dense gas being the formation site of massive stars, our models suggest that this is not the entire story. The linear relations of SFR and HCN (J=1-0) and CO (J=3-2) arise as a consequence of a superlinear relation between line luminosity and mean gas density in galaxies. This owes to small amounts of thermalized gas in high critical density tracers. The fundamental relation is instead the underlying Schmidt law which sets the way in which observed transitions trace the molecular gas.
Our model makes the prediction that for CO lines with J3 and HCN lines with J2, the SFR-line luminosity relationships will be sublinear (Figure 7). These predictions can directly be tested with existing submillimeter-wave technology, as well as with ALMA. Our models additionally provide specific interpretation regarding the existing observed SFR-molecular line relations:
-
1.
The slope in a given SFR-molecular line luminosity relation is dependent on both the underlying Schmidt law controlling the SFR for the galaxy and the relationship between molecular line luminosity and density of emitting gas (the details of which are outlined in § 3). When line luminosity traces gas density linearly, the resultant SFR-line luminosity index is similar to the Schmidt law index. In cases where the line luminosity increases with gas density superlinearly, the SFR is related to line luminosity with an index less than the Schmidt index. The relationship between line luminosity and gas density depends on how the critical density of the line compares with the mean density of the bulk of the emitting clouds. This is similar to the explanations posited by Krumholz & Thompson (2007) who utilized models for turbulence-regulated GMCs. This directly affects the observed relations between SFR and CO (J=1-0), CO (J=3-2) and HCN (J=1-0) in the following way:
-
(a)
Owing to its low critical density, the CO (J=1-0) line is roughly thermalized throughout most regions of the galaxies in our simulation sample. This results in a linear rise in CO (J=1-0) luminosity with increasing gas density, and a consequent SFR-CO (J=1-0) relationship with index similar to the Schmidt index. For the case of a Schmidt index of 1.5, our simulations reproduce the observed relation between SFR and CO (J=1-0) luminosity.
-
(b)
The critical densities of CO (J=3=2) and HCN (J=1-0) are much higher than the mean density of the bulk of the clouds in our simulated galaxies. Because of this, the relationship between Lmol and is superlinear, causing an SFR-Lmol relation which has index less than the Schmidt index. An important observational consequence of this is that significant amounts of emission can arise from subthermally excited diffuse gas in the vicinity of denser regions. For the case of a Schmidt index of 1.5, the observed relations between SFR and HCN (J=1-0) and CO (J=3-2) emission are recovered.
-
(a)
-
2.
The emission processes driving the line luminosity-density relations (and consequently SFR-line luminosity relations) are variable such that some galaxies exhibit mostly thermalized gas for high critical density tracers whereas others are largely subthermally excited. Generally, the galaxies with higher SFRs have more of their gas thermalized which may drive the upturn in the LIR-HCN (J=1-0) relationship for extremely high luminosity sources observed by Gao et al. (2007). This result is additionally recovered by models for GMCs by Krumholz & Thompson (2007).
-
3.
The physical basis for these models has a similar reasoning as those posited by Krumholz & Thompson (2007) for the SFR-Lmol relation in turbulence regulated GMCs. In this sense, two completely different modeling techniques arrive at similar physical motivations for the observed SFR-Lmol relation in galaxies.
-
4.
We reemphasize that these models can be directly tested via observations of high critical density tracers (see Figure 7). In particular, these models suggest that observations of HCN lines higher than J=1-0 and CO lines higher than CO J=3-2 should bear sublinear relations between SFR and Lmol.
-
5.
A natural consequence of this model is that at the highest SFRs, the SFR-Lmolrelation will have an index similar to that of the underlying Schmidt index. This is a generic feature of our models, and happens regardless of the inclusion of AGN.
References
- Andre et al. (1996) Andre, P., Ward-Thompson, D., & Motte, F. 1996, A&A, 314, 625
- Baan et al. (2007) Baan, W. A., Henkel, C., Loenen, A. F., Baudry, A., & Wiklind, T. 2007, ArXiv e-prints, 710, arXiv:0710.0141
- Bernes (1979) Bernes, C. 1979, A&A, 73, 67
- Blitz et al. (2006) Blitz, L., Fukui, Y., Kawamura, A., Leroy, A., Mizuno, N., Rosolowsky, E., 2006, “Giant Molecular Clouds in Local Group Galaxies”, in Protostars and Planets V [astro-ph/0602600]
- Chakrabarti et al. (2007a) Chakrabarti, S., Cox, T. J., Hernquist, L., Hopkins, P. F., Robertson, B., & Di Matteo, T. 2007a, ApJ, 658, 840
- Chakrabarti et al. (2007b) Chakrabarti, S., Fenner,Y., Hernquist, L., Cox, T.J., Hopkins, P.F., 2007b, ApJ, submitted [astro-ph/0610860]
- Combes (2007) Combes, F. 2007, Proceedings of ”Molecules in Space and Laboratory”, eds J-L. Lemaire and F. Combes, 2007 ArXiv e-prints, 709, arXiv:0709.3694
- Cox et al. (2006a) Cox, T.J., Dutta, S.N., Di Matteo, T., Hernquist, L., Hopkins, P.F., Robertson, B., Springel, V., 2006a, ApJ, 650, 791
- Cox et al. (2006b) Cox, T.J., Di Matteo, T., Hernquist, L., Hopkins, P.F., Robertson, B., Springel, V., 2006b, ApJ, 643, 692
- Cox et al. (2006c) Cox, T. J., Jonsson, P., Primack, J. R., & Somerville, R. S. 2006c, MNRAS, 373, 1013
- Davé et al. (1999) Davé, R., Hernquist, L., Katz, N., & Weinberg, D. H. 1999, ApJ, 511, 521
- Di Matteo et al. (2005) Di Matteo, T., Springel, V., & Hernquist, L. 2005, Nature, 433, 604
- Fuller & Myers (1992) Fuller, G. A., & Myers, P. C. 1992, ApJ, 384, 523
- Gao & Solomon (2004a) Gao, Y., & Solomon, P. M. 2004a, ApJ, 606, 271
- Gao & Solomon (2004b) Gao, Y., & Solomon, P. M. 2004b, ApJS, 152, 63
- Gao et al. (2007) Gao, Y., Carilli, C. L., Solomon, P. M., & Vanden Bout, P. A. 2007, ApJ, 660, L93
- Goldreich & Kwan (1974) Goldreich, P., & Kwan, J. 1974, ApJ, 189, 441
- Graciá-Carpio et al. (2006) Graciá-Carpio, J., García-Burillo, S., Planesas, P., & Colina, L. 2006, ApJ, 640, L135
- Greve et al. (2005) Greve, T. R., et al. 2005, MNRAS, 359, 1165
- Greve & Sommer-Larsen (2006) Greve, T. R., & Sommer-Larsen, J. 2006, ArXiv Astrophysics e-prints, arXiv:astro-ph/0608683
- Greve et al. (2006) Greve, T. R., Papadopoulos, P. P., Gao, Y., & Radford, S. J. E. 2006, ArXiv Astrophysics e-prints, arXiv:astro-ph/0610378
- Hainline et al. (2006) Hainline, L. J., Blain, A. W., Greve, T. R., Chapman, S. C., Smail, I., & Ivison, R. J. 2006, ApJ, 650, 614
- Hernquist (1990) Hernquist, L. 1990, ApJ, 356, 359
- Hollenbach & Tielens (1999) Hollenbach, D. J., & Tielens, A. G. G. M. 1999, Reviews of Modern Physics, 71, 173
- Hopkins et al. (2005a) Hopkins, P.F., Hernquist, L., Martini, P., Cox, T.J., Robertson, B., Di Matteo, T., Springel, V., 2005a, ApJ, 625, L71
- Hopkins et al. (2005b) Hopkins, P.F., Hernquist, L., Cox, T.J., Di Matteo, T., Martini, P., Robertson, B., Springel, V., 2005b, ApJ, 630, 705
- Hopkins et al. (2005c) Hopkins, P.F., Hernquist, L., Cox, T.J., Di Matteo, T., Robertson, B., Springel, V., 2005c, ApJ, 630, 716
- Hopkins et al. (2005d) Hopkins, P.F., Hernquist, L., Cox, T.J., Di Matteo, T., Robertson, B., Springel, V., 2005d, ApJ, 632, 81
- Hopkins et al. (2006a) Hopkins, P.F., Hernquist, L., Cox, T.J., Di Matteo, T., Robertson, B., Springel, V., 2006a, ApJS, 163, 1
- Hopkins et al. (2006b) Hopkins, P.F., Hernquist, L., Cox, T.J., Robertson, B., Springel, V., 2006b, ApJS, 163, 50
- Hopkins et al. (2006c) Hopkins, P.F., Hernquist, L., Cox, T.J., Robertson, B., Di Matteo, T., Springel, V., 2006c, ApJ, 639, 700
- Hopkins et al. (2006d) Hopkins, P.F., Somerville, R., Hernquist, L., Cox, T.J., Robertson, B., Li, Y., 2006d, ApJ, 652, 864
- Hopkins et al. (2006e) Hopkins, P.F., Richards, G.T., Hernquist, L., 2006e, ApJ, submitted [astro-ph/0605678]
- Hopkins & Hernquist (2006) Hopkins, P.F., Hernquist, L., 2006, ApJS, in press [astro-ph/0603180]
- Hopkins et al. (2007a) Hopkins, P.F., Hernquist, L., Cox, T.J., Robertson, B., Krause, E., 2007a, ApJ, in press [astro-ph/0707.4005]
- Hopkins et al. (2007b) Hopkins, P.F., Hernquist, L., Cox, T.J., Robertson, B., Krause, E., 2007b, ApJ, in press [astro-ph/070135]
- Hopkins et al. (2007c) Hopkins, P.F., Hernquist, L., Cox, T.J., Keres, D., 2007c, ApJ, in press [astro-ph/0706.1243v2]
- Hopkins et al. (2007d) Hopkins, P.F., Cox, T.J., Keres, D., Hernquist, L., 2007d, ApJ, in press [astro-ph/0706.1246v2]
- Hopkins et al. (2007e) Hopkins, P.F., Hernquist, L., Cox, T.J., Dutta, S.N., Rothberg, B., 2007e, ApJ, submitted
- Hopkins et al. (2007f) Hopkins, P.F., Hernquist, L., Cox, T.J., Dutta, S.N., Kormendy, J., Lauer, T., 2007f, ApJ, submitted
- Jonsson (2006) Jonsson, P. 2006, MNRAS, 372, 2
- Katz et al. (1996) Katz, N., Weinberg, D. H., & Hernquist, L. 1996, ApJS, 105, 19
- Kennicutt (1998a) Kennicutt, R. C., Jr. 1998a, ARA&A, 36, 189
- Kennicutt (1998b) Kennicutt, R. C., Jr. 1998b, ApJ, 498, 541
- Kennicutt et al. (2007) Kennicutt, R. C., Jr., et al. 2007, ArXiv e-prints, 708, arXiv:0708.0922
- Keres, Yun & Young (2003) Keres, D., Yun, M. S., & Young, J. S. 2003, ApJ, 582, 659
- Kim, Veilleux & Sanders (2002) Kim, D.-C., Veilleux, S., Sanders, D.B., 2002, ApJS, 143, 277
- Krumholz & McKee (2005) Krumholz, M. R., & McKee, C. F. 2005, ApJ, 630, 250
- Krumholz & Thompson (2007) Krumholz, M. R., & Thompson, T. A. 2007, ArXiv e-prints, 704, arXiv:0704.0792
- Lee, Bettens & Herbst (1996) Lee, H.-H., Bettens, R. P. A., & Herbst, E. 1996, A&AS, 119, 111
- Li et al. (2007a) Li, Y., Hernquist, L., Robertson, B., Cox, T.J., Hopkins P., Springel, V., Gao, L., Di Matteo, T., Zentner, A., Jenkins, A., Yoshida, N., 2007a, ApJ, accepted [astro-ph/0608190]
- Li et al. (2007b) Li, Y., Hernquist, L., Finkbeiner, D., Springel, V., Jiang, L., Fan, X., 2007b, ApJ[arXiv:0706.3706]
- Lintott & Viti (2006) Lintott, C., & Viti, S. 2006, ApJ, 646, L37
- Madore (1977) Madore, B. F. 1977, MNRAS, 178, 1
- McKee & Ostriker (1977) McKee, C. F., & Ostriker, J. P. 1977, ApJ, 218, 148
- Mihos & Hernquist (1994a) Mihos, J.C., & Hernquist. L. 1994a, ApJ, 437, L47
- Mihos & Hernquist (1994b) Mihos, J.C., & Hernquist. L. 1994b, ApJ, 427, 112
- Mihos & Hernquist (1996) Mihos, J.C., & Hernquist. L. 1996, ApJ, 464, 641
- Narayanan et al. (2005) Narayanan, D., Groppi, C. E., Kulesa, C. A., & Walker, C. K. 2005, ApJ, 630, 269
- Narayanan et al. (2006a) Narayanan, D., Cox, T.J., Robertson, B., Davé, R., Di Matteo, T., Hernquist, L., Hopkins, P., Kulesa, C., Walker, C.K., 2006a, ApJ, 642, L107
- Narayanan et al. (2006b) Narayanan, D., Kulesa, C. A., Boss, A., & Walker, C. K. 2006b, ApJ, 647, 1426
- Narayanan et al. (2007a) Narayanan, D.,Li, Y., Cox, T.J., Hernquist, L., Hopkins, P., Chakrabarti, S., Davé, R., Di Matteo, T., Gao, L., Kulesa, C., Robertson, B., Walker, C.K., 2007a, ApJ, in press [ArXiv e-prints, 707, arXiv:0707.3141]
- Narayanan et al. (2007b) Narayanan, D., Cox, T.J., Kelly, B., Davé, R., Hernquist, L., Di Matteo, T., Hopkins, P., Kulesa, C., Robertson, B., Springel, V., Walker, C.K., 2007b, ApJ, in press [ ArXiv e-prints, 710, arXiv:0710.0384]
- Papadopoulos (2007) Papadopoulos, P. P. 2007, ApJ, 656, 792
- Papadopoulos, Isaak & van der Werf (2007) Papadopoulos, P. P., Isaak, K. G., & van der Werf, P. P. 2007, ArXiv e-prints, 706, arXiv:0706.0811
- Riechers et al. (2006) Riechers, D. A., Walter, F., Carilli, C.L., Knudsen, K.K., Lo, K.Y., Benford, D.J., Staguhn, J.G., Hunter, T.R., Bertoldi, F., Henkel, C., Menten, K.M., Weiß, A., Yun, M.S., Scoville, N.Z., 2006, ApJ, 650, 604
- Robertson et al. (2006a) Robertson, B., Hernquist, L., Cox, T.J., Di Matteo, T., Hopkins, P.F., Martini, P., Springel, V., 2006a, ApJ, 641, 90
- Robertson et al. (2006b) Robertson, B., Cox, T.J., Hernquist, L., Franx, Marijn, Hopkins, P.F., Martini, P., Springel, V., 2006c, ApJ, 641,21
- Robertson et al., (2007) Robertson, B., Li, Y., Cox, T.J., Hernquist, L., Hopkins, P.F., 2007, ApJ, in press [astro-ph/0703456]
- Rosolowsky (2005) Rosolowsky, E. 2005, PASP, 117, 1403
- Rosolowsky (2007) Rosolowsky, E. 2007, ApJ, 654, 240
- Sanders et al. (1991) Sanders, D. B., Scoville, N. Z., & Soifer, B. T. 1991, ApJ, 370, 158
- Sanders & Mirabel (1996) Sanders, D. B., & Mirabel, I. F. 1996, ARA&A, 34, 749
- Schmidt (1959) Schmidt, M. 1959, ApJ, 129, 243
- Schöier et al. (2005) Schöier, F. L., van der Tak, F. F. S., van Dishoeck, E. F., & Black, J. H. 2005, A&A, 432, 369
- Shirley et al. (2003) Shirley, Y. L., Evans, N. J., II, Young, K. E., Knez, C., & Jaffe, D. T. 2003, ApJS, 149, 375
- Solomon et al. (1987) Solomon, P. M., Rivolo, A. R., Barrett, J., & Yahil, A. 1987, ApJ, 319, 730
- Solomon & Vanden Bout (2005) Solomon, P. M., & Vanden Bout, P. A. 2005, ARA&A, 43, 677
- Springel (2000) Springel, V. 2000, MNRAS, 312, 859
- Springel & Hernquist (2002) Springel, V., & Hernquist, L. 2002, MNRAS, 333, 649
- Springel & Hernquist (2003) Springel, V., & Hernquist, L. 2003, MNRAS, 339, 289
- Springel, Di Matteo & Hernquist (2005) Springel, V., Di Matteo, T., & Hernquist, L. 2005, MNRAS, 361, 776
- Springel (2005) Springel, V. 2005, MNRAS, 364, 1105
- Tan (2000) Tan, J. C. 2000, ApJ, 536, 173
- Tran et al. (2001) Tran, Q.D., Lutz, D., Genzel, R., Rigopoulou, D., Spoon, H.W..W., Sturm, E., Gerin, M., Hines, D.C., Moorwood, A.F.M., Sanders, D. et al., 2001, ApJ, 552, 527
- van Zadelhoff et al. (2002) van Zadelhoff, G.-J., et al. 2002, A&A, 395, 373
- Veilleux, Kim & Sanders (2002) Veilleux, S., Kim, D.-C., Sanders, D.B., 2002, ApJS, 143, 315
- Wada & Tomisaka (2005) Wada, K., & Tomisaka, K. 2005, ApJ, 619, 93
- Wagg et al. (2005) Wagg, J., Wilner, D. J., Neri, R., Downes, D., & Wiklind, T. 2005, ApJ, 634, L13
- Wagg et al. (2007) Wagg, J., Hughes, D. H., Aretxaga, I., Chapin, E. L., Dunlop, J. S., Gaztañaga, E., & Devlin, M. 2007, MNRAS, 375, 745
- Walker, Adams & Lada (1990) Walker, C. K., Adams, F. C., & Lada, C. J. 1990, ApJ, 349, 515
- Walker, Narayanan & Boss (1994) Walker, C. K., Narayanan, G., & Boss, A. P. 1994, ApJ, 431, 767
- Walker, Maloney & Serabyn (1994) Walker, C. K., Maloney, P. R., & Serabyn, E. 1994, ApJ, 437, L127
- Weiß et al. (2007) Weiß, A., Downes, D., Neri, R., Walter, F., Henkel, C., Wilner, D. J., Wagg, J., & Wiklind, T. 2007, A&A, 467, 955
- Wu et al. (2005) Wu, J., Evans, N. J., II, Gao, Y., Solomon, P. M., Shirley, Y. L., & Vanden Bout, P. A. 2005, ApJ, 635, L173
- Yamada et al. (2007) Yamada, M., Wada, K., & Tomisaka, K. 2007, ArXiv e-prints, 708, arXiv:0708.1045
- Yao et al. (2003) Yao, L., Seaquist, E. R., Kuno, N., & Dunne, L. 2003, ApJ, 588, 771
- Zuckerman & Evans (1974) Zuckerman, B., & Evans, N. J., II 1974, ApJ, 192, L149