Spin Susceptibility of Interacting Two-dimensional Electrons with Anisotropic Effective Mass
Abstract
We report measurements of the spin susceptibility in dilute (rs up to 10) AlAs two-dimensional (2D) electrons occupying a single conduction-band valley with an anisotropic in-plane Fermi contour, characterized by longitudinal and transverse effective masses, ml and mt. As the density is decreased, the spin susceptibility is significantly enhanced over its band value, reflecting the role of interaction. Yet the enhancement is suppressed compared to the results of quantum Monte Carlo based calculations that take the finite thickness of the electron layer into account but assume an isotropic effective mass equal to . Proper treatment of an interacting 2D system with an anisotropic effective mass therefore remains a theoretical challenge.
The low-temperature electronic properties of a clean, two-dimensional electron system (2DES) are dominated by electron-electron interaction at low enough densities where the Coulomb energy is much larger than the kinetic (Fermi) energy. In particular, the spin susceptibility of a dilute 2DES is expected to increase significantly over its band value as the density is lowered CeperleyPRB1989 ; AttaccalitePRL2002 . An increase of the susceptibility has indeed been observed recently in several 2DESs OkamotoPRL1999 ; VitkalovPRL2001 ; ShashkinPRL2001 ; PudalovPRL2002 ; ZhuPRL2003 ; PrusPRB2003 ; TutucPRB2003 ; VakiliPRL2004 ; ShkolnikovPRL2004 ; TanPRB2006 . The observed enhancements are qualitatively explained by calculations for an ideal 2DES although for a quantitative agreement, the properties of a real 2DES have to be taken into account DePaloPRL2005 ; ZhangPRB2005 . Specifically, when the electrons occupy a conduction-band valley with an in-plane Fermi contour, such as the 2DESs in either a GaAs/AlGaAs heterostructure ZhuPRL2003 , or in a narrow AlAs quantum well VakiliPRL2004 , the quantum Monte Carlo (QMC) calculations quite accurately describe the experimental data, once the finite thickness of the 2DES is included DePaloPRL2005 .
Here we report measurements of the spin susceptibility for 2DESs confined to AlAs quantum wells where, thanks to the application of symmetry-breaking in-plane strain, the electrons occupy a single conduction-band valley with an Fermi contour, characterized by longitudinal and transverse effective masses, and . We compare the measured susceptibility values with the results of QMC based calculations that take the finite layer thickness into account but resort to a simple mapping of the anisotropic system onto an isotropic one with an effective mass, m note1 . As usual, the electronic coupling parameter is defined in terms of the electron density () as the mean inter-electron separation measured in units of the effective Bohr radius . Here where is the AlAs dielectric constant, is the effective mass in units of the free electron mass, and Å. Note that can be equivalently written as the ratio of the Coulomb energy to the Fermi energy of the 2DES. We find that the experimental values of susceptibility fall well below the calculated values. The results highlight the need for a more proper treatment of an interacting electron system with an anisotropic effective mass.
Bulk AlAs has conduction band minima at the six equivalent X points of the Brillouin zone. The Fermi surface consists of six half ellipsoids (three full ellipsoids or valleys), each with an anisotropic mass (=1.05 and =0.205, in units of free electron mass). We denote these valleys as , , and valleys, according to the direction of their major axes, [100], [010], and [001], respectively. In bulk AlAs these three valleys are degenerate, but this degeneracy is lifted in quantum well (QW) structures ShayeganPSS2006 . Confinement in the growth ([001]) direction, lowers the energy of the valley which has a larger mass along [001] and a smaller, isotropic mass in the plane. In a narrow AlAs QW with a width smaller than 5nm, the electrons indeed occupy this out-of-plane valley. The spin susceptibility of such a 2DES, with an in-plane effective mass was measured by Vakili et al. VakiliPRL2004 , and was found to be in excellent agreement with the results of QMC calculations VakiliPRL2004 ; DePaloPRL2005 . It is possible, however, to confine the 2D electrons to the and valleys whose major axes lie in the plane. This comes about thanks to the lattice mismatch between GaAs and AlAs: Since GaAs has a smaller lattice constant than AlAs, an AlAs QW grown on a GaAs substrate feels a compressive, bi-axial strain in the plane, which favors the occupation of the two in-plane valleys. Indeed, these valleys are occupied for AlAs QW widths larger than 5nm. Furthermore, the degeneracy of the and valleys can be lifted by applying symmetry-breaking strain in the plane ShayeganAPL2003 ; ShayeganPSS2006 ; ShkolnikovAPL2004 ; ShkolnikovPRL2004 ; GunawanPRL2006 so that only one valley, with an in-plane effective mass, is occupied. This is the system we studied in our present work.
We performed measurements on 2DESs confined to AlAs QWs of width 11 and 15nm, grown on (001) GaAs substrates via molecular beam epitaxy. The AlAs QW is flanked by selectively-doped Al0.4Ga0.6As barrier layers DePoortereAPL2002 . We fabricated L-shaped Hall bar mesas, along the [100] and [010] orientations and made Ohmic contacts to the 2DES by depositing AuGeNi layers and alloying in a reducing environment. Metal front and back gates were also deposited and used, together with illumination, to control the 2DES density. As a final step, we thinned our samples down to 200 microns and glued them on a piezoelectric actuator ShayeganPSS2006 ; ShayeganAPL2003 . Using the actuator, we were able to transmit sufficiently large compressive strain in the [100] direction to transfer all the electrons to the valley ShayeganPSS2006 ; ShkolnikovAPL2004 . The density range of 2.2 to 6.71011cm-2 achieved in our samples corresponds to an range of 6 to 10.5, using AlAs dielectric constant of 10 and the band density-of-states effective mass of . The densities were determined from the Hall resistance and the minima of the Shubnikov-de Haas oscillations of the longitudinal resistance (). The mobility in this density range varied from 1.1 to 3.0 m2/Vs for current along [100] and 2.6 to 5.2 m2/Vs for current along the [010] direction. Measurements were done down to = 0.3K using the lock-in technique and in a cryostat with a tilting stage, allowing the angle , between the sample normal and the magnetic field to be varied in situ. We denote the parallel and perpendicular components of the total magnetic field (Btot) by and , respectively. The orientation of for the data we present here was along [100] (see Fig. 1(b)); in separate cooldowns, we verified that, within the accuracy of our measurements, the spin-susceptibility does not depend on the orientation of the magnetic field with respect to the direction of the major axis of the occupied valley.
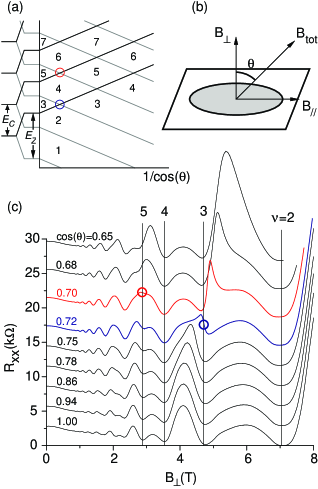
We used the ”coincidence” technique FangPR1968 to measure the spin susceptibility or, equivalently, , where and are the effective Landé g-factor and mass, respectively. Note that , where is the net spin imbalance. As shown in the simple fan diagram in Fig. 1(a), the 2DES energy is quantized into Landau levels (LLs) which are separated by the cyclotron energy, . Each LL is in turn split into two levels separated by the Zeeman energy, . By varying , one can control the ratio between and . When this ratio equals an integer value at some critical angle, two different LLs coincide in energy and, if this happens at the Fermi level, then the resistance becomes a maximum. At the coincidence, the ratio of Zeeman to cyclotron energy can be written as , where is the difference in the LL index of the crossing levels. Note that if does not depend on the spin polarization then, as seen in the simple fan diagram of Fig. 1(a), coincidences for all the odd (or even) fillings would happen at the same . As we illustrate below, this is not necessarily the case for our data; we therefore use a coincidence condition that keeps track of the spin polarization, , where is the ratio of the difference between the indices of the crossing LLs (i.e., the number of the filled, majority spin levels) and the number of filled LLs. Using the above equation can be deduced at different spin polarizations by measuring the coincidence angle at different fillings, .
In Fig. 1(c) we show characteristic magnetoresistance traces at different tilt angles. Strong minima are observed at = 0 (bottom trace) at several filling factors, including = 2, 3, 4, and 5. As the sample is tilted, the minimum at = 3 turns into a maximum at (blue trace) indicating a coincidence for = 3 at this angle. At a slightly larger angle (, red trace) the = 5 state goes through a coincidence. The states at even go through coincidences at higher (data not shown). But note that the = 2 state remains strong at all tilt angles. This is because at this density, is larger than even at zero tilt due to the enhanced , as shown in the fan diagram of Fig. 1(a).
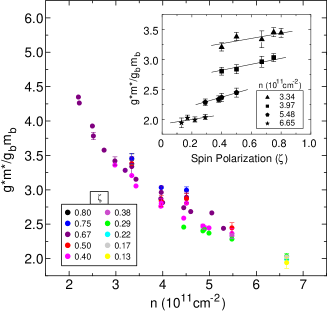
We summarize the measured values of , normalized to the band values and , as a function of in Fig. 2. Three aspects of the data are noteworthy. First, the data exhibit a strong enhancement of with decreasing , qualitatively consistent with previous reports for various 2DESs OkamotoPRL1999 ; VitkalovPRL2001 ; ShashkinPRL2001 ; PudalovPRL2002 ; ZhuPRL2003 ; PrusPRB2003 ; TutucPRB2003 ; VakiliPRL2004 ; ShkolnikovPRL2004 ; TanPRB2006 . Second, at a given , there is a small but noticeable dependence of on the degree of spin polarization (). This is evident from the data of Fig. 1(c): the = 3 state ( = 0.67) goes through a coincidence at a slightly smaller than the = 5 state ( = 0.40), reflecting a slightly larger when is larger BparComment . This dependence, which is explicitly shown in Fig. 2 and its inset, is consistent with what is theoretically expected, as we discuss below. Third, experimental data taken on an 11nm-wide AlAs QW with only one in-plane valley occupied ShkolnikovPRL2004 show values that are about 10% to 15% larger than those for the 15nm QW data shown in Fig. 2. Clearly, the larger the thickness of the 2DES, the smaller is the value of the spin susceptibility at a given .
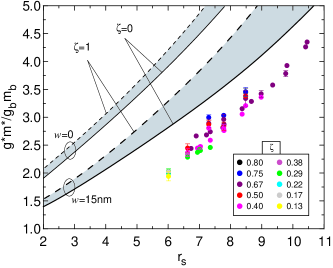
For a quantitative understanding of the data, we performed QMC based calculations of the spin susceptibility for our 2DES resorting to the simple mapping discussed above and in footnote note1 , thus exploiting the scheme for isotropic systems described in Ref. DePaloPRL2005 . The results of these calculations, are shown in Fig. 3 both for a 2DES confined to a 15nm-wide QW ( = 15nm, lower two curves) and for an ideal 2DES with zero layer thickness ( = 0, upper two curves). For each case, the QMC predictions are given for the spin susceptibility determined in the limit of zero spin polarization (, solid curves) and full polarization (, dashed curves) note2 . For a given layer thickness, the = 1 curve is above the = 0 curve. This indicates an increasing with increasing which indeed qualitatively agrees with the experimental data (Fig. 2 inset). Note also that the finite thickness of the electron layer softens the electron-electron interaction and suppresses the spin susceptibility, again in qualitative agreement with the experimental data, as described in the previous paragraph ( is smaller for the 15nm QW compared to the 11nm QW). Indeed, it was shown in Ref. DePaloPRL2005 that once the finite layer thickness of the 2DES is taken into account, the QMC predictions reproduce the experimental data for 2DESs with an (in-plane) effective mass. This was illustrated for the case of AlAs 2D electrons confined to a 4.5nm-wide QW (and occupying the valley which has an isotropic in-plane Fermi contour) and also GaAs 2D electrons at a GaAs/AlGaAs interface (occupying a single, isotropic valley at the -point of the Brillouin zone).
The main point of our paper is that the results of similar calculations (lower curves in Fig. 3), done for our 2DES, do accurately describe the experimental data points, but rather overestimate the spin susceptibility by as much as about 45%. This is also the case for the data from the 11nm-wide QW. We believe that the culprit is the effective mass of the 2DES. Note that for the QMC calculations whose results are shown in Fig. 3, we mapped the system with an anisotropic mass onto an effective system with an isotropic mass equal to . Evidently, this assumption leads to an overestimation of the spin susceptibility. We emphasize that two effects that are not included in the calculations, namely the presence of disorder and parallel magnetic field BparComment , both lead to a further of the susceptibility: Slight disorder is expected to increase the susceptibility DePaloPRL2005 , and the parallel field enhances the effective mass, also leading to a larger susceptibility TutucPRB2003 ; BparComment . The only other effect that is not fully included in the calculations is the anisotropy of the effective mass note3 . Properly incorporating electron-electron interaction in a 2DES with an anisotropic effective mass therefore remains a theoretical challenge.
We thank the NSF for support.
References
- (1) B. Tanatar and D.M. Ceperley, Phys. Rev. B 39, 5005 (1989).
- (2) C. Attaccalite, S. Moroni, P. Gori-Giorgi, and G.B. Bachelet, Phys. Rev. Lett. 88, 256601 (2002).
- (3) T. Okamoto, K. Hosoya, S. Kawaji, and A. Yagi, Phys. Rev. Lett. 82, 3875 (1999).
- (4) S.A. Vitkalov, H. Zheng, K.M. Mertes, M.P. Sarachik, and T.M. Klapwijk, Phys. Rev. Lett. 87, 086401 (2001).
- (5) A.A. Shashkin, S.V. Kravchenko, V.T. Dolgopolov, and T.M. Klapwijk, Phys. Rev. Lett. 87, 086801 (2001).
- (6) V.M. Pudalov, M.E. Gershenson, H. Kojima, N. Butch, E.M. Dizhur, G. Brunthaler, A. Prinz, and G. Bauer, Phys. Rev. Lett. 88, 196404 (2002).
- (7) J. Zhu, H.L. Stormer, L.N. Pfeiffer, K.W. Baldwin, and K.W. West, Phys. Rev. Lett. 90, 056805 (2003).
- (8) O. Prus, Y. Yaish, M. Reznikov, U. Sivan, and V. Pudalov, Phys. Rev. B 67, 205407 (2003).
- (9) E. Tutuc, S. Melinte, E.P. De Poortere, M. Shayegan, and R. Winkler, Phys. Rev. B 67, 241309(R) (2003).
- (10) K. Vakili, Y.P. Shkolnikov, E. Tutuc, E.P. De Poortere, and M. Shayegan, Phys. Rev. Lett. 92, 226401 (2004).
- (11) Y.P. Shkolnikov, K. Vakili, E.P. De Poortere, and M. Shayegan, Phys. Rev. Lett. 92, 246804. (2004).
- (12) Y.-W. Tan, J. Zhu, H.L. Stormer, L.N. Pfeiffer, K.W. Baldwin, and K.W. West, Phys. Rev. B 73, 045334 (2006).
- (13) S. De Palo, M. Botti, S. Moroni, and G. Senatore, Phys. Rev. Lett. 94, 226405 (2005).
- (14) Y. Zhang and S. Das Sarma, Phys. Rev. B 72, 075308 (2005); Phys. Rev. B 72, 115317 (2005).
- (15) Such a mapping is exact (approximate) for non-interacting (interacting) electrons, as is readily found by considering the coordinate trasformation , , , which yields an isotropic kinetic energy with mass and an -dependent interparticle interaction, ; this intrinsic dependence is neglected in our simple mapping, which uses .
- (16) M. Shayegan, E.P. De Poortere, O. Gunawan, Y.P. Shkolnikov, E. Tutuc, and K. Vakili, Phys. Status Solidi (b) 243, 3629 (2006).
- (17) M. Shayegan, K. Karrai, Y.P. Shkolnikov, K. Vakili, E.P. De Poortere, and S. Manus, Appl. Phys. Lett. 83, 5235 (2003).
- (18) Y.P. Shkolnikov, K. Vakili, E.P. De Poortere, and M. Shayegan, Appl. Phys. Lett. 85, 3766 (2004).
- (19) O. Gunawan, Y.P. Shkolnikov, K. Vakili, T. Gokmen, E.P. De Poortere, and M. Shayegan, Phys. Rev. Lett. 97, 186404 (2006).
- (20) E.P. De Poortere, Y.P. Shkolnikov, E. Tutuc, S.J. Papadakis, M. Shayegan, E. Palm and T. Murphy, Appl. Phys. Lett. 80, 1583 (2002).
- (21) F.F. Fang and P.J. Stiles, Phys. Rev. 174, 823 (1968).
- (22) The parallel magnetic field () couples to electrons’ orbital motion and deforms the bands, resulting in an enhancement of the effective mass [E. Tutuc et al., Phys. Rev. B 67, 241309(R) (2003)]. But, thanks to the narrow width of our QWs, we expect this mass enhancement to be small ( 4% for along [100] and 1% for along [010], for the range of T used in our measurements). Moreover, we note that the data of Fig. 2 were taken with along the [100] direction (see Fig. 1(b)). Data taken with along [010] indicated that the measured does not depend on the orientation of relative to the major axis of the occupied valley.
- (23) For the QMC results in Fig. 3, the internal energy per electron is a convex function and the equilibrium spin polarization an increasing function of the applied magnetic field . The finite susceptibility turns out to be an increasing function in the 2D limit, while in the thick nm case it develops a very weak maximum near , the value at the maximum being larger than that at by at most 3%.
- (24) Inclusion of the intrinsic dependence neglected in the simple mapping note1 , yields a depression of both in Hartree-Fock (HF) and random phase approximation (RPA) calculations. In the strictly 2D HF, the depression arises from a reduction of the exchange energy by the factor , with the complete elliptic integral of the first kind. But even in the simplest case of an isotropic 2D system with minimal thickness, HF and RPAZhangPRB2005 grossly overestimate the experimental dataVakiliPRL2004 , which are in quantitative agreement with the QMC resultsDePaloPRL2005 . We conclude that, while both HF and RPA calculations suggest that anisotropy leads to a suppression of , for a quantitative account of the experimental data one has to go beyond such approximate calculations.