Wide-Field Survey of Globular Clusters in M31. II. Kinematics of the Globular Cluster System11affiliation: Based on observations with the Kitt Peak National Observatory, National Optical Astronomy Observatory, which is operated by the Association of Universities for Research in Astronomy, Inc. (AURA) under cooperative agreement with the National Science Foundation.
Abstract
We present a kinematic analysis of the globular cluster (GC) system in M31. Adding new velocity data for 150 GCs in our wide-field survey to those in the literature, we increase the number of M31 GCs with measured velocities by 42 per cent, to 504. Using the photometric and spectroscopic database of these 504 GCs, we have investigated the kinematics of the M31 GC system. We find that the all GC system shows strong rotation, with rotation amplitude of km s-1, and that a weak rotation persists even for the outermost samples at kpc where represents the projected distance from the major axis. The rotation-corrected velocity dispersion for the GC system is estimated to be km s-1, and it increases from km s-1 at kpc to km s-1 at kpc. These results are very similar to those for the metal-poor GCs. This shows that there is a dynamically hot halo in M31 that is rotating but primarily pressure-supported. We have identified 50 “friendless” GCs, and they appear to rotate around the major axis of M31, unlike M31’s disk rotation around the minor axis. For the subsamples of metal-poor and metal-rich GCs, we have found that the metal-rich GCs are more centrally concentrated than the metal-poor GCs, and both subsamples show strong rotation. For the subsamples of bright and faint GCs, it is found that the rotation for the faint GCs is stronger than that for the bright GCs. We have identified 56 GCs and GC candidates with X-ray detection including 39 genuine GCs with measured velocities. It is found that the majority of X-ray emitting GCs follow the disk rotation, and that the redder, more metal-rich, and brighter GCs are more likely to be detected as X-ray emitting GCs, as seen for GCs in early-type galaxies. We have derived a rotation curve of M31 using the GCs at kpc, and it agrees well for the range of to that based on other tracers except for the planetary nebulae. We have estimated the dynamical mass of M31 using ‘Projected Mass Estimator (PME)’ and ‘Tracer Mass Estimator (TME)’ as out to a radius of kpc and for a radius of kpc, respectively. We finally discuss the implication of these results and compare the kinematics of GCs with that of planetary nebulae in M31.
1 Introduction
Globular clusters (GCs) are the oldest stellar systems in the universe and thus maintain a fossil record of the early history of galaxies. They are much brighter than stars and the spatial distribution of the GCs is much more extended than that of the halo stars in galaxies. Therefore they are an excellent tool to investigate the kinematics of the main components (stellar and dark matter halo, bulge, and disk) of galaxies and to estimate the mass of their host galaxies.
M31 is a unique object as the nearest spiral galaxy in the Local Group, providing an excellent place to study GCs. It has the largest GC system of any galaxy within several Mpc. Therefore, there are numerous studies of GCs in M31 since the first study by Hubble (1932) (e.g., (van den Bergh, 1969; Sargent et al., 1977; Battistini et al., 1987; Huchra et al., 1991; Barmby et al., 2000; Perrett et al., 2002; Morrison et al., 2004; Burstein et al., 2004; Huxor et al., 2005; Beasley et al., 2005; Puzia et al., 2005; Galleti et al., 2006; Kim et al., 2007) and see extensive lists of earlier references in Hodge (1992); van den Bergh (2000)). In addition, there were several surveys and studies of the M31 GCs with X-ray detection, finding that the X-ray emitting GCs are commonly associated with low-mass X-ray binaries (Supper et al., 2001; Kong et al., 2002; Di Stefano et al., 2002; Kaaret, 2002; Williams et al., 2004; Trudolyubov & Priedhorsky, 2004; Pietsch et al., 2005; Fan et al., 2005; Trudolyubov et al., 2005, 2006).
Kinematics is one of the notable features for the M31 GCs, and has long been a focus of study. It is known that the kinematics of the M31 GCs is much different from that of the Galactic GCs in the sense that the former is dominated by rotation, while the latter shows weak rotation (Perrett et al., 2002)
The first detailed kinematic analysis of the M31 GC system was given by Hartwick & Sargent (1974) using radial velocities for 44 GCs in van den Bergh (1969). They estimated the total mass of M31, M, and found that the metal-poor GCs have a larger velocity dispersion than the metal-rich GCs. Huchra et al. (1982) obtained digital, low-dispersion spectra of 61 GCs, and found that the GC system rotates with an amplitude of km s-1. They also found a measurable but small metallicity gradient and no significant spectroscopic difference between the GCs with X-ray detection and those without X-ray detection. Federici et al. (1990) using the velocity data of 81 GCs obtained a total mass of for a radius of 16 kpc using a projected mass estimator. A comparison of the data with the model of Richstone & Tremaine (1984) showed that the GCs have circular or isotropic orbits, and lead to a total mass of based on circular orbits. Later, Federici et al. (1993) updated the total mass of M31 to be for a radius of 30 kpc using velocity data for 176 GCs.
In the 1990’s, metallicity information for a large sample of GCs () became available, and it was possible to investigate the kinematics of GC subsamples based on the metallicity. Huchra et al. (1991) estimated the radial velocities and metallicities for 150 GCs, and presented the detailed kinematics of the GC system using expanded subsamples of GCs based on metallicity. They identified a weak metallicity gradient as a function of projected radius. They found that, in the inner region ( kpc), the metal-rich ([Fe/H]) GCs exhibit a rapid rotation of km s-1, while the metal-poor GCs show no significant rotation. However, the rotation of the two subsamples could not be easily measured at larger radii. Later, Perrett et al. (2002) showed, using higher precision data of over 200 GCs ( typical velocity measurement error of 12 km s-1), that the entire M31 GC system is highly rotation-supported. This is in strong contrast to the case of the Milky Way where the GC system composed mostly of halo GCs is pressure-supported, although a minor system of the bulge GCs shows some rotation. They also found that the centrally concentrated metal-rich GCs appear not to be flattened, but are analogous to the bulge population with a strong rotation, and that the less concentrated metal-poor GCs also show a rapid rotation. Galleti et al. (2006) obtained velocity data for 42 genuine GCs, and produced a large data set of 349 M31 GCs with up-to-date velocities by combining all information in the literature.
Recently, large datasets of velocities for M31 GCs and several deep photometric studies of the halo fields in M31 have provided important clues for understanding the evolution of M31. Brown et al. (2003) presented very deep photometry of stars in a halo field along the minor axis of M31 at a projected distance of 11 kpc (corresponding to a deprojected distance of 53 kpc) and found that the M31 halo includes a major intermediate-age metal-rich population and a significant old metal-poor population. They suggested from this result that M31 may have undergone a major merger Gyr ago. Later Brown et al. (2007) suggested, from photometry of another minor-axis halo field at a projected distance of 21 kpc, that the outer spheroid is dominated by the debris of earlier merging events that might have occurred more than 8 Gyr ago.
Morrison et al. (2004) suggested the existence of an old thin disk composed of GCs in M31, using the data for 321 GCs presented in Perrett et al. (2002). Since the GCs in the thin disk have a metallicity distribution from [Fe/H] to above solar, and the metal-poor GCs are regarded as being as old as their Galactic counterparts, they concluded that the thin disk has remained undisturbed for Gyr or more. This is contradictory with the scenario of Brown et al. (2003) that M31 may have undergone a major merger Gyr ago. Later Beasley et al. (2004, 2005) suggested that the majority of M31 thin disk GCs may be significantly younger than 10 Gyr, up to Gyr and metal-rich ([Fe/H]). The existence of young and metal-rich GCs in the disk is also confirmed in other studies as well (Burstein et al., 2004; Puzia et al., 2005).
On the other hand Ashman & Bird (1993) first tried to identify subgroups in the M31 GC system using the positional and velocity information for 144 GCs in Huchra et al. (1991). They suggested that the clustering of GCs in position and velocity space may be a surviving signature of gaseous clumps from which the galaxy halo of M31 formed. Later, Perrett et al. (2003), using 301 GCs with measured velocity and metallicity in Perrett et al. (2002), searched for the subclustering of M31 GCs in the parameter space of projected radius, radial velocity, and metallicity. Interestingly Morrison et al. (2003) found a possible tidally distorted satellite of M31, Andromeda VIII, from the identification of a group of planetary nebulae (PNe), GCs, and two HI clouds. Recent kinematic studies of M31 streams (Ibata et al., 2001; McConnachie et al., 2004) started examining the GC groups including Andromeda VIII as a possible progenitor of the stream (e.g., Font et al. 2006a; Fardal et al. 2006a).
Although there were numerous studies to obtain the radial velocities and the metallicities for M31 GCs, there are still many GC candidates for which spectroscopic information is needed. For example, there are 569 GC candidates for which radial velocities are not available in a combined sample of M31 GCs in Galleti et al. (2006). Recently we have performed a homogeneous photometric and spectroscopic, wide-field survey of GCs in M31 covering a field of 3° 3° centered on M31. We presented the first result of our survey: a catalog of new GCs in M31 (Kim et al. 2007, Paper I). This is the second in the series of papers on this survey.
In this paper, we present the results of a kinematic study of the GC system in M31 using the velocity data of 150 GCs newly obtained in our survey and 354 GCs previously known in the literature. Section 2 gives a brief description of the data used in this analysis, and section 3 investigates the kinematic properties for various subsamples of M31 GCs. We discuss primary results in §4. A summary is given in the final section.
We adopted a distance to M31 of kpc derived by McConnachie et al. (2005) based on the method of the tip of the red giant branch, which is similar to the value given by Freedman & Madore (1990), 770 kpc. At this distance one arcmin in the sky corresponds to 0.227 kpc. We adopted the center position of M31 as , (J2000; Crane et al. 1992). Following the geometric transformation of Huchra et al. (1991), we define the and coordinates, which are the projected distances along the major and minor axis, respectively. and increase towards the northeast and the northwest, respectively, and are given by,
| (1) | |||
| (2) | |||
| (3) | |||
| (4) |
where and are Cartesian coordinates for and with a center at (, ), and PA is the position angle for the major axis (de Vaucouleurs, 1958).
2 Data
2.1 Master catalog of M31 GCs
First we used the data of GCs in M31 given in Paper I, which describes the details of our survey’s photometric and spectroscopic observations, data reduction, and the data set. Here we only give a brief summary of the data set of M31 GCs.
We selected GC candidates in Washington CCD images covering a field centered on M31, obtained at the KPNO 0.9 m telescope. Spectroscopic observations were made using the Hydra multifiber bench spectrograph at the WIYN 3.5 m telescope in September 2000 and November 2001 for 748 GC candidates including 106 previously known GCs. We determined the radial velocities for GC candidates by cross-correlating the candidate spectrum with those of two bright bonafide GCs in M31. Finally, we have independently found 1164 GCs and GC candidates, of which 559 are previously known GCs or GC candidates and 605 are newly found GC candidates. Among the GCs and GC candidates in our survey, there are 211 genuine GCs (class 1 in Paper I) with measured velocity. We have derived new velocity data for 150 GCs in our wide-field survey.
Galleti et al. (2004) compiled all known GCs and GC candidates in M31 in the literature, and published the Revised Bologna Catalogue (RBC) with 1035 objects. Later, Galleti et al. (2006) published an updated version of the Revised Bologna Catalogue V2.0 (RBC2) with 1164 objects. In order to produce a master catalog of radial velocities for M31 genuine GCs, we have secured, from the RBC2, 349 genuine GCs (class 1 in RBC2) with measured velocities and 5 GC candidates (ID B366, G137, B102, B430, B134 in RBC2) with measured velocities that were classified as genuine GCs in our survey. There are 61 objects in common between this study and the RBC2, if we use a matching tolerance of 4″. We have compared our velocity measurements with published velocity measurements (references are in RBC2) for these common objects, as displayed in Figure 1. This shows that our measurements, with a typical error of 35.3 km/s, agree with the published values within the combined errors except for nine objects showing velocity differences of over km s-1. We present the identification in RBC2 for these GCs in Figure 1. We tried to find any cause of the large difference for the nine objects, finding some explanation for five of them (B109, B124, B293, B315, and NB 21), but none for the other four(B347, B200, B331, and B387). The reasons for large velocity differences for five of these nine objects are as follows:
-
1.
B109 There are two velocity measurements for this object: km s-1 in Huchra et al. (1991) and km s-1 in Perrett et al. (2002). Since the velocity difference between two measurements is large and Perrett et al. (2002) gives higher precision data, RBC2 quoted km s-1. However, the measured velocity in our study is km s-1, which is consistent with the value in Huchra et al. (1991).
-
2.
B124 There are two velocity measurements for this object: km s-1 in Jablonka et al. (1998) and km s-1 in Barmby et al. (2000). Since the velocity difference between these two measurements is large and Barmby et al. (2000) gives the value with the smaller error, RBC2 quoted km s-1. However, the measured velocity in our study is km s-1, which is consistent with the value in Jablonka et al. (1998).
-
3.
B293 There are two velocity measurements for this object: km s-1 in Huchra et al. (1991) and km s-1 in Federici et al. (1993). RBC2 presented the value of a weighted mean ( km s-1), although the velocity difference is about km s-1. However, the measured velocity in our study is km s-1, which is closer to the value of Federici et al. (1993).
-
4.
B315 There are three velocity measurements for this object: km s-1 in Huchra et al. (1991), km s-1 in Federici et al. (1993), and km s-1 in Perrett et al. (2002). RBC2 presented the value of a weighted mean ( km s-1) excluding the measurement in Perrett et al. (2002). However, the measured velocity in our study is km s-1, which is consistent with the value of Perrett et al. (2002).
-
5.
NB21 The velocity measurement in our study is km s-1, while that in Jablonka et al. (1998) is km s-1. Since the pointing coordinate of our spectroscopic observation is different from the photometric center of this object by about 1.72 , and this object is located in Field 25 in Paper I that is close to the M31 center, the observed spectrum in this study might be significantly contaminated by the M31 stellar light.
Since our measurements for B109, B124, B293, and B315 are similar to those of at least one value in the literature, we prefer to keep our measurements for those GCs at this time. We keep our measurement for NB21 for further analysis, since there is no convincing evidence to change our measurement at this moment.
From the weighted linear fit discarding these nine objects with large velocity differences, we derive a transformation relation between the two systems,
| (5) |
The radial velocities for the GCs in RBC2 were transformed onto our velocity system using equation (5), and the transformed velocities were used for further analysis. We used our velocity measurements for the above nine objects. Finally, we produced a master catalog of radial velocities for 504 genuine GCs in M31. We derived magnitudes for 483 out of 504 GCs in the master catalog from the CCD images used for our survey as described in Kim et al. (2007).
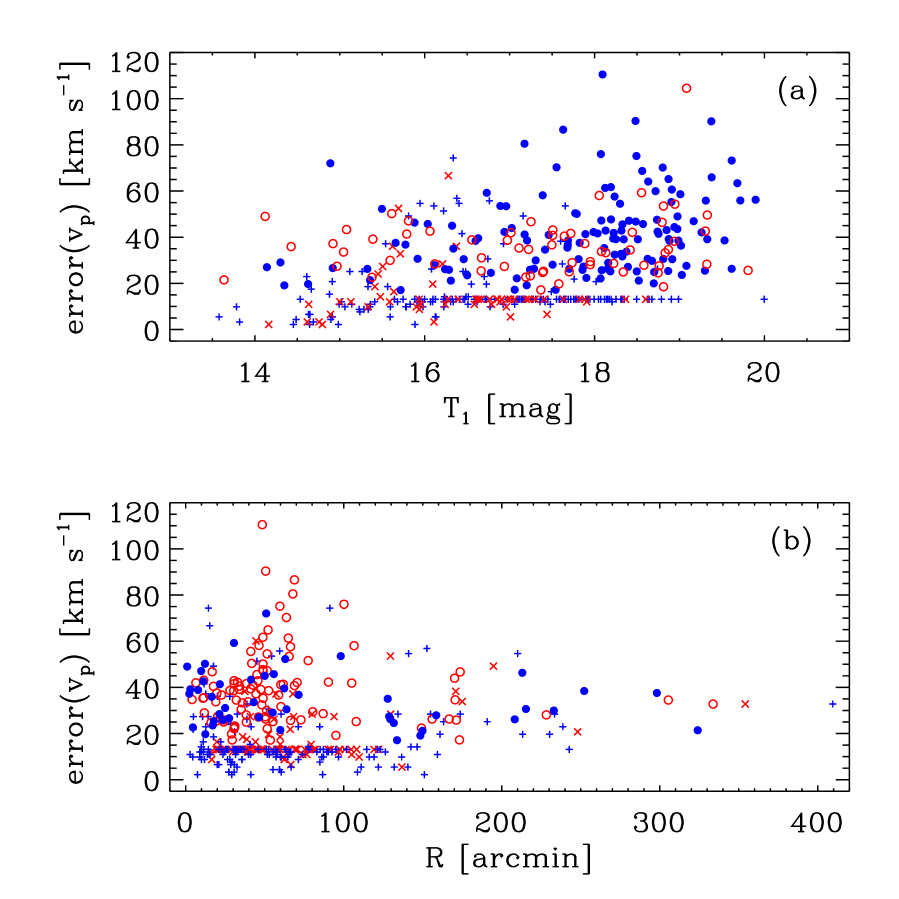
Figure 2 displays the errors of the measured velocities for the M31 GCs versus magnitude (a) and versus , a galactocentric radial distance corrected for the inclination of M31 using the equation where is the inclination angle, (b). In Figure 2(a), the errors for 136 metal-poor GCs and 63 metal-rich GCs derived in this study are plotted with those for 174 metal-poor GCs and 58 metal-rich GCs derived in the previous studies. In Figure 2(b), the errors for 46 bright GCs and 99 faint GCs derived in this study are plotted with those for 155 bright GCs and 104 faint GCs derived in the previous studies (Division of the entire sample of M31 GCs into subclasses depending on the metallicity and magnitude will be described in detail in the following section). Mean errors for the measured velocities are km s-1 for all 504 GCs, km s-1 for 211 GCs measured in this study, and km s-1 for 293 GCs measured in the previous studies. Mean errors for the measured velocities of the bright and faint GCs are km s-1 and km s-1 for 46 bright GCs and 99 faint GCs, respectively, measured in this study, and km s-1 and km s-1 for 155 bright GCs and 104 faint GCs, respectively, measured in the previous studies. In the case of the previous measurements, a significant fraction of the measurements for faint GCs have typical errors of 12 km s-1 given by Perrett et al. (2002), much smaller than the values in other studies, which leads to a smaller mean value for faint GCs. Excluding the data by Perrett et al. (2002), the mean errors are km s-1 and km s-1 for bright GCs and faint GCs, respectively. Figure 2 shows that the mean errors for the measured velocities increase as the GCs get fainter, and that they are larger in the inner region where the background level is higher than that in the outer region of M31.
The mean values of the radial velocities are derived using the biweight location of Beers et al. (1990): km s-1 for 211 GCs measured in this study, and km s-1 for all 504 GCs in the master catalog. These values are consistent with those in the previous studies ( km s-1 in Perrett et al. 2002 and km s-1 in Galleti et al. 2006) within the uncertainty, and are also compatible with the M31 systemic velocity measured in this study ( km s-1) and that in the literature ( km s-1 in de Vaucouleurs et al. 1991) within the uncertainty. The larger error in our estimate of the M31 systemic velocity is primarily due to the fact that we used, as templates, the spectra of GCs with small velocity dispersion to estimate the velocity of the nucleus of M31 that has much larger velocity dispersion.
Figure 3 shows the radial velocity histogram for all 504 GCs as well as 211 GCs measured in this study. It appears that the majority of all GCs are in the range km s-1 km s-1, and the velocity distribution for all GCs is roughly symmetric with respect to the mean value of the radial velocities. Interestingly, there is one GC with km s-1 measured in this study (ID 106 in Table 5 of Paper I). This GC is in the northern disk of M31 (Field 13 in Fig. 1 of Paper I), and has T1=18.94, CT1=1.83, and km s-1. Since the signal-to-noise ratio (S/N) of the spectrum for this GC is only 5 (measured using H and Fe5015 lines), a higher S/N spectrum is needed to verify its radial velocity and membership clearly.
The velocity dispersion derived using the biweight scale of Beers et al. (1990) is estimated to be km s-1 for 211 GCs measured in this study, and km s-1 for all 504 GCs in the master catalog. Both agree well within the errors.
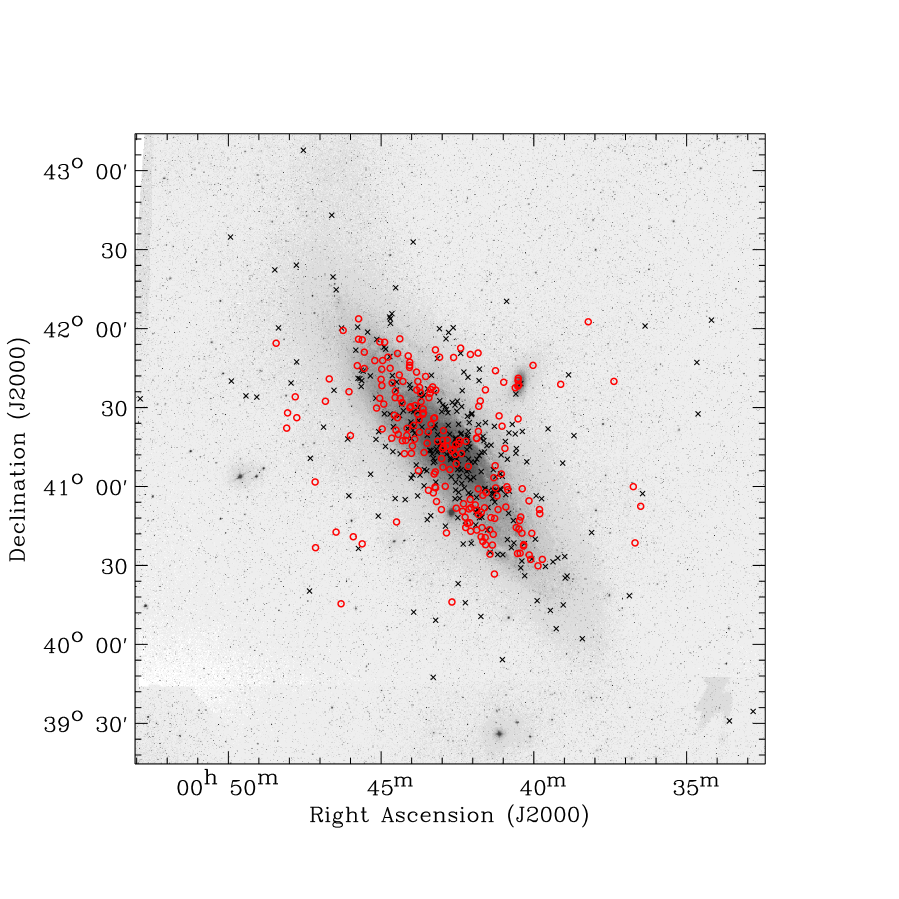
In Figure 4, we show the spatial distribution of 504 GCs with measured velocities overlaid on a optical image of M31 from the Digitized Sky Survey. The spatial distribution of 211 GCs measured in this study is globally similar to that of the 293 GCs measured in the literature. However, the GCs measured in this study are mainly located in the outer disk of M31 since the spectroscopic observation for the outer disk was done repeatedly (see Paper I for the configuration of the spectroscopic observations).
2.2 Subsamples
Metallicities of 199 GCs in M31 were derived from the line indices measured in the WIYN/Hydra spectra by Lee et al. (2007, in preparation, Paper III). We made subsamples based on the metallicities and magnitudes for 504 GCs in the master catalog for further analysis. We combined the metallicity data of 176 GCs in Barmby et al. (2000) and 194 GCs in Perrett et al. (2002) with our data of 199 GCs (Paper III) in order to include the metallicity data in the master catalog. There are 32 objects in common between this study and Barmby et al. (2000), and 34 objects in common between this study and Perrett et al. (2002). We have compared our metallicity measurements with those in these two previous studies for the common objects, as displayed in Figure 5. It shows that our measurements agree well with the published ones overall, while the scatter in the comparison between this study and Barmby et al. (2000) is smaller than that in the comparison between this study and Perrett et al. (2002). We also derive transformation relations between the measurement in this study, and those in Barmby et al. (2000) and in Perrett et al. (2002) using the GCs with small measurement errors,
| (6) |
| (7) |
The measured metallicities for the GCs in Barmby et al. (2000) and Perrett et al. (2002) were transformed into our metallicity system using equations (6) and (7), and the transformed metallicities were used for further analysis. We used our metallicity measurements for the common objects. Finally, we obtained metallicities for 431 GCs in total. The details of our metallicity data will be given in Paper III.
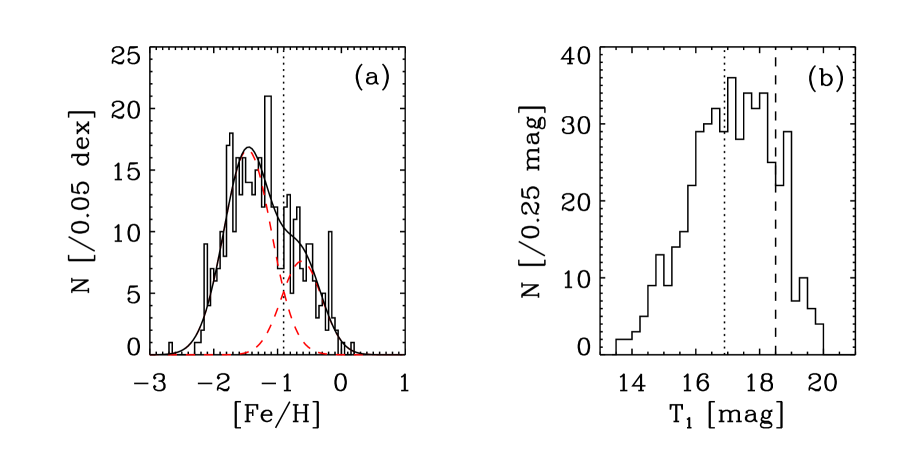
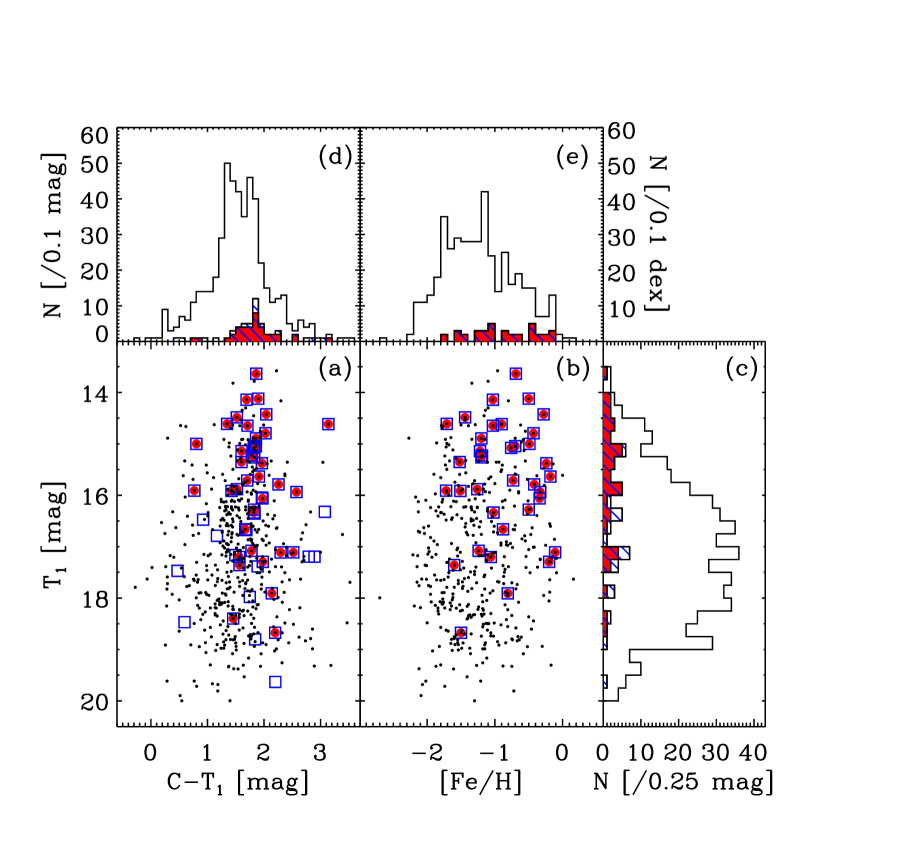
We present the metallicity distribution of M31 GCs in Figure 6(a). The KMM test based on the algorithm of Ashman et al. (1994) yields the result that the hypothesis that a unimodal distribution fits the data better rather than a bimodal distribution can be rejected at a confidence level of . The bimodal test results in the following two groups: the metal-poor ([Fe/H]) GCs () with a mean value of [Fe/H] () and the metal-rich ([Fe/H]) GCs () with a mean value of [Fe/H] (). The KMM test with a trimodal distribution also rejects the hypothesis of a unimodal metallicity distribution at a confidence level of . The trimodal test results in the following three groups: the metal-poor GCs ( GCs) with a mean value of [Fe/H] (), the intermediate metallicity GCs ( GCs) with a mean value of [Fe/H] (), and the metal-rich GCs ( GCs) with a mean value of [Fe/H] (). Although there is no reason to reject the trimodal metallicity distribution for M31 GCs (to be discussed in detail in Paper III), we use the two subsamples of metal-poor and metal-rich GCs from the bimodal distribution to increase the number of GCs per subsample for kinematic analysis in this study.
We derived the mean values of the radial velocities: km s-1 for 310 metal-poor GCs, and km s-1 for 121 metal-rich GCs. The value for the metal-poor GCs is consistent with that for the entire 504 GC sample ( km s-1), but the value for the metal-rich GCs is significantly smaller than that for the metal-poor GCs, which was seen earlier in Perrett et al. (2002).
For the velocity dispersion, we found that the dispersion for the metal-poor GCs ( km s-1) is significantly larger than that of the metal-rich GCs ( km s-1). This is in contrast with the result of Perrett et al. (2002) that the dispersions for the metal-poor and metal-rich GCs agree within the quoted errors ( km s-1 for the metal-poor GCs and km s-1 for the metal-rich GCs). We find that this difference may be due to the fact that the sample used by Perrett et al. (2002) was derived mainly from the disk of M31, while ours are based on a much wider area, including a larger fraction of probable halo GCs.
The luminosity function for M31 GCs is shown in Figure 6 (b). We used only 483 GCs for which magnitudes are available in our photometric catalog of M31 survey. Since the survey depth is not uniform across the galaxy due to varying background of stellar light, we use only the GCs brighter than to make subsamples based on magnitudes. Finally, we divide the GCs into 201 bright () and 203 faint () GCs so that the number of GCs in each subsample is similar.
3 Results
Using the master catalog of 504 GCs in M31, we have investigated the kinematic properties of the M31 GC system for several cases of subsamples: all GCs, metal-poor and metal rich GCs, bright and faint GCs, and X-ray emitting GCs. Primary results of the kinematics of the M31 GC system derived in this study are summarized in Table 1.
3.1 All GCs
3.1.1 Kinematic Properties
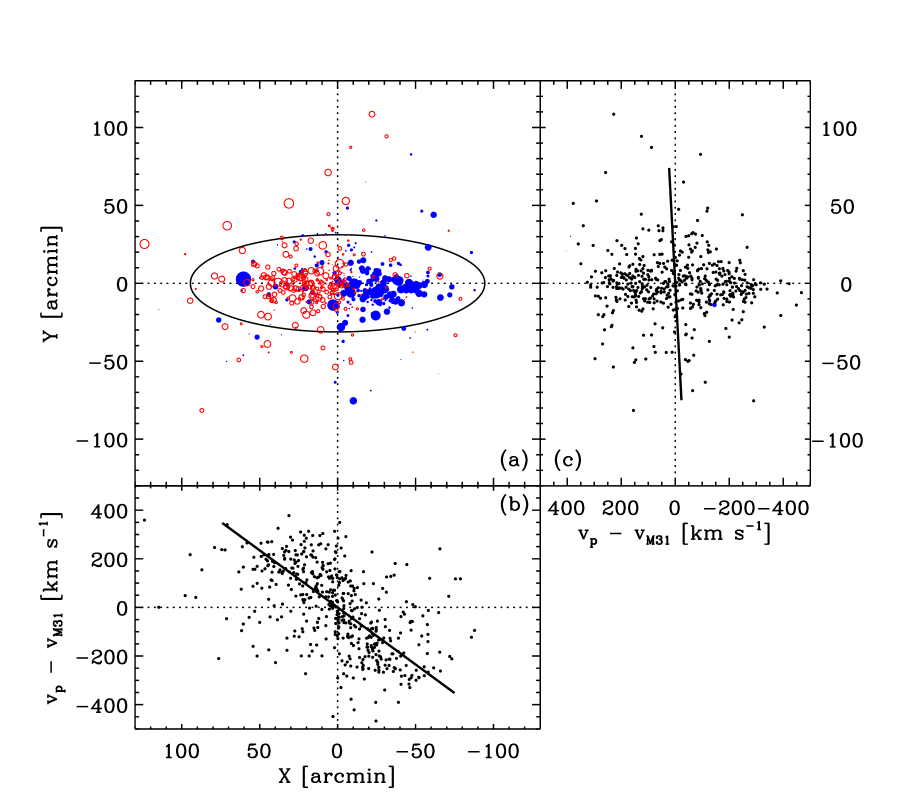
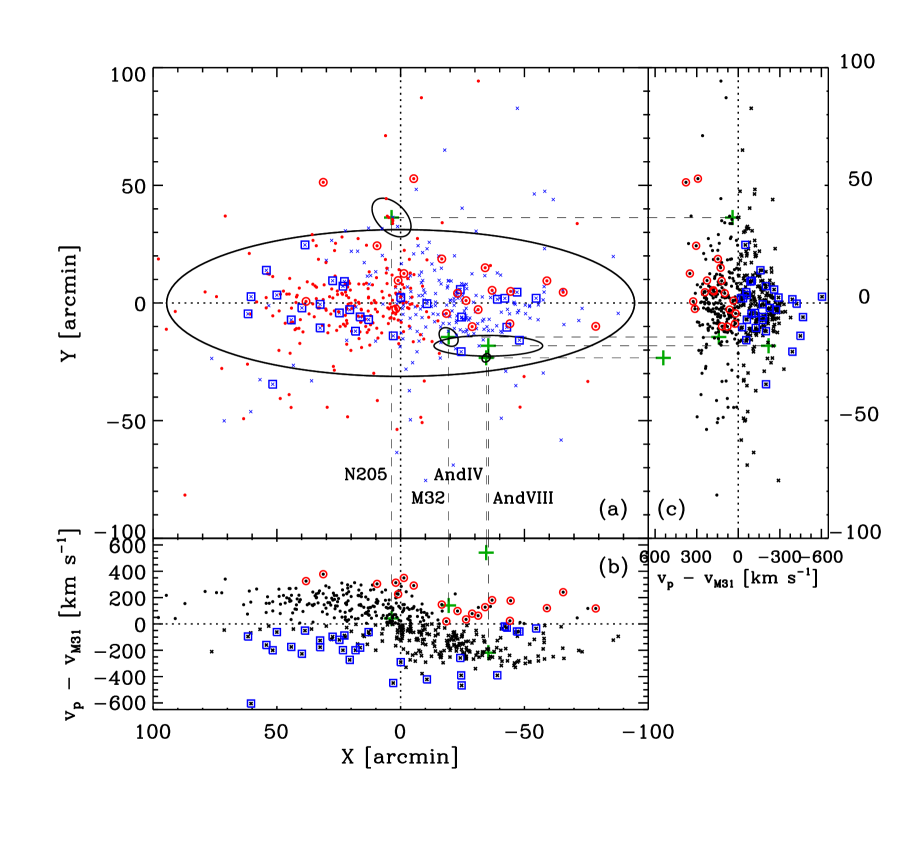
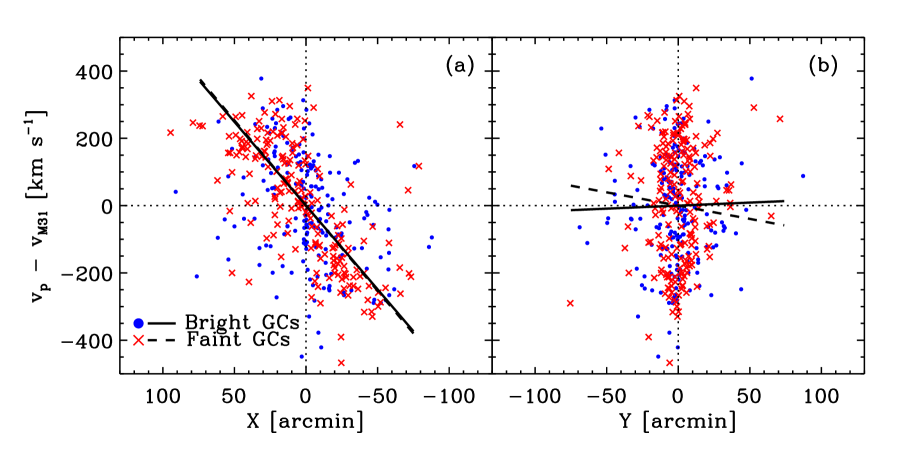
In Figure 7, we present the spatial distribution of M31 GCs with the measured velocity. Here we adopted as the systemic velocity of M31 the value derived for all GCs in the previous section, km s-1. Figure 7 shows clearly a rotation signature. The receding GCs, with velocities greater than the systemic velocity of M31, and the approaching GCs, with velocities less than the systemic velocity of M31, are spatially separated effectively by the minor axis, indicating a disk rotation. Interestingly, there are some GCs showing a retrograde rotation (filled circles at and open circles at ) that will be discussed in §3.1.2. We present the radial velocities for M31 GCs versus the projected radii along the major axis (X) and along the minor axis (Y) in Figure 7 (b) and (c), respectively. A linear least-squares fit, passing through , along the major axis results in km s-1 and km s-1, where and are units of arcmin. The large value of the slope between and indicates a strong rotation of the M31 GC system around the minor axis, while the small value of the slope between and indicates no significant rotation around the major axis.
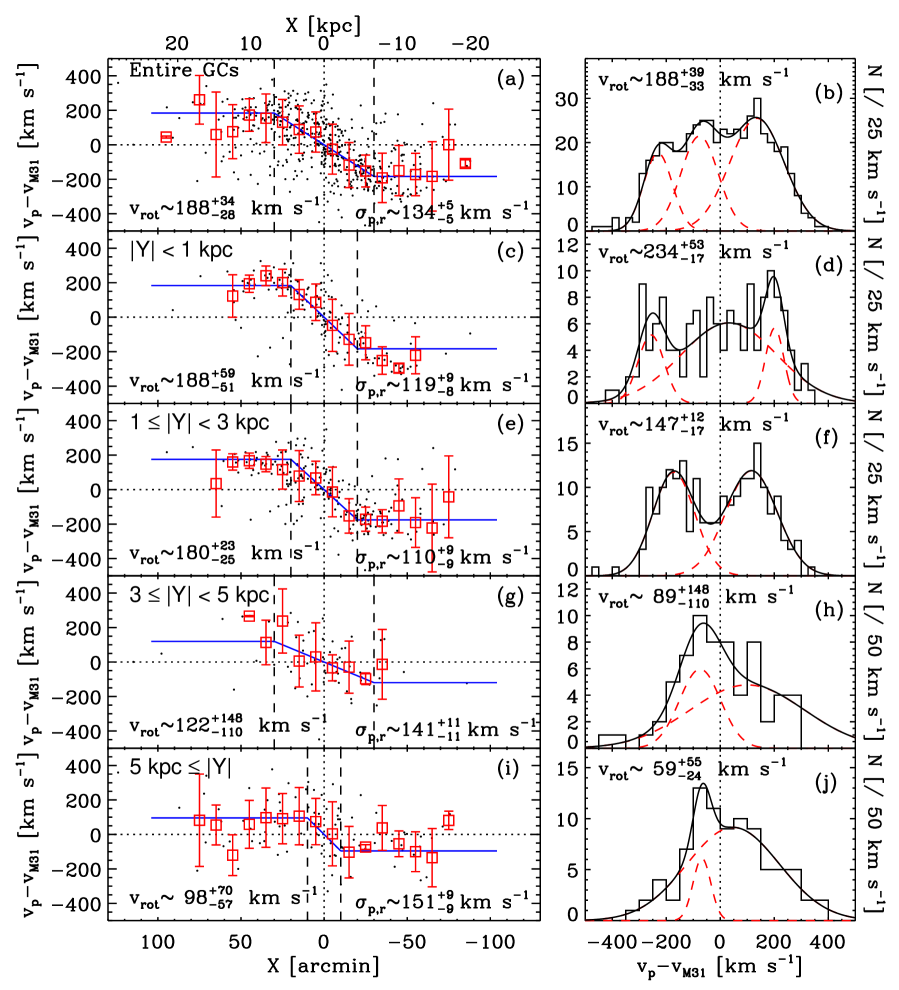
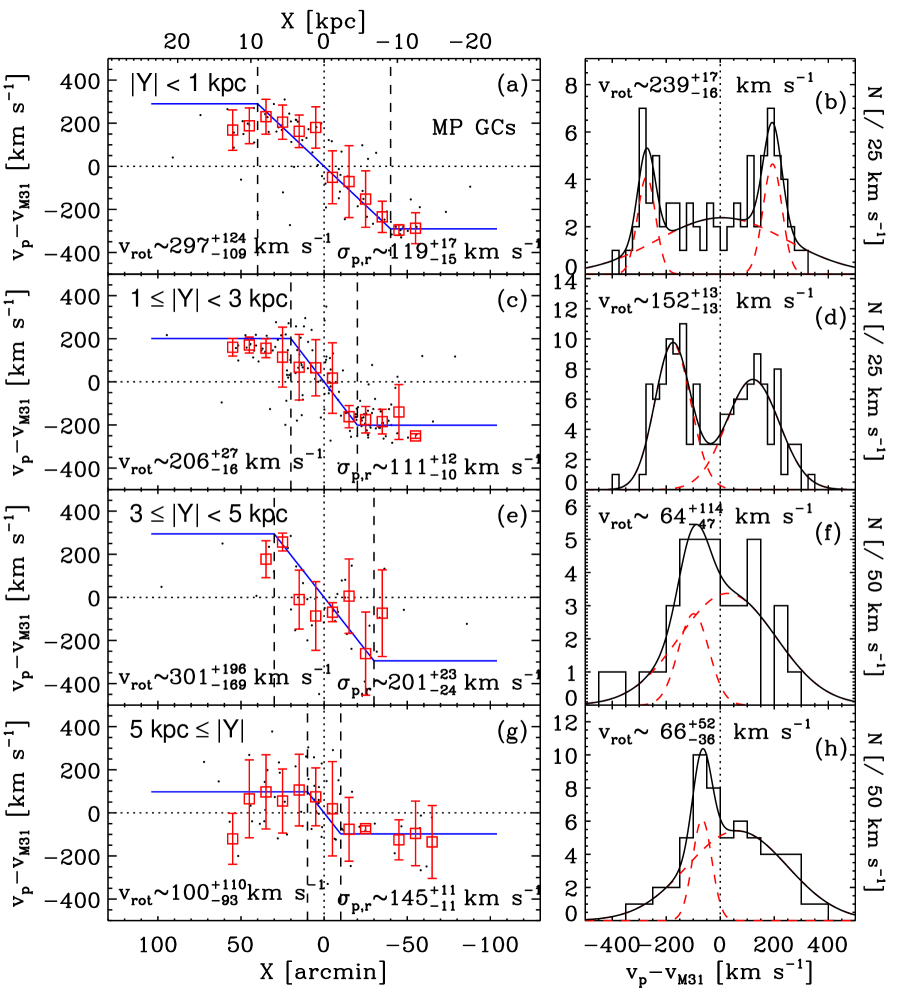
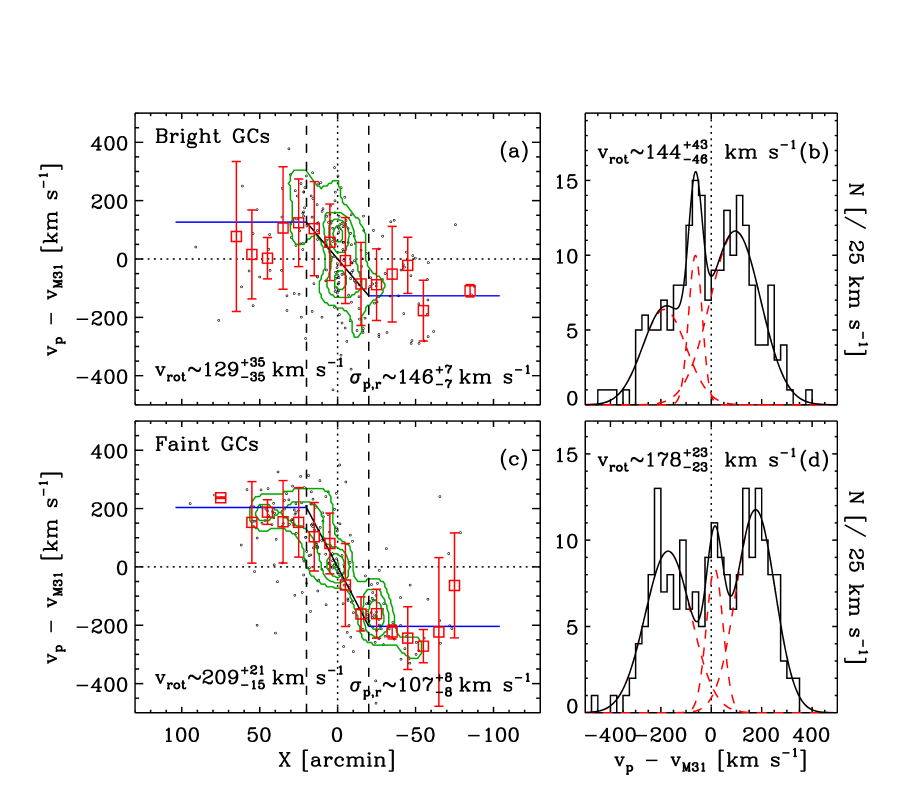
In Figure 8, we present the radial velocities of GCs as a function of the projected distance along the major axis of M31 and the velocity histogram of the GCs for the samples of different distance bins along the minor axis in order to investigate any rotational variation along the minor axis. The mean radial velocity in a distance bin of 10 is overlaid by a large square with an errorbar representing the velocity dispersion. We fit the mean radial velocities with a straight line representing a solid-body rotation for the inner region. We select the appropriate boundary that gives the minimum value by moving the fitting boundary from 10 to 50 symmetrically. Then, a flat rotation curve is connected to the solid-body rotation curve at that radius. The rotation amplitude that is inclination-corrected, is estimated by one-half of the velocity difference between the flat rotation curves. We also estimate the rotation amplitude using the velocity histogram for M31 GCs. We fit the observed velocity histogram using the sum of two or three Gaussian functions. Then, the rotation amplitude is represented by one-half of the velocity difference between the two Gaussian peaks - one is the largest positive value and the other is the smallest negative value. We derive finally the rotation velocity corrected for inclination, where represents a projected rotation velocity. The rotation amplitude of all GCs in M31 estimated by fitting the rotation curve is km s-1, while that from the velocity histogram is km s-1. These two values agree very well. The uncertainties on these (and following) estimates represent 68% (1 ) confidence intervals. We computed the uncertainties using 1000 artificial data sets constructed by randomly choosing GCs up to the number of GCs in the real data. The fitting procedure is performed on the 1000 trial data sets, the results are sorted, and the values corresponding to the 16th and 84th percentiles are identified. The uncertainties are defined as the offsets between these values and the values computed using the real data. We have also derived the rotation-corrected velocity dispersion of the all GC sample, that is, the dispersion about the rotation curve shown in Figure 8: km s-1.
The velocity histogram for the thin disk kpc (d) shows not only two rotation peaks but also a velocity dispersion peak due to the central bulge of M31. The rotation amplitudes decrease as the distance along the minor axis of M31 increases. Interestingly, the rotation amplitude is not zero even for the outermost samples at kpc, although the small size of the sample for outer GCs leads to a large uncertainty (Figure 8 (i) and (j)).
This result indicates that the halo (or extended bulge) of M31 may be not totally pressure-supported but is rotating as well. This result is consistent with the idea that the M31 halo is dominated by a moderately rotating large bulge rather than by a non-rotating halo far from the plane, which is based on the kinematics of PNe in M31 (Hurley-Keller et al., 2004). However, this does not necessarily indicate that there is no classical halo in M31 (see Irwin et al. (2005); Kalirai et al. (2006)), as discussed in the next section.
On the other hand, the rotation-corrected velocity dispersion of the GCs increases from km s-1 at kpc to km s-1 at kpc. Thus the velocity dispersion becomes about twice as large as the nominal rotation amplitude at kpc, showing that pressure support is much larger than rotation support in the outer halo.
3.1.2 Friendless GCs
Although the GC system in M31 is dominated by disk rotation, there are also seen some GCs that do not follow the disk rotation. To identify the GCs that do not follow the disk rotation, we select ‘friendless’ GCs adopting the method used for the study of the kinematics of M31 PNe in Merrett et al. (2003).
In summary, we select the friendless GCs that deviate from the mean velocity of neighbor GCs on the sky more than , where is the velocity dispersion of neighbor GCs. The number of GCs that defines the local environment is taken to be , and is used in this study. Among all 504 GCs, we find 50 friendless GCs. The spatial distribution of the friendless GCs is shown in Figure 9. It is seen that they are located mostly in the disk. However, most of them are located in the quadrants of retro-grade rotation (the first and third) in the versus diagram. The friendless GCs in the second and fourth quadrants have mostly velocities larger than the largest velocities of the GCs following the major disk rotation. These friendless GCs may have different origin from the main population of GCs following disk rotation.
To highlight the kinematics of the friendless GCs, we plot, in Figure 10, the spatial distribution of only the friendless GCs with the symbol size scaled according to their velocity deviations from the systemic velocity of M31. Interestingly, it appears that the friendless GCs rotate around the major axis of M31 unlike the rotation around the minor axis for the disk population.
Merrett et al. (2003) suggested that the friendless PNe in their sample may link to the Southern Stream and the Northern Spur since the positions and velocities of the friendless PNe are consistent with the two streams. Recently, other stellar substructures in M31 were found by several authors (Ferguson et al., 2002; McConnachie et al., 2004; Fardal et al., 2006b). Since the kinematic information on stellar substructures in M31 is available, it would be interesting to compare the kinematics of the friendless GCs with those of stellar substructures, which may provide a clue to understand the motion and origin of the friendless GCs, but it is beyond the scope of this paper.
In Figure 11, we show the photometric properties of magnitudes and () colors, and spectroscopic metallicities for the friendless GCs. The friendless GCs have a mean magnitude of mag with a deviation of mag, which is similar to the values of mag with a deviation of mag for the normal GCs. The mean metallicities are also similar between the friendless and normal GCs, but the mean () color for the friendless GCs ( mag with ) is slightly redder than that for the normal GCs ( mag with ). We used a Kolmogorov-Smirnov (KS) test to determine whether the friendless and normal GC populations were drawn from the same distribution. The hypothesis that the two distributions are extracted from the same parent population can be rejected at the confidence level of for the magnitude distribution, for () color distribution, and for the metallicity distribution. Therefore, only magnitudes and () colors appear to be slightly different. However, this problem needs to be investigated further using the reddening-corrected magnitudes and colors.
3.2 Metal-Poor and Metal-Rich GCs
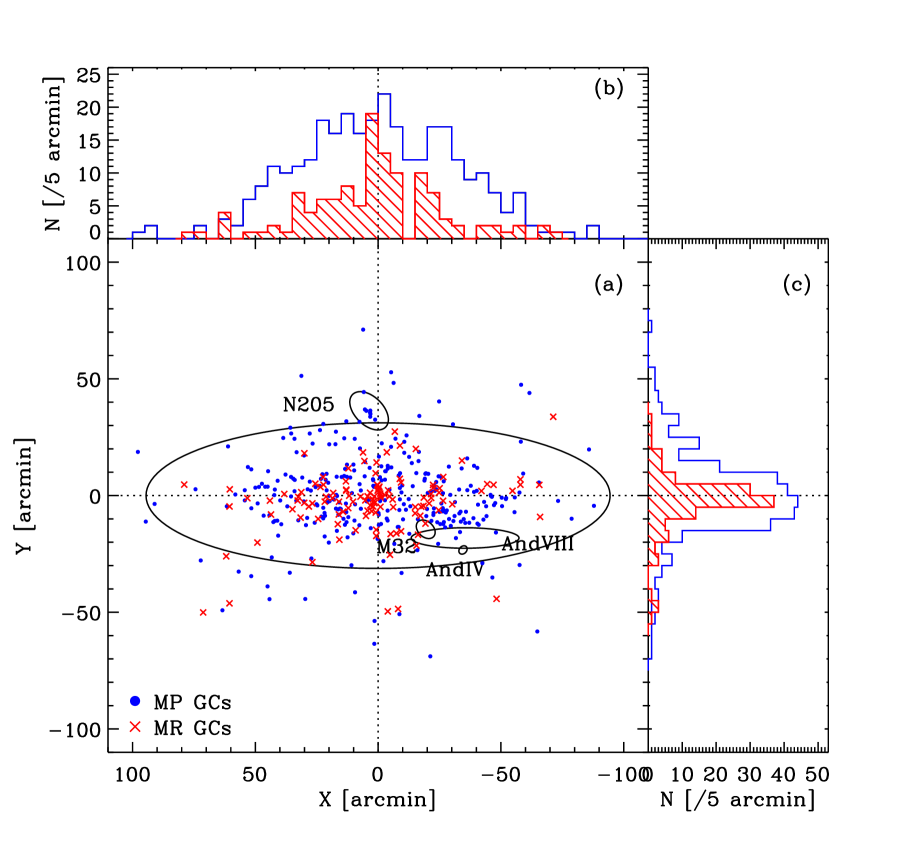
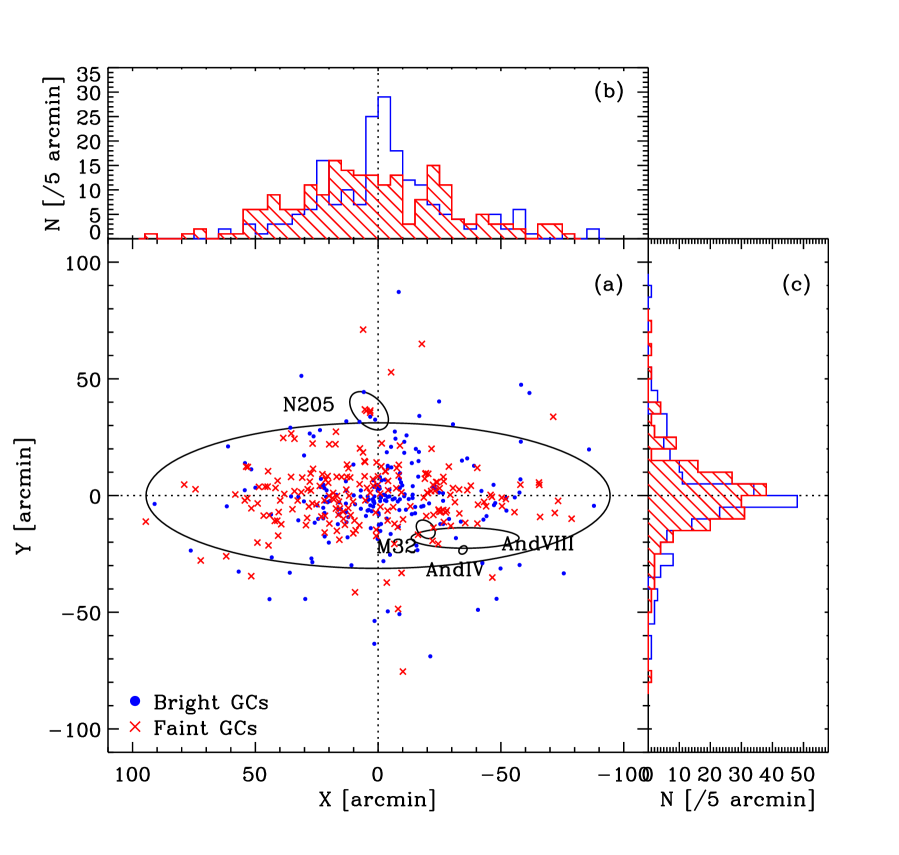
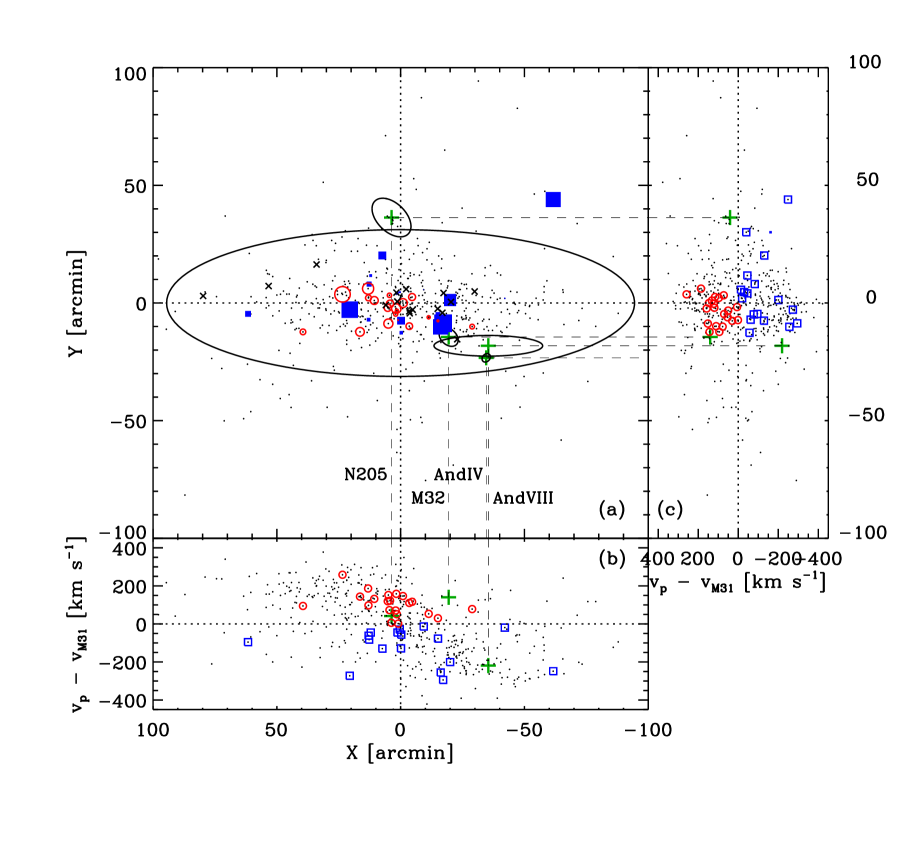
Figure 12 shows the spatial and radial distributions of the 310 metal-poor and 121 metal-rich GCs. The most striking difference in the radial distribution between the two subpopulations is that the metal-rich GCs show a much stronger central concentration than the metal-poor GCs, which is consistent with the results based on the smaller data set in Huchra et al. (1991) and Perrett et al. (2002). In particular the radial distribution of the metal-rich GCs show a very narrow peak with a half width of about 10 arcmin, showing that they belong to the central bulge of M31. Median values of the absolute distances along the major axis for the metal-poor and metal-rich GCs are and , respectively, and those along the minor axis for the metal-poor and metal-rich GCs are and , respectively. In addition, a small number of metal-rich GCs are found in the outer region, even at about from the major axis. There are 9 GCs within the boundary of the standard diameter in NGC 205. All of these GCs are metal-poor, as found by earlier studies (Perrett et al., 2003).
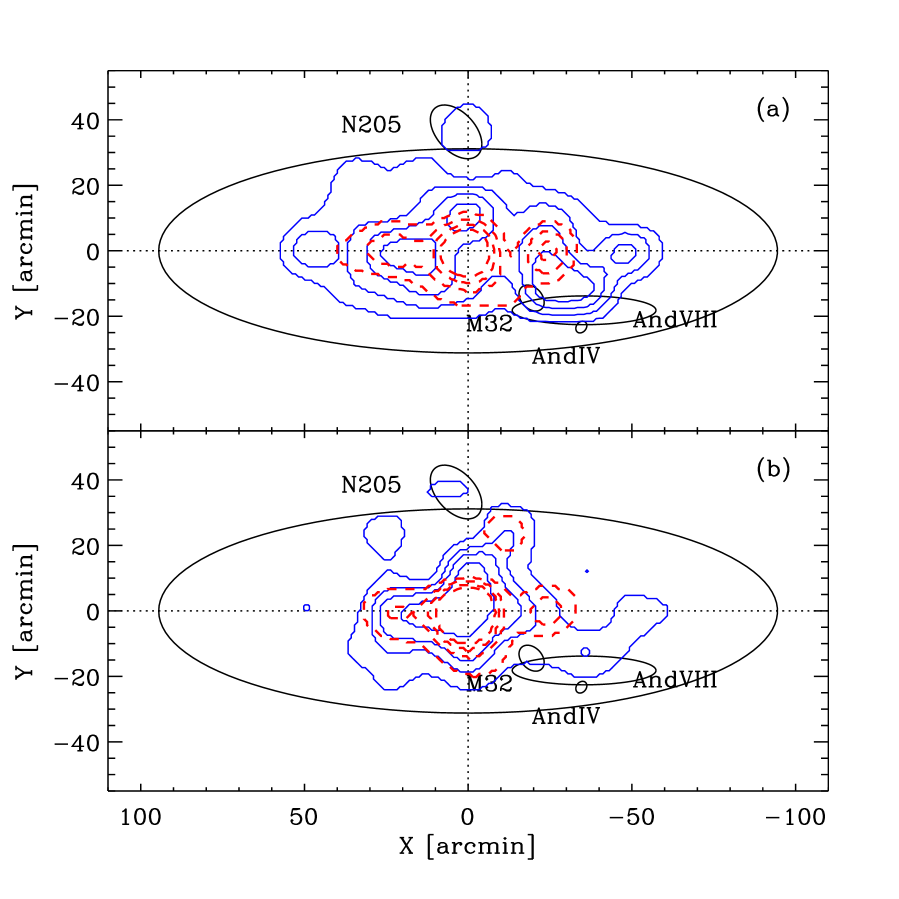
To highlight the difference in spatial distribution between the metal-poor and metal-rich GCs, we plot, in Figure 13, the number density contours for the metallicity subsamples. Several features are noted in Figure 13. First, the spatial distribution of the metal-rich GCs shows a much stronger central concentration than that of the metal-poor GCs, as seen before. Second, the spatial distribution of the metal-rich GCs shows almost circular structure in the central region of M31, while that of the metal-poor GCs shows an extended structure elongated along the major axis with a similar ellipticity to that of the M31 disk. This difference is less clearly seen in the sample of bright GCs (). Third, there are several substructures in both subpopulations. The most notable metal-poor substructures are one in the region and , and one in the region and . These two correspond to the GC groups IDs 10 and 11, respectively, in Perrett et al. (2003). These are close to, but not consistent with, the position of And VIII. One metal-rich GC and four metal-poor GCs are found within the standard diameter of And VIII. The substructure of metal-poor GCs in NGC 205 corresponds to the GC group ID 5 in Perrett et al. (2003). Two notable substructures among the metal-rich GCs are on the major axis: one at and the other at . These correspond, respectively, to the GC group ID 8 and the sum of IDs 2 and 3, respectively, in Perrett et al. (2003). One substructure containing both metal-poor GCs and metal-rich GCs at and (seen only in the bright GCs) corresponds to the GC group ID 7 in Perrett et al. (2003). Therefore most of the GC groups in Perrett et al. (2003) are confirmed in this study.
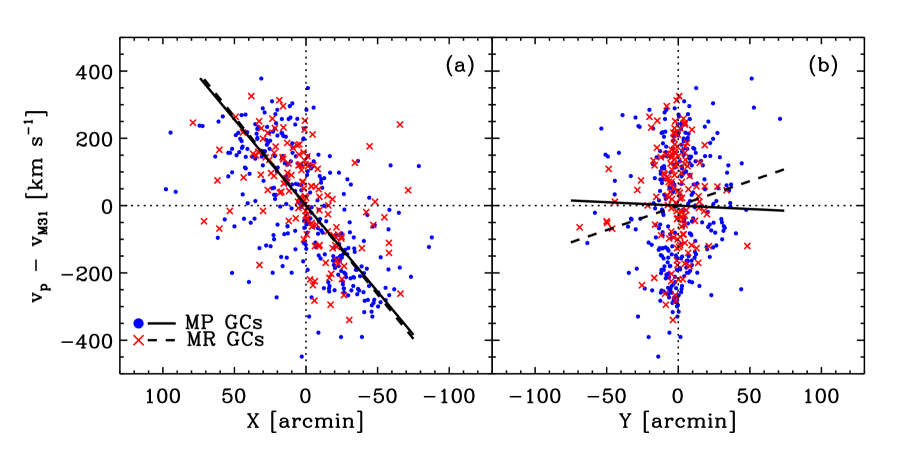
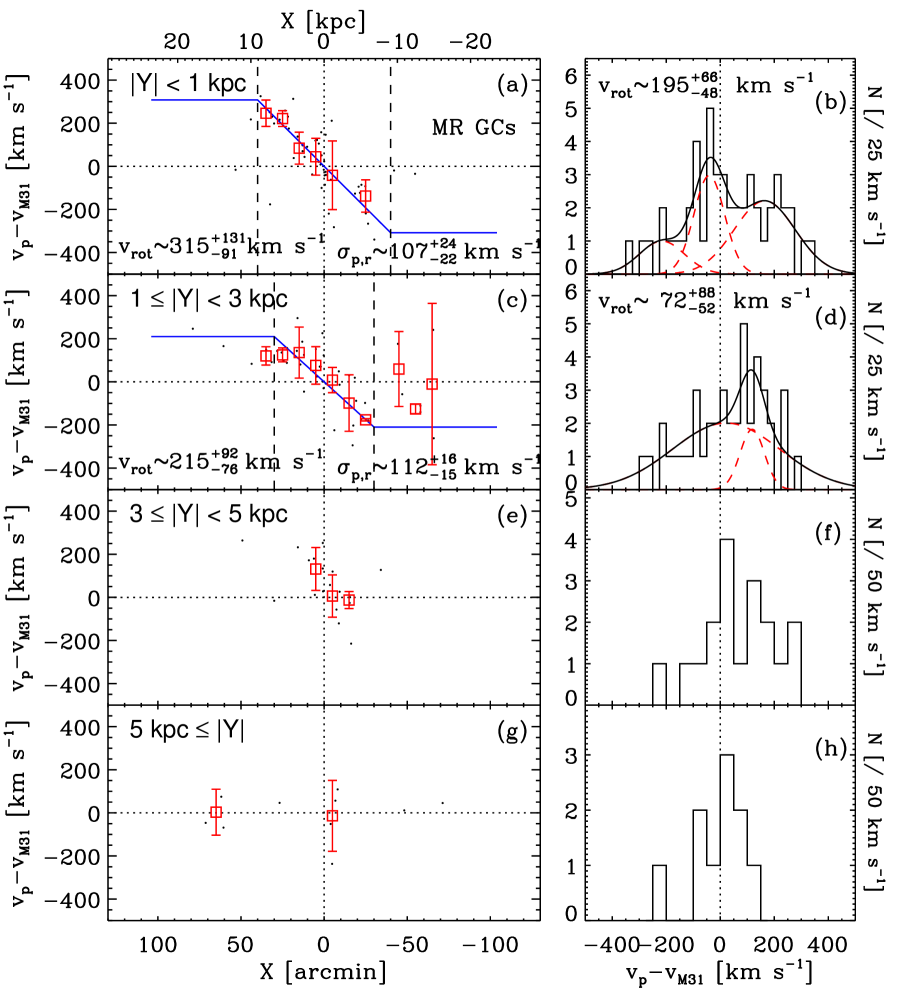
In Figure 14, we present the radial velocities for the metal-poor and metal-rich GCs versus the projected radii along the major axis (X) and the minor axis (Y). A linear least-squares fit, passing through , along the major axis results in km s-1 for the metal-poor GCs and km s-1 for the metal-rich GCs. A least-squares fit along the minor axis results in km s-1 for the metal-poor GCs and km s-1 for the metal-rich GCs. As known previously, both the metal-poor and metal-rich GCs show a strong and very similar rotation around the minor axis and no or a weak rotation around the major axis. The kinematic difference between the two subsamples is not significant at this stage.
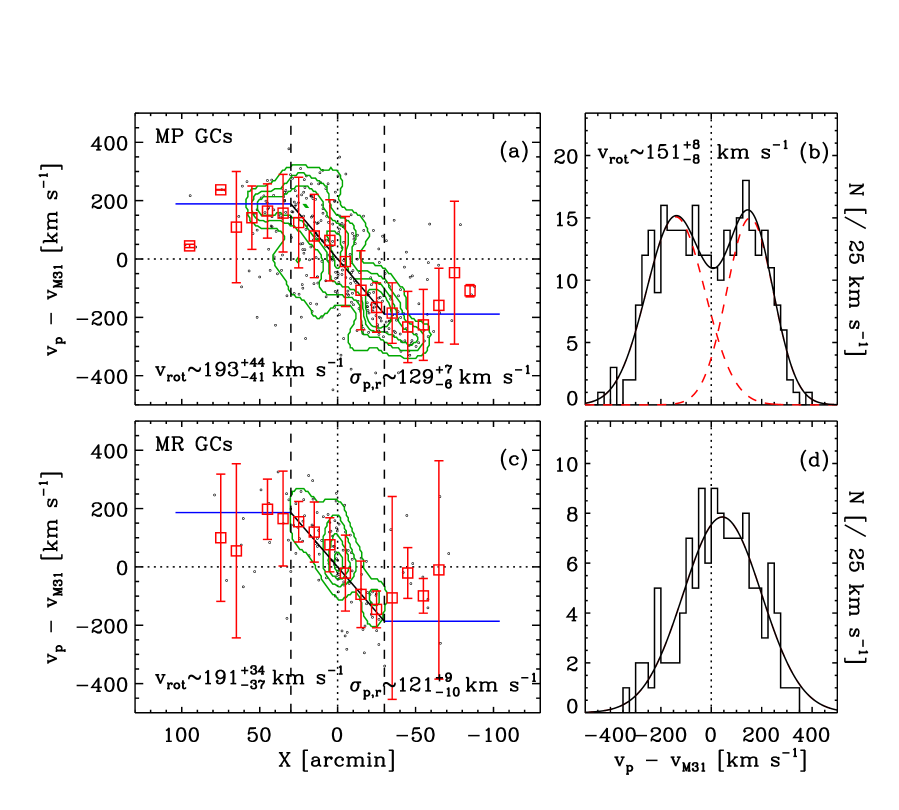
To investigate any kinematic difference between the two subsamples in detail, we plot, in Figure 15, the radial velocities for the metal-poor and metal-rich GCs as a function of the projected distance along the major axis of M31 and the velocity histograms. We also plot the mean radial velocities of the GCs in a distance bin of along the major axis. We estimate the rotation amplitudes for the two subsamples using the same fitting procedure applied in Figure 8. The rotation amplitude estimated by fitting the rotation curves (left panels) shows that the rotation of the metal-rich GCs ( km s-1) is indistinguishable from that of the metal-poor GCs ( km s-1). However, Perrett et al. (2002) found that the rotation of the metal-rich GCs ( km s-1) is slightly stronger than that of the metal-poor GCs ( km s-1).
It is worth noting that the rotation curve in the metal-poor GCs is asymmetric at arcmin. The metal-poor GCs at arcmin follow a solid-body rotation, while those at arcmin do not. Since the distribution of the metal-poor GCs is more extended than the metal-rich GCs, the asymmetric rotation curve is seen only for the metal-poor GCs. Contours in Figure 15 show clearly this asymmetry at where the mean radial velocities are larger than the opposite end (at ). Note also that there is a significant substructure at with km s-1, found in a wide-field survey. This corresponds to the most notable metal-poor substructure described above. Therefore these substructures are distinguishable not only in spatial distribution but also in kinematics. This substructure may be related with the Southern Stream emanating from the southwest disk of M31 found in a wide field survey of red giants by Ibata et al. (2001).
In addition, we derived the rotation amplitude from the velocity histogram of the metal-poor GCs (panel (b)). The rotation amplitude of the metal-poor GCs is estimated to be km s-1, which is slightly smaller than, but agrees within the error to, the value derived from the vs diagram above. The velocity histogram of the metal-rich GCs shows a single strong peak, showing that the sample is dominated by the GCs in the central bulge. So we did not try to derive a rotation velocity for the metal-rich GCs from the velocity histogram. We have derived the rotation-corrected velocity dispersions: km s-1 for the metal-poor GCs, and km s-1 for the metal-rich GCs. Thus the rotation-corrected velocity dispersion for the metal-poor GCs is very similar to that for the metal-rich GCs.
In Figures 16 and 17, we also present the radial velocities of the metal-poor and metal-rich GCs as a function of the projected distance along the major axis of M31 and the velocity histogram of the GCs for the samples of different distance bins along the minor axis in order to investigate the rotational variation along the minor axis. The metal-poor GCs show that the rotation velocity is roughly decreasing with increasing distance from the major axis, but the uncertainties are too large to derive a reliable rotational velocity for the outer region at kpc. The metal-rich GCs show a similar trend to that of the metal-poor GCs at kpc, but they suffer more from the small number statistics problem.
The rotation-corrected velocity dispersion of the metal-poor GCs increases from km s-1 at kpc to km s-1 at kpc. Thus the velocity dispersion becomes about twice as large as the rotation amplitude at kpc, showing that pressure support is much larger than rotation support in the outer halo of M31.
3.3 Bright and Faint GCs
In Figure 18, we show the spatial distribution of the bright and faint GCs. It is seen that the bright GCs are more centrally concentrated than the faint GCs. Median values of the absolute distances along the major axis for the 201 bright and 203 faint GCs are and , respectively, and those along the minor axis for the bright and faint GCs are and , respectively. Thus, the difference between the two subsamples in the spatial distribution along the major axis is significant, while that along the minor axis is not. This is mainly due to the fact that a significant fraction of bright GCs are located in the central bulge of M31 and that a large number of faint GCs in the central region of M31 were not detected in the current surveys.
We present the radial velocities of the bright and faint GCs versus the projected radii along the major axis (X) and along the minor axis (Y) in Figure 19. The linear least-squares fits, passing through , along the major axis result in km s-1 for the bright GCs and km s-1 for the faint GCs. The least-squares fit along the minor axis results in km s-1 for the bright GCs and km s-1 for the faint GCs. Both the bright and faint GCs show a strong rotation around the minor axis and no or weak rotation around the major axis. The kinematic difference between the two subsamples is not significant.
We also plot the radial velocities for the bright and faint GCs as a function of the projected distance along the major axis of M31 and the velocity histograms in Figure 20. We estimate the rotation amplitudes for the two subsamples using the same fitting procedure applied in Figure 8. The rotation amplitudes estimated by fitting the rotation curves (left panels) show that the rotation of the faint GCs ( km s-1) is stronger than that of the bright GCs ( km s-1). In addition, the rotation amplitude from the velocity histogram shows again that the rotation of the faint GCs ( km s-1) is stronger than that of the bright GCs ( km s-1). The difference in rotation amplitudes between the bright and faint GCs is closely related to the difference in their spatial distributions. Since the faint GCs are more extended along the major axis than the bright GCs, the rotation amplitude of the faint GCs is estimated to be larger than that of the bright GCs. It is noted that the rotation-corrected velocity dispersion for the bright GCs, km s-1 is much larger than that for the faint GCs, km s-1.
3.4 GCs with X-ray detection
To investigate the kinematic properties of X-ray emitting GCs in M31, we cross-correlated the GCs and GC candidates from the optical survey with the X-ray sources in M31. We used as the optical source list, the catalog of 1778 GC candidates prepared combining our survey, RBC2, Huxor et al. (2005) and Mackey et al. (2007).
We made a master catalog of X-ray sources in M31 by combining 560 sources in the ROSAT survey (Supper et al., 2001), 204 sources in the Chandra survey (Kong et al., 2002), 856 sources in the XMM-Newton survey (Pietsch et al., 2005), and 62 X-ray emitting GCs in Fan et al. (2005). If a GC candidate in the optical survey lies within a circle of positional uncertainty of an X-ray source, we regard it as a match. We used positional uncertainty for the ROSAT sources due to its large positional uncertainty (548 arcsec of with a median value of 7 arcsec). In addition, we matched optical GC candidates with 62 X-ray emitting GCs in Fan et al. (2005) using the identification of GCs, since Fan et al. (2005) presented only a catalog of X-ray emitting GCs.
Finally, we identify 56 GCs and GC candidates (classes 1 and 2 in Paper I and RBC2) with X-ray detections (40 genuine GCs including 39 GCs with measured velocities, and 16 GC candidates). There are 13 GCs that were identified as X-ray emitting GCs in Fan et al. (2005), but were not included in our combined optical GC catalog. Therefore, we increase the number of X-ray emitting GCs in M31 by 69, including 13 GCs that were not presented in our GC catalog. For further kinematic analysis, we use only the homogeneous data set of 56 X-ray emitting GCs and GC candidates presented in our optical GC catalog.
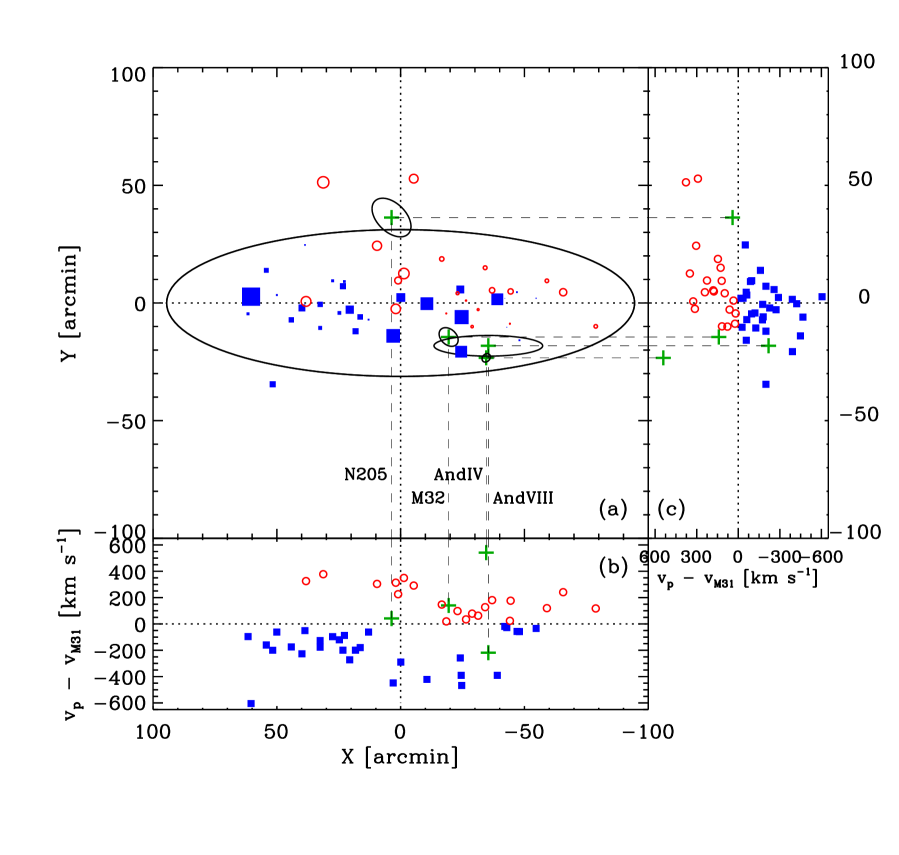
We show, in Figure 21, the spatial distribution of 39 genuine GCs with X-ray detection and measured velocity in company with 1 GC and 16 GC candidates with X-ray detection but no measured velocity. It is difficult to make strong conclusions about the spatial distribution of the X-ray emitting GCs since the X-ray surveys did not uniformly cover the whole region in M31. However, it is clearly seen that a large number of the X-ray emitting GCs are located in the central bulge region of M31 and that they show a large velocity dispersion. In addition, it appears that the majority of X-ray emitting GCs follow the disk rotation of M31.
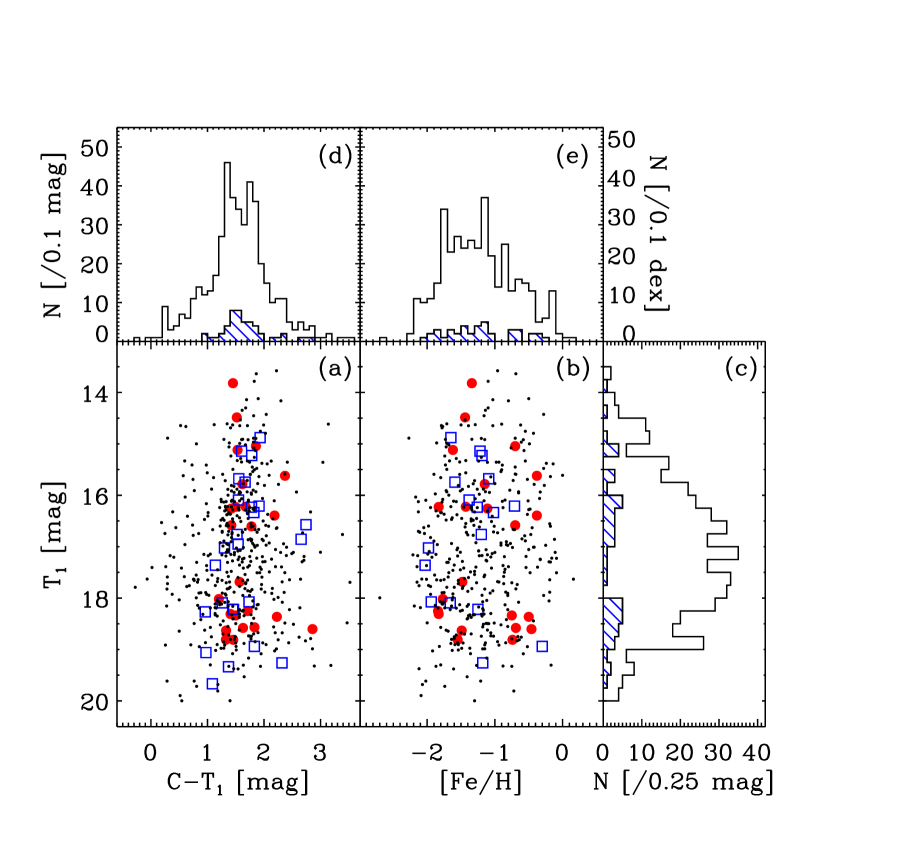
In Figure 22, we show the photometric properties of the X-ray emitting GCs compared with that of all 504 GCs. We used the KS test to determine whether the X-ray emitting and the entire GC population were drawn from the same distribution. Interestingly, the hypothesis that the two distributions are extracted from the same parent population can be rejected at the confidence level of for the distribution of magnitude, () color, and the metallicity. This result based on the analysis of the expanded sample of M31 X-ray emitting GCs confirms the previous results (Bellazzini et al., 1995; Di Stefano et al., 2002; Trudolyubov & Priedhorsky, 2004; Fan et al., 2005). The properties of X-ray emitting GCs in M31 are consistent with those of GCs in early-type galaxies: redder, more metal-rich, and brighter GCs are more likely to be detected as X-ray emitting GCs (Sarazin et al., 2003; Kim et al., 2006; Sivakoff et al., 2006).
3.5 Rotation Curve
Rotation curves are useful for inferring the amount and distribution of underlying dark matter in galaxies (e.g., Sofue & Rubin 2001). For M31, there are several studies to derive the rotation curve using various tracers: HII regions (Rubin & Ford, 1970; Kent, 1989), HI (Braun, 1991; Carignan et al., 2006, 2007), CO (Loinard et al., 1995), PNe (Merrett et al., 2006), and GCs (Perrett et al., 2002).
To obtain the rotation curve of M31 using the sample of 504 GCs in this study, we first selected 454 GCs following the M31 disk rotation by rejecting 50 friendless GCs defined in §3.1.2. Then, we selected 75 GCs with and kpc that are dominated by the rotational motion, since the inclination of M31 to the line of sight is as high as .
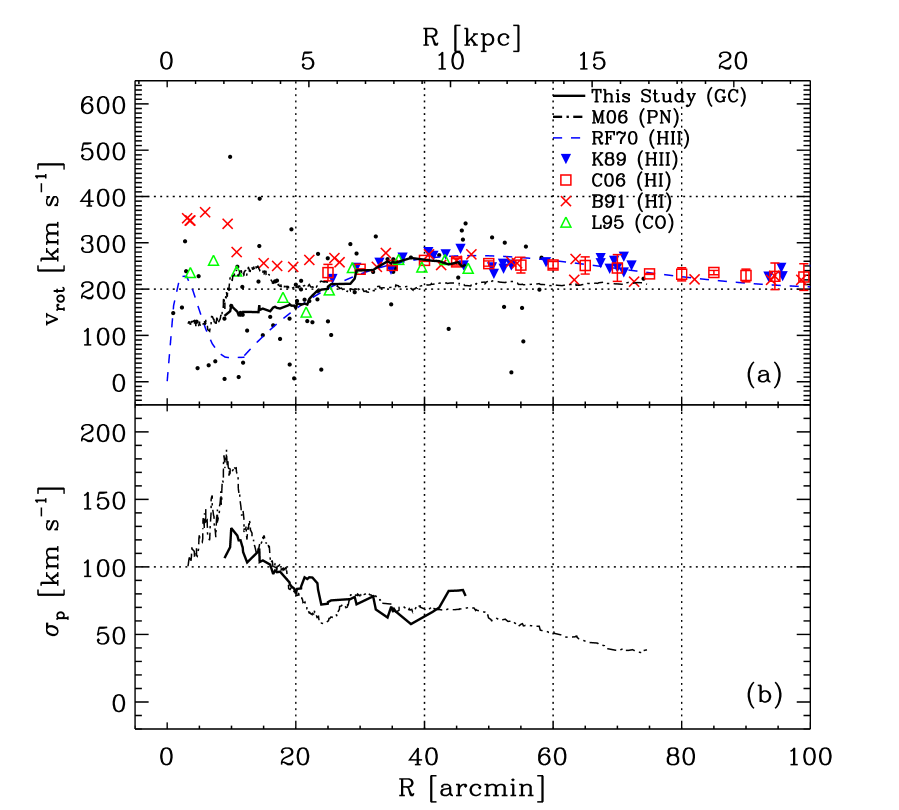
We display the rotation curve using the selected GCs in Figure 23. We plot the rotation velocity corrected for inclination, , where is the projected distance along the major axis of M31 and is the deprojected radius in the plane of the disk, . For each GC, we use the nearest 21 GCs to estimate the mean velocity, taken as the rotation velocity at that radius, and to estimate the velocity dispersion. We stop the calculation when the number of the nearest GCs is less than 21 ( and ). Typical 1 uncertainties using the bootstrap procedure for the rotation velocity and for the dispersion are 12 km s-1 and 8 km s-1, respectively. For comparison, we derive also the rotation curve of PNe using the velocity data in Merrett et al. (2006) by applying the same procedure as above. For PNe, typical 1 uncertainties for the rotation velocity and for the dispersion are both 4 km s-1.
It appears that the rotation curve of the GCs in this study agrees well with those of other tracers in the range . However, the rotation curve of PNe derived using the velocity data of Merrett et al. (2006) is different from the other profiles in the similar radial range. The rotation velocity for PNe at is on average about 50 km s-1 smaller compared with those of other tracers, as seen in Figure 33 of Merrett et al. (2006). They showed that the presence of significant random velocities at all radii account for the asymmetric drift between the rotational motion and the local circular speed for PNe. In the inner region () of M31, the rotation curves are significantly different from each other. A careful study is needed for the rotation curves in the inner region due to the contribution of the non-circular motion of the bulge and the projection effect of an inclined M31 disk.
The velocity dispersion profiles for the GCs and the PNe are similar in general except for the inner region at . The velocity dispersion decreases from km s-1at to km s-1at , and changes little in the outermost area. The velocity dispersion of the GCs seems to increase again at , while that of the PNe keeps slowly decreasing with . More data on the GCs further out in the halo are needed to confirm this difference, which can probe whether a pressure-supported hot halo exists or not in M31.
3.6 Mass of M31
We have estimated the mass of M31 from the kinematic information of the GCs in this study using two methods: ‘Projected Mass Estimator (PME)’ and ‘Tracer Mass Estimator (TME)’. PME was introduced by Bahcall & Tremaine (1981) for the case of test particles orbiting a point mass, and later was extended by Heisler et al. (1985) for those tracing the total mass. The mass based on PME is given by
| (8) |
where is the number of objects, is the gravitational constant, is the projected galactocentric radius, and is the line-of-sight velocity relative to the systemic velocity of the galaxy. The constant is used for the objects with an isotropic orbit, while for the objects with a radial orbit. We obtain using all 504 GCs out to a radius of kpc with an assumption of isotropic orbits.
Later Evans et al. (2003) introduced a new method of TME for the case that the tracer population such as GCs and PNe does not follow the underlying mass distribution dominated by dark matter. They applied the TME to 321 GCs of Perrett et al. (2002), and obtained, for kpc, that is composed of a rotation contribution, and of a pressure contribution, . Similarly, Galleti et al. (2006) obtained a larger mass of using the TME with the expanded sample of 349 GCs. In this study, we first select 301 metal-poor GCs considered to be halo GCs, and choose a radial range where the surface number density of the halo GCs falls off as a power law. The surface number density of our metal-poor GCs follows approximately a power law beyond , similar to that of Evans et al. (2003). Finally, 146 halo GCs in the range of projected radius, ( kpc) are selected. We set (isothermal-like galaxy), , kpc, and kpc using the same assumptions as in Evans et al. (2003). Then, we obtain for kpc, the total mass of M31, that is composed of a rotation contribution, , and of a pressure contribution, .
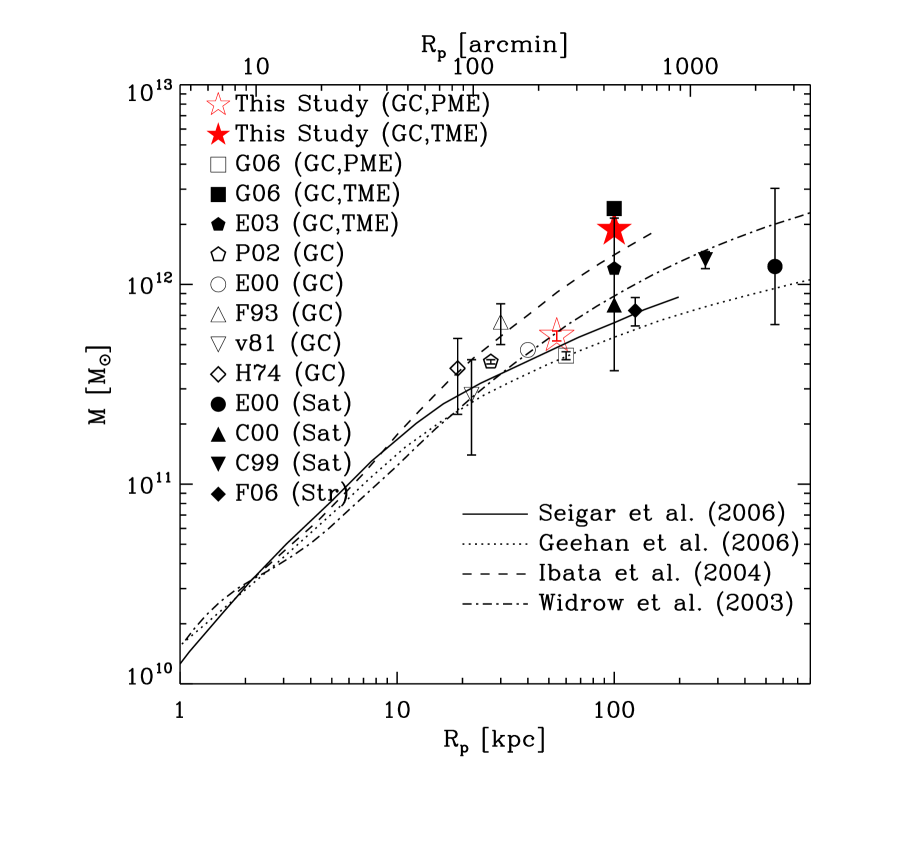
To compare our estimation with the results in the literature, we plot the various dynamical mass estimates using GCs (Hartwick & Sargent, 1974; van den Bergh, 1981; Federici et al., 1993; Evans & Wilkinson, 2000; Perrett et al., 2002; Evans et al., 2003; Galleti et al., 2006), satellite galaxies (Courteau & van den Bergh, 1999; Evans & Wilkinson, 2000; Côté et al., 2000), and streams (Fardal et al., 2006a) of M31 in Figure 24. In addition, several profiles of the mass model for M31 are plotted (Widrow et al., 2003; Ibata et al., 2004; Seigar et al., 2006; Geehan et al., 2006). The mass estimate based on PME derived in this study agrees well with other observational estimates by Evans & Wilkinson (2000); Galleti et al. (2006) and two mass models by Widrow et al. (2003); Seigar et al. (2006).
However, the mass estimates based on TME derived in this study and in Galleti et al. (2006) are larger than other estimates, and they are also larger than any models. If the TME is correct, the mass model of M31 needs a revision to a larger mass. This is also consistent with the Majewski et al. (2007)’s suggestion based on the study of a new dwarf galaxy, AndXIV. Noting that AndXIV shows a large velocity of km s-1 relative to M31 at a projected galactocentric distance of 162 kpc, Majewski et al. (2007) suggested that recent mass models of M31 need a revision to larger, if AndXIV is bound to M31. Similar discussion on the increase of the Milky Way Galaxy’s mass based on the most distant satellite ( kpc), the Leo I dwarf spheroidal galaxy, was given in Lee et al. (1993).
4 Discussion
4.1 A dominant bulge versus a wimpy halo in M31?
The existence of a halo in M31 has been controversial. While Huchra et al. (1991) suggested that the metal-poor GCs in M31 show little evidence of rotation, indicating that they belong to the halo of M31, other studies based on surface photometry, counts of red giant branch stars, and counts of PNe along the minor axis of M31 found an extended bulge, but no evidence of any halo component in M31 (Pritchet & van den Bergh, 1994; Mould & Kristian, 1986; Hurley-Keller et al., 2004; Irwin et al., 2005; Merrett et al., 2006). However, recent studies covering a very wide field of M31 are finding evidence for a huge halo in M31 (Irwin et al., 2005; Guhathakurta et al., 2005; Chapman et al., 2006; Kalirai et al., 2006; Gilbert et al., 2006; Ibata et al., 2007) as well as a vast extended disk reaching about 40 kpc from the center of M31 (Ibata et al., 2005).
Irwin et al. (2005) presented a minor-axis surface brightness profile reaching out to a projected radius of ( kpc), combining surface photometry and faint red giant star counts. They found that the minor-axis profile can be fit by a de Vaucouleurs law with effective bulge radius (1.4 kpc) out to a projected radius of ( kpc), and that there is a separate component beyond that can be fit by either a power law of index about –2.3 or an exponential law of scale length 14 kpc. One thing interesting about this component is that it has the same color as the inner region, indicating that it has a similar metallicity to that of the bulge (assuming the two components have the same age). In addition, the photometry of remote fields along the minor axis of M31 showed that most stars in these fields have unexpectedly high metallicity, [m/H] ([Fe/H]) while there are some metal-poor stars as well (Mould & Kristian, 1986; Durrell, Harris, & Pritchet, 2001). Thus there are two components in the outer region of M31 that are distinguished in structure, but not in metallicity. We may say from the results based on stars that M31 has a huge dominant bulge reaching out to , or that M31 has two bulges: an inner bulge (out to ) and an outer bulge (out to ). Even the inner bulge is much larger than the central bulge in our Galaxy, and the outer bulge may be called a halo.
The progenitors of PNe are low to intermediate mass stars so that they are often considered as a good tracer for old stellar populations. For example, the radial number density profiles of PNe in M31 show excellent agreement with the -band surface brightness profiles of the stellar bulge and disk (Walterbos & Kennicutt, 1987; Merrett et al., 2006). In particular, the number density profile of PNe along the minor axis of M31 is consistent with the profile out to one degree (Merrett et al., 2006; Hurley-Keller et al., 2004). Merrett et al. (2006) pointed out that there is little excess of PNe over the profile even at 10 (one degree), indicating no separate halo component. This is also consistent with the result based on the surface brightness profile along the minor axis (Pritchet & van den Bergh, 1994; Irwin et al., 2005). Considering the rotating kinematics of the outer PNe at kpc in M31 as well as the above points, Hurley-Keller et al. (2004) suggested that the bulge is the most dominating component in M31, while a nonrotating, pressure-supported halo is, if any, only a very minor component of M31.
In general, or at least in our Galaxy, metal-poor GCs are considered as a tracer of the halo, while metal-rich GCs belong to the bulge or thick disk like the PNe, although the bulge does have some metal-poor GCs (Harris, 1996). Note that the kinematics of 17 old star clusters in M33, irrespective of their metallicity, show evidence for the existence of a hot halo in M33 (Chandar et al., 2002). Therefore we may use metal-poor GCs to investigate the properties of any halo in M31. The kinematics of the metal-poor GCs along the major axis at kpc show a rotation as strong as the metal-rich GCs. The rotation amplitude of the metal-poor GCs decreases with increasing distance from the major axis, and the metal-poor GCs show some rotation ( km s-1) even far from the major axis at kpc. These results are consistent with those of Perrett et al. (2002), but not with Huchra et al. (1991).
However, the rotation-corrected velocity dispersion for the metal-poor GCs is about twice as large as the rotation amplitude in the outer region at kpc. The rotation-corrected velocity dispersion for the metal-poor GCs at kpc in M31, km s-1, is comparable to that of the metal-poor GCs in the Galactic halo at kpc, km s-1 given by Côté (1999). Considering that the spatial distribution of the metal-poor GCs in M31 is much more extended than that of the metal-rich GCs and that the velocity dispersion of the metal-poor GCs in the outer region of M31 is about two times larger than the rotation amplitude, we conclude that there is a dynamically hot halo in M31 that is rotating but primarily pressure-supported. This is consistent with the discovery of a pressure-supported metal-poor stellar halo based on the observations of red giant branch stars at radii from 10 kpc to 165 kpc (Chapman et al., 2006; Gilbert et al., 2006; Kalirai et al., 2006). Chapman et al. (2006) found from the analysis of a large sample of red giant branch stars: (a) there is seen a stellar halo component with low metallicity ( [Fe/H] ) at radii from 10 to 70 kpc, (b) there is little radial gradient of metallicity, (c) there is no significant evidence for rotation, and (d) the velocity dispersion of this metal-poor halo can be represented by km s-1 where is a projected galactocentric distance in units of kpc.
In Figure 25 we display the radial variation of the mean metallicity for the metal-poor GCs in comparison with that for the red giant branch stars given by Kalirai et al. (2006). A few features are noted in Figure 25: (a) the mean metallicity for the metal-poor GCs is much lower than that for the red giant branch stars at the same distance from the M31 center; (b) the mean metallicity for the metal-poor GCs in the inner region is similar to that for the red giant branch stars much further out at kpc that was considered to be the part of the stellar halo by Kalirai et al. (2006); and (c) the mean metallicity of the metal-poor GCs shows little radial dependence: [Fe/H] at kpc to [Fe/H] at kpc (if we use all GCs, we obtain [Fe/H] at kpc to [Fe/H] at kpc). These show that the metal-poor GCs are tracing the metal-poor halo, even in the inner region of M31.
Recently Ibata et al. (2007) found a faint, smooth and extremely extended halo component, reaching out to 150 kpc, about three times larger than the limit studied by Irwin et al. (2005). In addition, they found, from the photometry of red giant branch stars, that the majority of the stars in this extended halo are metal-poor, in contrast to the Irwin et al. (2005) finding that its integrated color is similar to the inner bulge. In spite of its huge size, the total luminosity of this halo derived assuming that it is symmetric is found to be L⊙, similar to the stellar halo of our Galaxy. Therefore it will be interesting to find GCs and investigate their kinematics in this outer halo of M31.
4.2 Comparison of GC and PN kinematics
PNe are an excellent tool for studying the kinematics of the bulge and halo of a galaxy. Recently huge data sets for the PNe in M31 were published by Merrett et al. (2006); Halliday et al. (2006). How do the kinematics of the GCs compare with that of the PNe in M31? We have derived the kinematics of about 2500 PNe using the same method to the data given by Merrett et al. (2006), as used for the analysis of the GC data, which are summarized in Table 2.
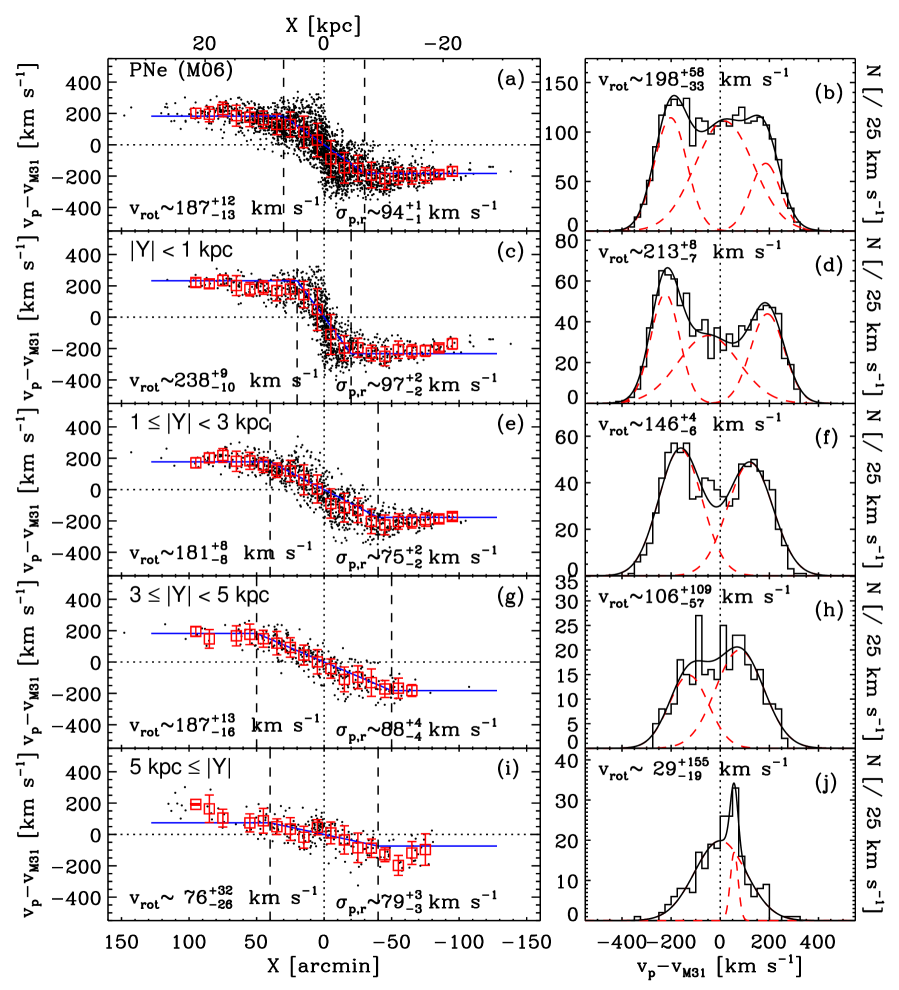
Figure 26 displays radial velocities (dots) versus the projected distances along the major axis () and the velocity histogram for the PNe in M31 based on the data given by Merrett et al. (2006), like Figure 8 for GCs. We plot also the mean radial velocity and its dispersion of the PNe in a distance bin of 10 along the major axis. Velocity histograms of PNe are displayed with Gaussian fits as in Figure 8. Figure 26 shows that the rotational properties of the PNe are very similar to those of the GCs. The rotational amplitudes of all PNe are km s-1 from the rotation curve, and km s-1 from the velocity histogram, which are similar to those of GCs derived in this study, km s-1, and km s-1, respectively. The rotation amplitudes of the PNe decrease as the distance along the minor axis of M31 increases, but the rotation amplitude is not zero even for the outermost samples at kpc, which are consistent with the results based on GCs derived in this study.
The rotation-corrected velocity dispersion for all PNe is estimated to be km s-1, which is much smaller than that for all GCs, km s-1. The rotation-corrected velocity dispersion for the PNe at kpc is km s-1, and it becomes smaller and shows little variation with : km s-1 for kpc, km s-1 for kpc, and km s-1 for kpc. Thus the rotation-corrected velocity dispersion for the PNe at kpc is consistent with that for the metal-rich GCs at kpc, km s-1. We cannot compare the kinematics of the PNe at kpc with that of the metal-rich GCs at , because there are too few such GCs in this region.
The rotation-corrected velocity dispersions for the PNe at kpc are significantly different from those for the metal-poor GCs. That is, the rotation-corrected velocity dispersion for the PNe at kpc are smaller than that for the metal-poor GCs at kpc, and the former shows little variation depending on for kpc, while the latter increases with . These differences show that the PNe are tracing well the bulge, while the metal-poor GCs are tracing better the metal-poor halo, although their spatial coverages in the sky are similar. Therefore we conclude again that there do exist both an extended rotating bulge and a dynamically hot metal-poor halo in M31.
4.3 Formation and Evolution of M31
Main features related with the kinematics of the M31 GC system revealed in this study can be summarized as follows. Most of the GCs show a strong rotation around the minor axis. The rotation velocity decreases with increasing distance from the major axis. It is still as large as km s-1 even at kpc, indicating the bulge of M31 is large and rotation-dominated, which is consistent with the finding based on the PNe by Hurley-Keller et al. (2004) and Merrett et al. (2006). The rotation velocity of the metal-rich GCs is similar to that of the metal-poor GCs in the region close to the major disk. The spatial distribution of metal-rich GCs shows a stronger central concentration than that of the metal-poor GCs. The rotation-corrected velocity dispersion of the metal-poor GCs in the outer region of M31 is about twice larger than the rotation amplitude. There are several substructures in the spatial distribution of both metal-poor GCs and metal-rich GCs. There are about 50 friendless GCs all over the disk of M31, and most of them show retrograde motion. Interestingly it appears that these GCs show a rotation around the major axis, while most of M31 GCs show a rotation around the minor axis.
What do these results in addition to the known properties of M31 tell us about the formation and evolution of M31 in comparison with our Galaxy? The most distinguishable kinematic difference between the M31 GCs and the Galactic GCs is a difference in the bulge and halo kinematics. In our Galaxy metal-poor halo GCs are the most dominant population among the GCs, and metal-rich GCs in the bulge (or thick disk) are a minor population . The bulge GCs show significant rotation ( km s-1), while the halo GCs are pressure-supported ( km s-1and km s-1) (Armandroff, 1989; Côté, 1999). In contrast, the disk and bulge GCs are the most dominant population in M31, and the halo GCs may be a minor population compared with the Galactic halo GCs.
The current picture of the formation and evolution of the halo in our Galaxy involves basically two classical scenarios: (a) The monolithic collapse model according to which the stellar halo is formed by the rapid collapse of a monolithic protogalactic cloud in a dynamical time scale of about 0.1 Gyr(Eggen, Lynden-Bell, & Sandage, 1962), and (b) the accretion/merging model according to which the stellar halo is formed via successive accretion and merging of protogalactic fragments (Searle & Zinn, 1978; White & Rees, 1978). The latter is related with the current paradigm for explaining the formation of the cosmological large scale structure: a hierarchical merging scenario in the CDM universe. It appears that both scenarios are involved in forming the halo of our Galaxy (Chiba & Beers, 2000). While the inner part of our Galaxy can be explained mainly by the first, the outer part of our Galaxy is explained better by the latter.
Recently, Renda et al. (2005a) suggested from a semi-analytic multizone chemical evolution model that the observed higher metallicity in the M31 halo compared with the Galactic halo can be explained by two scenarios: (a) a higher star formation efficiency for the halo that is expected from the accretion of smaller satellites, or (b) a larger reservoir of infalling halo gas with a longer halo phase, producing the intermediate-age population in the halo. These were also confirmed in the semi-cosmological spiral galaxy simulation by Renda et al. (2005b), indicating that the M31 halo may have a more protracted assembly history compared with the halo of our Galaxy. On the other hand, Font et al. (2006b) found from the simulation of the stellar halo in our Galaxy based on the hierarchical scenario: (a) the stellar halo of our Galaxy formed inside out via accretion of satellites; (b) the inner halo at kpc assembled rapidly, and most of its mass were in place more than 8-9 Gyr ago; (c) satellites surviving today were accreted within the past few Gyr; and (d) a major fraction of the present-day stellar halo was originally from a few massive satellites with . They also pointed out that the much lower metallicity of the Galactic halo compared with the M31 halo indicates that our Galaxy could have formed mainly through smaller satellites. Noting that our Galaxy has a stellar mass and angular momentum that are 2 to 3 times lower than M31, which is a typical spiral galaxy, Hammer et al. (2007) suggested that our Galaxy has an exceptionally quiet formation history involving no major merger during the last 10-11 Gyr. However, it is noted that the term ’M31 halo’ used in these studies corresponds to the extended bulge, not to the metal-poor halo in M31. Therefore these studies explain the formation of the extended bulge in M31 and the halo in our Galaxy.
M31 might have formed and evolved in a way similar to our Galaxy, with some differences. The existence of the rotating metal-rich central bulge, the radial gradient of the metallicity and the extended smooth metal-poor halo in M31 can be explained by a rapid dissipative collapse of a proto-Galactic cloud, while the extended bulge and its several substructures including giant streams and friendless GCs (Ibata et al. (2005); Gilbert et al. (2007); Ibata et al. (2007) and this study), are evidence for accretion and merging of small scale fragments. Differences between M31 and our Galaxy are that the degree of merging was larger, the scale of merging fragments was larger, and the duration of merging (or the frequency of merging) was larger in M31 compared with our Galaxy. Remaining questions are: (a) Why does M31 have an extended metal-rich bulge in M31, which is not seen in our Galaxy?; (b) Why is the M31 extended bulge a strong rotator?; (c) Are there metal-poor GCs that do not show systematic rotation in the halo of M31?; (d) Why do the metal-poor GCs in M31 show some rotation while those in our Galaxy do not?; and (e) Is there indeed a population of young disk GCs in M31 as posited by Morrison et al. (2004), which has no counterpart in the Galaxy?
5 Summary
We produced a master catalog of 504 GCs with measured velocity in M31 combining the data for 211 GCs measured in our survey (Kim et al., 2007) and 354 GCs (including 61 common GCs) available in the literature. Using the photometric and spectroscopic database of these GCs, we have investigated the kinematics of the GC system of M31. Our velocities are in good agreement with published values for objects in common, with a typical error of 35.3 km/s. Primary results are summarized below:
-
1.
The mean value and dispersion of the radial velocities for the 211 GCs measured in this study are km s-1 and km s-1, respectively. Using all 504 GCs in the master catalog, we obtain the mean value and dispersion of the radial velocities as km s-1 and km s-1, respectively.
-
2.
For all GCs, the rotation amplitude estimated by fitting the rotation curve is km s-1, while the one from the velocity histogram is km s-1. The rotation amplitude decreases as the distance along the minor axis of M31 increases. However, the rotation amplitude is not zero for the outermost samples at kpc, indicating an extended rotating bulge or a hot rotating halo.
-
3.
We have identified 50 friendless GCs among all 504 GCs. It appears that the friendless GCs rotate around the major axis of M31 unlike the rotation around the minor axis for the disk population, which calls for more sophisticated investigation. A KS test yields that the difference between the friendless and normal GCs is significant for the distribution of magnitude and () color.
-
4.
For the subsamples of the metal-poor GCs and metal-rich GCs, it is found that the metal-rich GCs are more centrally concentrated than the metal-poor GCs, and that the rotation amplitudes for the metal-poor GCs and metal-rich GCs are similar. For the subsamples of bright and faint GCs, it is found that the bright GCs are more centrally concentrated than the faint GCs, and that the rotation for the faint GCs is stronger than that for bright GCs.
-
5.
The rotation-corrected velocity dispersion for all GCs is estimated to be km s-1, and it increases from km s-1 at kpc to km s-1 at kpc. These results are very similar to those for the metal-poor GCs. This shows that there is a dynamically hot halo in M31 that is rotating but primarily pressure-supported.
-
6.
We have identified 56 GCs and GC candidates with X-ray detection including 39 genuine GCs with measured velocities. Kinematic difference between the X-ray emitting and other GCs is not significant at this stage, but further studies are needed with an expanded sample of X-ray emitting GCs. The photometric properties of the X-ray emitting GCs show that the GCs that are redder, more metal-rich, and brighter are more likely to be detected as X-ray emitting GCs, as seen for GCs in early-type galaxies
-
7.
We derived the rotation curve of M31 using the metal-poor GCs at kpc from 8.9 to 46.4 arcmin. The rotation curve using the GCs in this study is consistent with those using other tracers in the range except for that based on PNe of Merrett et al. (2006).
-
8.
The dynamical mass of M31 using the kinematic information of the GCs in this study is estimated to be out to a radius of kpc using the PME, and at kpc using the TME.
References
- Armandroff (1989) Armandroff, T. E. 1989. AJ, 97, 375
- Ashman & Bird (1993) Ashman, K. M., & Bird, C. M. 1993, AJ, 106, 2281
- Ashman et al. (1994) Ashman, K. M., Bird, C. M., & Zepf, S. E. 1994, AJ, 108, 2348
- Bahcall & Tremaine (1981) Bahcall, J. N., & Tremaine, S. 1981, ApJ, 244, 805
- Barmby et al. (2000) Barmby, P., Huchra, J. P., Brodie, J. P., Forbes, D. A., Schroder, L. L., & Grillmair, C. J. 2000, AJ, 119, 727
- Battistini et al. (1987) Battistini, P., Bònoli, F., Braccesi, A., Federici, L., Fusi Pecci, F., Marano, B., & Börngen, F. 1987, A&AS, 67, 447
- Beasley et al. (2004) Beasley, M. A., Brodie, J. P., Strader, J., Forbes, D. A., Proctor, R. N., Barmby, P., & Huchra, J. P. 2004, AJ, 128, 1623
- Beasley et al. (2005) Beasley, M. A., Brodie, J. P., Strader, J., Forbes, D. A., Proctor, R. N., Barmby, P., & Huchra, J. P. 2005, AJ, 129, 1412
- Beers et al. (1990) Beers, T. C., Flynn, K., & Gebhardt, K. 1990, AJ, 100, 32
- Bellazzini et al. (1995) Bellazzini, M., Pasquali, A., Federici, L., Ferraro, F. R., & Fusi Pecci, F. F. 1995, ApJ, 439, 687
- Braun (1991) Braun, R. 1991, ApJ, 372, 54
- Brown et al. (2003) Brown, T. M., Ferguson, H. C., Smith, E., Kimble, R. A., Sweigart, A. V., Renzini, A., Rich, R. M., & VandenBerg, D. A. 2003, ApJ, 592, L17
- Brown et al. (2007) Brown, T. M., et al. 2007, AJ, 658, L95
- Burstein et al. (2004) Burstein, D., et al. 2004, ApJ, 614, 158
- Carignan et al. (2006) Carignan, C., Chemin, L., Huchtmeier, W. K., & Lockman, F. J. 2006, ApJ, 641, L109
- Carignan et al. (2007) Carignan, C., Chemin, L., & Foster, T. 2007, (astro-ph/0702609)
- Chandar et al. (2002) Chandar, R., Bianchi, L., Ford, H. C., & Sarajedini, A. 2002, ApJ, 564, 712
- Chapman et al. (2006) Chapman, S. C., Ibata, R., Lewis, G. F., Ferguson, M. N., Irwin, M., MaConnachie, A., & Tanvir, N. 2006, ApJ, 653, 255
- Chiba & Beers (2000) Chiba, M. & Beers, T. 2000, AJ, 119, 2843
- Côté (1999) Côté, P. 1999, AJ, 118, 406
- Côté et al. (2000) Côté, P., Mateo, M., Sargent, W. L. W., & Olszewski, E. W. 2000, ApJ, 537, L91
- Courteau & van den Bergh (1999) Courteau, S., & van den Bergh, S. 1999, AJ, 118, 337
- Crane et al. (1992) Crane, P. C., Dickel, J. R., & Cowan, J. J. 1992, ApJ, 390, L9
- de Vaucouleurs (1958) de Vaucouleurs, G. 1958, ApJ, 128, 465
- de Vaucouleurs et al. (1991) de Vaucouleurs, G., de Vaucouleurs, A., Corwin, H. G. Jr., Buta, R. J., Paturel, H. G., & Fouqué, P. 1991, Third Reference Catalog of Bright Galaxies (New York: Springer)
- Di Stefano et al. (2002) Di Stefano, R., Kong, A. K. H., Garcia, M. R., Barmby, P., Greiner, J., Murray, S. S., & Primini, F. A. 2002, ApJ, 570, 618
- Durrell, Harris, & Pritchet (2001) Durrell, P. R., Harris, W. E., & Pritchet, C. J. 2001, AJ, 121, 2557
- Eggen, Lynden-Bell, & Sandage (1962) Eggen, O. J., Lynden-Bell, D. & Sandage, A. R. 1962, ApJ, 136, 929
- Evans & Wilkinson (2000) Evans, N. W., & Wilkinson, M. I. 2000, MNRAS, 316, 929
- Evans et al. (2003) Evans, N. W., Wilkinson, M. I., Perrett, K. M., & Bridges, T. J. 2003, ApJ, 583, 752
- Fan et al. (2005) Fan, Z., Ma, J., Zhou, X., Chen, J., Jiang, Z., & Wu, Z. 2005, PASP, 117, 1236
- Fardal et al. (2006a) Fardal, M. A., Babul, A., Geehan, J. J., & Guhathakurta, P. 2006a, MNRAS, 366, 1012
- Fardal et al. (2006b) Fardal, M. A., Guhathakurta, P., Babul, A., & McConnachie, A. W. 2006b, MNRAS, submitted (astro-ph/0609050)
- Federici et al. (1990) Federici, L., Marano, B., & Fusi Pecci, F. 1990, A&A, 236, 99
- Federici et al. (1993) Federici, L., Bonoli, F., Ciotti, L., Fusi-Pecci, F., Marano, B., Lipovetsky, V. A., Niezvestny, S. I., & Spassova, N. 1993, A&A, 274, 87
- Ferguson et al. (2002) Ferguson, A. M. N., Irwin, M. J., Ibata, R. A., Lewis, G. F., & Tanvir, N. R. 2002, AJ, 124, 1452
- Font et al. (2006a) Font, A. S., Johnston, K. V., Guhathakurta, P., Majewski, S. R., & Rich, R. M. 2006a, AJ, 131, 1436
- Font et al. (2006b) Font, A. S., Johnston, K. V., Bullock, J. S., & Robertson, B. E. 2006b, ApJ, 638, 585
- Freedman & Madore (1990) Freedman, W. L., & Madore, B. F. 1990, ApJ, 365, 186
- Galleti et al. (2004) Galleti, S., Federici, L., Bellazzini, M., Fusi Pecci, F., & Macrina, S. 2004, A&A, 416, 917
- Galleti et al. (2006) Galleti, S., Federici, L., Bellazzini, M., Buzzoni, A., & Fusi Pecci, F. 2006, A&A, 456, 985
- Geehan et al. (2006) Geehan, J. J., Fardal, M. A., Babul, A., & Guhathakurta, P. 2006, MNRAS, 366, 996
- Gilbert et al. (2006) Gilbert, K. M. et al. 2006, ApJ, 652, 1188
- Gilbert et al. (2007) Gilbert, K. M. et al. 2007, ApJ, in press (astro-ph/0703029)
- Guhathakurta et al. (2005) Guhathakurta, P., Ostheimer, J. C., Gilbert, K. M., Rich, R. M., Majewski, S. R., Kalirai, J. S., Reitzel, D. B., and Patterson, R. J. 2005, unpublished (astro-ph/0502366)
- Halliday et al. (2006) Halliday, C. et al. 2006, MNRAS, 369, 97
- Hammer et al. (2007) Hammer, F., Puech, M., Chemin, L., Flores, H., & Lehnert, M. D. 2007, ApJ, 662, 322
- Harris (1996) Harris, W. E. 1996, AJ, 112, 1487
- Hartwick & Sargent (1974) Hartwick, F. D. A., & Sargent, W. L. W. 1974, ApJ, 190, 283
- Heisler et al. (1985) Heisler, J., Tremaine, S., & Bahcall, J. N. 1985, ApJ, 298, 8
- Hodge (1992) Hodge, P. 1992, The Andromeda Galaxy, Astrophysics and Space Science Library, Dordrecht:Kluwer
- Hubble (1932) Hubble, E. P. 1932, ApJ, 76, 44
- Huchra et al. (1982) Huchra, J., Stauffer, J., & van Speybroeck, L. 1982, ApJ, 259, L57
- Huchra et al. (1991) Huchra, J. P., Brodie, J. P., & Kent, S. M. 1991, ApJ, 370, 495
- Hurley-Keller et al. (2004) Hurley-Keller, D., Morrison, H. L., Harding, P., & Jacoby, G. H. 2004, ApJ, 616, 804
- Huxor et al. (2005) Huxor, A. P., Tanvir, N. R., Irwin, M. J., Ibata, R., Collett, J. L., Ferguson, A. M. N., Bridges, T., & Lewis, G. F. 2005, MNRAS, 360, 1007
- Ibata et al. (2001) Ibata, R., Irwin, M., Lewis, G., Ferguson, A. M. N., & Tanvir, N. 2001, Nature, 412, 49
- Ibata et al. (2004) Ibata, R., Chapman, S., Ferguson, A. M. N., Irwin, M., Lewis, G., & McConnachie, A. 2004, MNRAS, 351, 117
- Ibata et al. (2005) Ibata, R., Chapman, S., Ferguson, A. M. N., Lewis, G., Irwin, M., & Tanvir, N. 2005, ApJ, 634, 287
- Ibata et al. (2007) Ibata, R., Martin, N. F., Irwin, M., Chapman, S., Ferguson, A. M. N., Lewis, G., & McConnachie, A. 2007, in press (astro-ph/0704.1318)
- Irwin et al. (2005) Irwin, M. J., Ferguson, A. M. N., Ibata, R. A., Lewis, G. F., & Tanvir, N. R. 2005, ApJ, 628, L105
- Jablonka et al. (1998) Jablonka, P., Bica, E., Bonatto, C., Bridges, T. J., Langlois, M., & Carter, D. 1998, A&A, 335, 867
- Kaaret (2002) Kaaret, P. 2002, ApJ, 578, 114
- Kalirai et al. (2006) Kalirai, J. S., Gilbert, K. M., Guhathakurta, P., Majewski, S. R., Ostheimer, J. C., Rich, R. M., Cooper, M. C., Reitzel, D. B., & Patterson, R. J. 2006, ApJ, 648, 389
- Karachentsev et al. (2004) Karachentsev, I. D., Karachentseva, V. E., Huchtmeier, W. K., & Makarov, D. I. 2004, AJ, 127, 2031
- Kent (1989) Kent, S. M. 1989, PASP, 101, 489
- Kim et al. (2006) Kim, E., Kim, D.-W., Fabbiano, G., Lee, M. G., Park, H. S., Geisler, D., & Dirsch, B. 2006, ApJ, 647, 276
- Kim et al. (2007) Kim, S. C., Lee, M. G., Geisler, D., Sarajedini, A., Park, H. S., Hwang, H. S., Harris, W. E., Seguel, J. C., & von Hippel, T. 2007, AJ, 134, 706 (Paper I)
- Klypin et al. (2002) Klypin, A., Zhao, H., & Somerville, R. S. 2002, ApJ, 573, 597
- Kong et al. (2002) Kong, A. K. H., Garcia, M. R., Primini, F. A., Murray, S. S., Di Stefano, R., & McClintock, J. E. 2002, ApJ, 577, 738
- Lee et al. (1993) Lee, M. G., Freedman, W., Mateo, M., Thompson, I., Roth, M., & Ruiz, M.-T. 1993, AJ, 106, 1420
- Loinard et al. (1995) Loinard, L., Allen, R. J., & Lequeux, J. 1995, A&A, 301, 68
- Mackey et al. (2007) Mackey, A. D., et al. 2007, ApJ, 655, L85
- Majewski et al. (2007) Majewski, S. R., et al. 2007, ApJ, submitted (astro-ph/0702635)
- McConnachie et al. (2004) McConnachie, A. W., Irwin, M. J., Lewis, G. F., Ibata, R. A., Chapman, S. C., Ferguson, A. M. N., & Tanvir, N. R. 2004, MNRAS, 351, L94
- McConnachie et al. (2005) McConnachie, A. W., Irwin, M. J., Ferguson, A. M. N., Ibata, R. A., Lewis, G. F., & Tanvir, N. 2005, MNRAS, 356, 979
- Merrett et al. (2003) Merrett, H. R., et al. 2003, MNRAS, 346, L62
- Merrett et al. (2006) Merrett, H. R., et al. 2006, MNRAS, 369, 120
- Morrison et al. (2003) Morrison, H. L., Harding, P., Hurley-Keller, D., & Jacoby, G. 2003, ApJ, 596, L183
- Morrison et al. (2004) Morrison, H. L., Harding, P., Perrett, K., & Hurley-Keller, D. 2004, ApJ, 603, 87
- Mould & Kristian (1986) Mould, J. , & Kristian, J. 1986, ApJ, 305, 591
- Perrett et al. (2002) Perrett, K. M., Bridges, T. J., Hanes, D. A., Irwin, M. J., Brodie, J. P., Carter, D., Huchra, J. P., & Watson, F. G. 2002, AJ, 123, 2490
- Perrett et al. (2003) Perrett, K. M., Stiff, D. A., Hanes, D. A., & Bridges, T. J. 2003, ApJ, 589, 790
- Pietsch et al. (2005) Pietsch, W., Freyberg, M., & Haberl, F. 2005, A&A, 434, 483
- Pritchet & van den Bergh (1994) Pritchet, C. J., & van den Bergh, S. 1994, AJ, 107, 1730
- Puzia et al. (2005) Puzia, T. H., Perrett, K. M., & Bridges, T. J. 2005, A&A, 434, 909
- Renda et al. (2005a) Renda, A., Kawata, D., Fenner, Y., & Gibson, B. 2005a, MNRAS, 356, 1071
- Renda et al. (2005b) Renda, A., Gibson, B., Mouhcine, M., Ibata, R. A., Kawata, D., Flynn, C., & Brook, C. B. 2005b, MNRAS, 363, 16L
- Richstone & Tremaine (1984) Richstone, D. O., & Tremaine, S. 1984, ApJ, 286, 27
- Rubin & Ford (1970) Rubin, V. C., & Ford, W. K. J. 1970, ApJ, 159, 379
- Sarazin et al. (2003) Sarazin, C. L., Kundu, A., Irwin, J. A., Sivakoff, G. R., Blanton, E. L., & Randall, S. W. 2003, ApJ, 595, 743
- Sargent et al. (1977) Sargent, W. L. W., Kowal, C. T., Hartwick, F. D. A., & van den Bergh, S. 1977, AJ, 82, 947
- Searle & Zinn (1978) Searle, L., & Zinn, R. 1978, ApJ, 225, 357
- Seigar et al. (2006) Seigar, M. S., Barth, A. J., & Bullock, J. S. 2006, ApJ, submitted (astro-ph/0612228)
- Sivakoff et al. (2006) Sivakoff, G. R., et al. 2006, ApJ, 669, 1246
- Sofue & Rubin (2001) Sofue, Y., & Rubin, V. 2001, ARA&A, 39, 137
- Supper et al. (2001) Supper, R., Hasinger, G., Lewin, W. H. G., Magnier, E. A., van Paradijs, J., Pietsch, W., Read, A. M., & Trümper, J. 2001, A&A, 373, 63
- Trudolyubov & Priedhorsky (2004) Trudolyubov, S., & Priedhorsky, W. 2004, ApJ, 616, 821
- Trudolyubov et al. (2005) Trudolyubov, S., Kotov, O., Priedhorsky, W., Cordova, F., & Mason, K. 2005, ApJ, 634, 314
- Trudolyubov et al. (2006) Trudolyubov, S., Priedhorsky, W., & Cordova, F. 2006, ApJ, 645, 277
- van den Bergh (1969) van den Bergh, S. 1969, ApJS, 19, 145
- van den Bergh (1981) van den Bergh, S. 1981, PASP, 93, 428
- van den Bergh (2000) van den Bergh, S. 2000, The Galaxies of the Local Group, Cambridge Universe Press
- Walterbos & Kennicutt (1987) Walterbos, R. , & Kennicutt, R. 1987, A&AS, 69, 311
- White & Rees (1978) White, S. D. M. , & Rees, M. J. 1978, MNRAS, 183, 341
- Widrow et al. (2003) Widrow, L. M., Perrett, K. M., & Suyu, S. H. 2003, ApJ, 588, 311
- Williams et al. (2004) Williams, B. F., Garcia, M. R., Kong, A. K. H., Primini, F. A., King, A. R., Di Stefano, R., & Murray, S. S. 2004, ApJ, 609, 735
| N | ||||||
|---|---|---|---|---|---|---|
| (kpc) | (km s-1) | (km s-1) | (km s-1) | (km s-1) | (km s-1) | |
| All GCs | ||||||
| 0 | 504 | |||||
| 149 | ||||||
| 203 | ||||||
| 65 | ||||||
| 5 | 87 | |||||
| Metal-Poor GCs ([Fe/H]) | ||||||
| 0 | 310 | |||||
| 79 | ||||||
| 135 | ||||||
| 37 | ||||||
| 5 | 59 | |||||
| Metal-Rich GCs ([Fe/H]) | ||||||
| 0 | 121 | … | ||||
| 50 | ||||||
| 43 | ||||||
| 18 | … | … | … | |||
| 5 | 10 | … | … | … | ||
| Bright GCs () | ||||||
| 0 | 201 | |||||
| Faint GCs () | ||||||
| 0 | 203 | |||||
| N | ||||||
|---|---|---|---|---|---|---|
| (kpc) | (km s-1) | (km s-1) | (km s-1) | (km s-1) | (km s-1) | |
| 0 | 2526 | |||||
| 1016 | ||||||
| 914 | ||||||
| 350 | ||||||
| 5 | 246 |