Characterization of graphene through anisotropy of constant-energy maps in angle-resolved photoemission
Abstract
We show theoretically how constant-energy maps of the angle-resolved photoemission intensity can be used to test wave function symmetry in graphene. For monolayer graphene, we demonstrate that the observed anisotropy of ARPES spectra is a manifestation of what has been recently branded as electronic chirality. For bilayer graphene, we show that the anisotropy of the constant-energy maps may be used to extract information about the magnitude and sign of interlayer coupling parameters and about symmetry breaking inflicted on a bilayer by the underlying substrate.
pacs:
79.60.-i, 73.22.-f, 81.05.Uw, 73.43.CdI Introduction
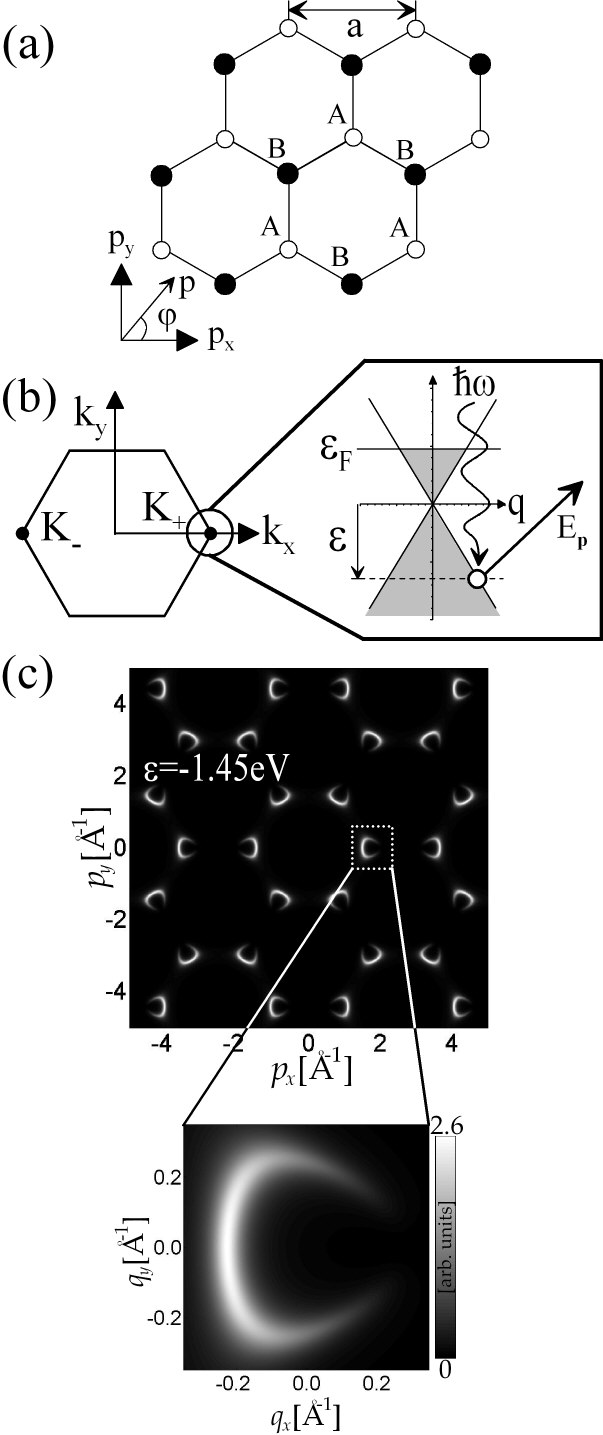
A similarity between electrons in monolayer graphene and relativistic massless particles has been broadly discussed in the literature wallace ; slonweiss ; mcclure ; DiVincenzo ; Semenoff ; AndoNoBS . The combination of a sublattice composition of electronic Bloch states (treated as an “isospin”) in a single atomic sheet of graphite with a linear dispersion in the vicinity of corners of the Brillouin zone makes them chiral, like Dirac fermions. Experimentally, the chiral nature of charge carriers has been deduced from a peculiar sequencing of plateaus in the quantum Hall effect novo04 ; novo05 ; zhang05 ; novo06 , while the linear dispersion relation has been observed directly by angle-resolved photoelectron spectroscopy (ARPES) bost07 ; zhou06 ; ohta06 ; ohta07 ; bost07b ; zhou07 ; bost07c ; bost07d . ARPES has already been used to provide information about the form of the dispersion curves, renormalization of spectra by electron-electron and electron-phonon interactions, and information about quasiparticle lifetimes in the material bost07 ; park07 ; cal07 ; tse07 ; pol07 . Here, we point out that constant-energy angular maps of photoemission reflect the chirality of electrons in graphene. For monolayers, we show that the recently published ARPES data provides evidence for the chirality of carriers in this material. We demonstrate that the anisotropy of the constant-energy maps may be used to extract information about the magnitude and sign of interlayer coupling parameters in bilayer graphene and about the types of symmetry-breaking effects produced by the underlying substrate or doping. In particular, we demonstrate that one can distinguish between two effects that may generate a gap in the bilayer spectrum: interlayer asymmetry mcc06 ; ohta06 ; guinea06 ; mcc06b ; min07 ; castro ; aoki07 ; mcc07 ; guinea07 ; mcc07b ; guinea07b and symmetry breaking in the bottom layer resting on a SiC substrate bost07b ; zhou07 ; varchon07 .
Whereas the chirality of a relativistic particle is defined by its spin, chirality in graphene refers to the sublattice composition of plane-wave states of Bloch electrons. The honeycomb lattice of monolayer graphene, Fig. 1(a), has two sites in the unit cell, labeled as and , and there is a degeneracy point at each of two inequivalent corners of the hexagonal Brillouin zone, also referred to as valleys, Fig. 1(b). Near the center of valley in monolayer graphene, electrons are described by a Dirac-like Hamiltonian,
| (1) |
which determines the linear dispersion of electrons in the conduction band and in the valence band wallace . The eigenstates , within a single valley, have different amplitudes on adjacent and sites, and, following the example of relativistic physics, they may be written as a two-component “spinor” . The chirality of a relativistic particle is right-handed if its spin points in the same direction as its momentum, left-handed if its spin points in the opposite direction. By analogy, the relative phase between the wave function on sublattice atoms indicates the ‘isospin’ vector of the chiral state of quasiparticles in graphene. ARPES himpsel ; shirley is exactly the tool to visualize this state through the angular dependence of the emitted photoelectron flux.
The proposed analysis is based upon the standard theory of angle-resolved photoemission himpsel ; shirley . In an ARPES experiment, incident photons with energy produce photoelectrons whose intensity is measured in a known direction as a function of kinetic energy himpsel ; shirley : where is the work function and is the energy of Bloch electrons in graphene. Conservation of momentum ensures that the component of the momentum parallel to the graphene surface is equal to the quasi-momentum of Bloch electrons near valley :
| (2) |
where a reciprocal lattice vector is written in terms of primitive reciprocal lattice vectors , , and integers , .
As graphene has two inequivalent atomic sites, the angular dependence of the intensity may be accounted for by considering two-source interference (à la Young’s double slits). Outside the sample, at a position relative to the midpoint of the two sources, electronic waves and from adjacent and sites combine. This yields the intensity of the two-source interference pattern,
| (3) |
where is the separation of the adjacent sites, and near each corner of the Brillouin zone . The first term in the argument of Eq. (3) is a phase difference due to the different path lengths of electron waves emitted from two sublattices, while the second term, , arises from the relative phase of the electronic Bloch states on and sublattices determined by the quasiparticle chirality.
| energy | chirality | sublattice phase | ARPES |
|---|---|---|---|
| difference | anisotropy | ||
Table 1: Manifestation of electronic chirality in the anisotropy of ARPES constant-energy maps in monolayer graphene in the valley , where angle specifies the direction measured from the center of the valley.
Electrons in the conduction and valence bands at the valley , determined by the Dirac Hamiltonian, Eq. (1), differ by the projection of their isospin onto the direction of their momentum as described by the chiral operator where : in the conduction band, in the valence band, as listed in Table 1. Note that, the first term in the argument of Eq. (3), arising from the path difference of electron waves emitted from two sublattices, accounts for the relative rotation in the interference pattern around the six corners of the hexagonal Brillouin zone. Figure 1(c) shows a typical calculated dependence of the intensity of the photoemission from states (here, at energy eV below the charge-neutrality point cnpoint ) plotted as a function of wave vector , in agreement with the qualitative prediction of the two-source interference picture Eqs. (1,3), summarized in Table 1. The numerical data, Fig. 1(c), appear to be consistent with experimentally measured constant-energy maps bost07 .
So far, we have discussed the angular dependence of the interference patterns, neglecting the effect of trigonal warping. It leads to a triangular deformation of iso-energetic lines in the band structure of graphene and asymmetry of the electron dispersion around each valley which becomes more pronounced for states further from the charge-neutrality point. Another perturbation of chiral particles in graphene may be asymmetry of on-site lattice energies , due to the presence of a substrate, leading to a gap in the spectrum at low energies. The presence of such asymmetry in graphene grown epitaxially on SiC substrate, and the possibility of observing its effect within spectroscopic accuracy, has recently been discussed following experimental ARPES measurements of the low-energy band structure bost07b ; zhou07 . In Section II below, we show that opening an asymmetry gap in the monolayer spectrum is accompanied by the loss of the chirality-related anisotropy of ARPES angular maps at low energies, which can be used as an additional test for the symmetry-breaking effect induced by a SiC substrate.
In Section III we offer a detailed analysis of the angle-dependent maps of ARPES of bilayer graphene, which is the main goal of this work. First, we analyze angular photoemission maps of an ideal “pristine” bilayer, taking into account intricate details of its band structure using a tight-binding model that employs the Slonczewski-Weiss-McClure parametrization of relevant couplings slonweiss ; mcclure . In Sections III.1 and III.2, we show that angular maps can be used to determine not only the magnitude, but also signs of the interlayer coupling constants used in the tight-binding model. If measured experimentally, the latter information may also prove to be useful for general studies of bulk graphite. In Section III.3 we analyze the influence of inter- and intra-layer symmetry breaking in bilayers, and we show that the effect of the interlayer charge transfer upon doping can be, in principle, distinguished from crystalline asymmetry induced by a SiC substrate.
II Photoemission from monolayer graphene
To produce a quantitative prediction of the photoemission intensity, we use Fermi’s Golden Rule to calculate the probability of a photo-stimulated transition from an initial band state with 2D quasi-momentum and energy in graphene to a continuum state with momentum and energy in vacuum shirley . The initial state wave function in graphene is written as a linear combination of Bloch wave functions on the and sublattices with coefficients and , respectively:
where , are the positions of and type atoms, and is a atomic orbital. Then, the intensity of photoemission from states in a given band may be written as
| (4) |
where is the Fourier image of an atomic orbital , and the wave vector component parallel to the surface is conserved, , Eq. (2). The summation with respect to index takes into account coefficients and located at atomic positions defined by basis vectors and within a given unit cell. The Dirac delta function, containing the work function of graphene , expresses energy conservation. Note that, in this paper, we do not model dynamical effects that lead to energy broadening bost07 ; park07 ; cal07 ; tse07 ; pol07 , but introduce a Lorentzian in the figures with parameter representing finite energy broadening.
A standard form saito ; dressel02 of a tight-binding monolayer Hamiltonian and overlap-integral matrix (that takes into account non-orthogonality of orbitals on adjacent atomic sites), , is
Here, parameter describes the strength of nearest-neighbor hopping yielding the Fermi velocity gammas , and is the lattice constant. The parameter describes non-orthogonality of orbitals, describes a possible asymmetry between and sites (thus opening a gap ). Note that here we neglected next-nearest neighbor hops which do not produce any visible change in the calculated spectra.
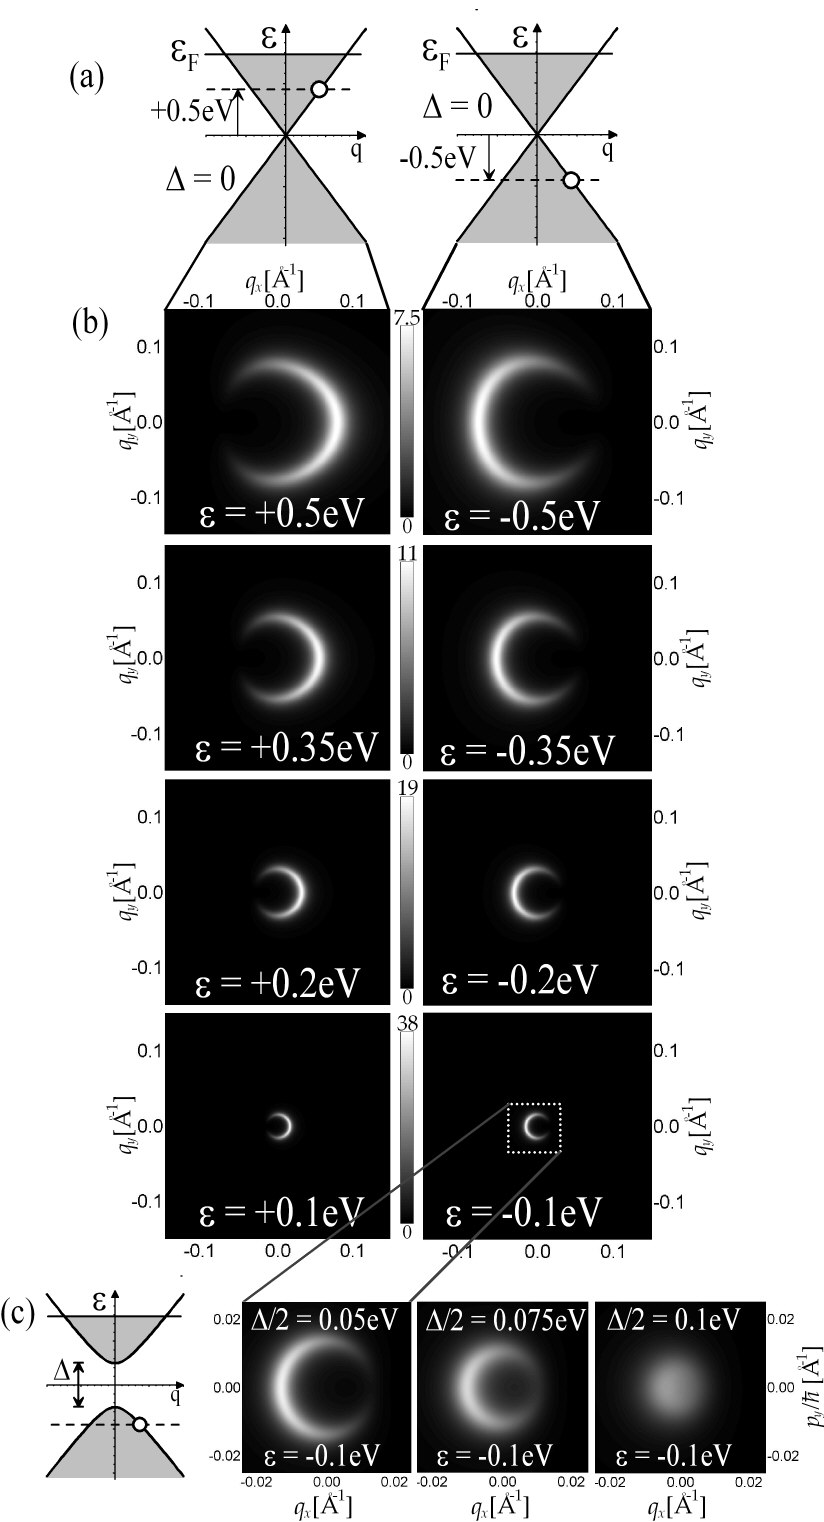
Figure 1(c) shows constant-energy intensity patterns (“maps”) at eV below the charge-neutrality point cnpoint in monolayer graphene, plotted as a function of photoelectron wave vector parallel to the surface of graphene, covering the whole Brillouin zone. Since the patterns in the vicinity of each Brillouin zone corner are the same, but rotated with respect to each other, we describe in detail what is happening around one Brillouin zone corner. Fig. 2(b) shows a series of plots demonstrating the evolution of the constant-energy map with energy for the valley . Each plot is for a different fixed energy from the charge-neutrality point with energies above (below) on the left (right) hand side. For states above the charge-neutrality point (left), the angular variation is where is the angle of the momentum measured from the center of the valley: comparison with Eq. (3) yields , illustrating that the isospin is parallel to the momentum . Fig. 2(b) (right) shows the intensity for emission from states below the charge-neutrality point in monolayer graphene. In this case, the patterns are flipped with respect to those of the left and comparison with Eq. (3) yields indicating that the isospin is antiparallel to the momentum .
Figure 2(c) shows the development of the fixed-energy intensity pattern as asymmetry of on-site lattice energies increases, opening a small gap in the spectrum. There are two principle effects on the ARPES spectrum. For energy gaps , the mixing of the wave functions between and sites destroys the perfect cancellation of the ARPES intensity, so that the ratio between the maximum and minimum intensity becomes finite [Fig. 2(c), left image]. As the gap increases towards the energy probed, the ARPES contour becomes smaller and the intensity anisotropy vanishes [Fig. 2(c), middle and right]. Thus, the opening of an asymmetry gap in the monolayer spectrum is accompanied by the loss of the chirality-related anisotropy of ARPES angular maps at low energies, which can be used not only as a strong test for the symmetry-breaking effect induced by a SiC substrate bost07b , but also as a probe of wave function mixing by asymmetry or trigonal warping. Unlike asymmetry, whose effects on the ARPES intensity are strongest near the charge-neutrality point, trigonal warping affects the ARPES spectral intensity only at very large energies.
For finite , an analytical, approximate description of the ARPES intensity can be developed as follows. For electronic energies much less than the -band width (),
| (7) |
and
where describes the strength of trigonal warping (we assume that ). This determines the spectrum
| (9) |
where () stand for the conduction (valence) band index, and, using Eq. (4), to the ARPES angular-dependent intensity
| (10) | |||||
where . Eqs. (9,10) contain the full dependence on valley and reciprocal lattice vector indices notw .
III Photoemission from bilayer graphene
III.1 The use of ARPES to determine the sign of interlayer coupling parameter
Bilayer graphene novo06 ; mcc06 ; ohta06 consists of two coupled hexagonal lattices with inequivalent sites and in the first and second graphene sheets, respectively, arranged according to Bernal (-) stacking mcc06 as shown in Fig. 3(a). As in the monolayer, the Brillouin zone has two inequivalent degeneracy points which determine two valleys centered around zero energy in the electron spectrum. Near the center of each valley the electron spectrum consists of four branches, Fig. 3(b), with two branches describing states on sublattices and that are split from zero energy by about , determined by the interlayer coupling , whereas two low-energy branches are formed by states based upon sublattices and .
To model bilayer graphene we use a tight-binding Hamiltonian matrix and overlap-integral matrix that operate in the space of coefficients at valley mcc06 ; guinea06 ; part06 :
| (15) | |||||
| (20) |
We adopt the notation of the Slonczewski-Weiss-McClure model slonweiss ; mcclure that is often used to describe bulk graphite, in order to parameterize the couplings relevant to bilayer graphene gammas . Nearest-neighbor coupling within each plane is parameterized by coupling [] and interlayer - coupling is described by . The parameter describes direct - interlayer coupling which leads to an effective velocity representing the magnitude of trigonal warping, particularly relevant at low energy [we assume that ]. Parameter describes - and - interlayer hopping. Using eV dressel02 ; parameters we found no noticeable effect of on the ARPES plots, and, for simplicity, we use throughout. Other weaker tunneling processes including next-nearest neighbor hopping are also neglected. The parameter describes non-orthogonality terms arising from overlaps between orbitals on different layers. Following numerical analysis, we found it also has no noticeable effect on the ARPES plots parameters . In the following angular maps we use . We note that some works on bilayer graphene use different definitions of the tight-binding parameters (for example, is defined with an additional minus sign in mcc06 ; mcc07 ; mcc07b , but it has no effect on their conclusions).
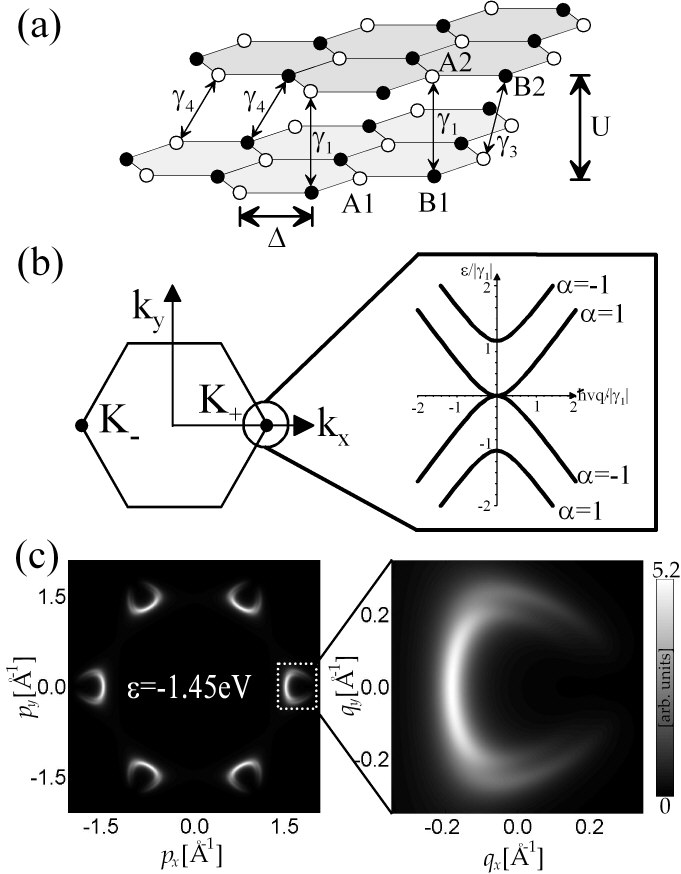
The Bloch function amplitudes and band energy , found using the Hamiltonian Eq. (20), can be used to model the photoemission intensity. Figure 3(c) shows constant-energy maps at eV below the charge-neutrality point cnpoint in bilayer graphene, with the plot on the left hand side showing values of covering the whole Brillouin zone. The patterns in each valley are the same, but rotated with respect to the others, so that we can focus on one of them, highlighted in Fig 3(c). The anisotropy of the bilayer pattern at this energy is similar to that of the monolayer, Fig. 1(c), because the energetic width obscures features associated with the presence of two bands. To observe differences between the two materials, we need to consider the ARPES patterns at energies closer to the charge-neutrality point.
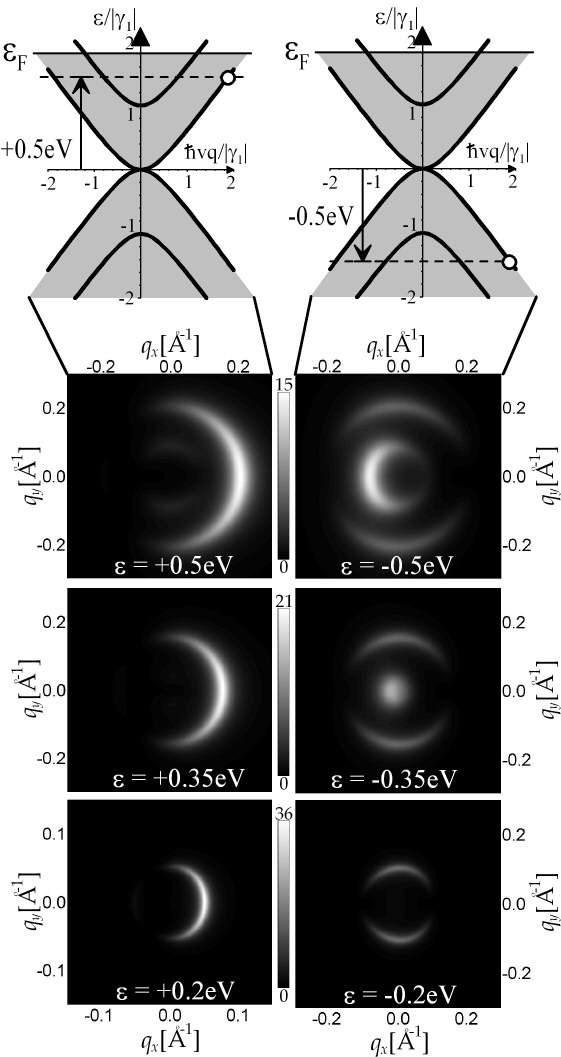
Figure 4 illustrates the evolution of the intensity pattern with energy. At energies greater than the interlayer coupling, (the top two patterns), there are two ring-like patterns, each corresponding to photoemission from states in two bands, whereas, for low-energies, (the bottom two patterns), there is a single ring corresponding to emission from the degenerate band only. Although these plots have been obtained using a complete bilayer Hamiltonian Eq. (20), it is convenient to discuss salient features of the results in Fig. 4 using an analytic formula, obtained by performing a linear-in-momentum expansion of , Eq. (7), and neglecting trigonal warping due to - interlayer coupling (), - and - interlayer coupling (), and non-orthogonality of orbitals (). In this case, the four bands in the bilayer spectrum are described by
| (21) |
where the parameters
identify the four bands: for the split bands with energy and for the low-energy ‘degenerate’ bands that touch at zero energy, while () indicates the conduction (valence) bands. Then, the contribution of a given band is
where
and
| (23) |
As the value of , Eq. (23), depends on the sign of the tight-binding parameter , comparison of the angular dependence of with experimental data provides a method to determine the sign of gammas . To demonstrate this, we make a comparison with our numerical data, plotted in Fig. 4. In this illustration, we assume that , which is a natural choice given the asymmetry of the orbitals of carbon. It shows how, for this choice of the sign of , the anisotropy of photoemission angular-maps differ in the split bands and degenerate bands at energies above and below the charge neutrality point. Note that changing the sign of to positive would lead to an interchange of plots illustrating the ARPES behavior at and .
The most pronounced feature of the ARPES angular maps, depicted for in Fig. 4, is that, for energies (left side of Fig. 4), photoemission spectra are dominated by states in the degenerate bands, , which are nicely described by the intensity profile . In contrast, for (valence bands, right side of Fig. 4), ARPES intensity from the degenerate band is weak, whereas the split band, at energies , produces a bright, dominant signal. If observed experimentally, such a behavior of ARPES maps in the conduction and valence bands would be indicative of a negative sign of the interlayer coupling gammas . If the experimentally-observed constant-energy maps were interchanged for negative and positive energies, it would be evidence for . Although the sign of has directly observable consequences for the ARPES pattern, tight-binding parameters for graphite published so far have assumed (char91 and references therein).
III.2 Electron chirality in the ARPES of bilayer graphene and the use of trigonal warping to determine the interlayer coupling parameter
The behavior of low-energy particles in bilayer graphene is perhaps even more remarkable novo06 ; mcc06 ; ohta06 than in a monolayer. The low-energy bands (at energy ) have a parabolic energy-versus-momentum relation and they support eigenstates of an operator with for electrons in the conduction band and for electrons in the valence band, where , which means that they are chiral, but with a degree of chirality different from that in the monolayer, with the isospin linked to, but turning twice as quickly as, the direction of momentum. An interpretation of the ARPES constant-energy maps in terms of two-source interference Eq. (3) predicts an angular variation like for states above the charge-neutrality point and for states below (for ).
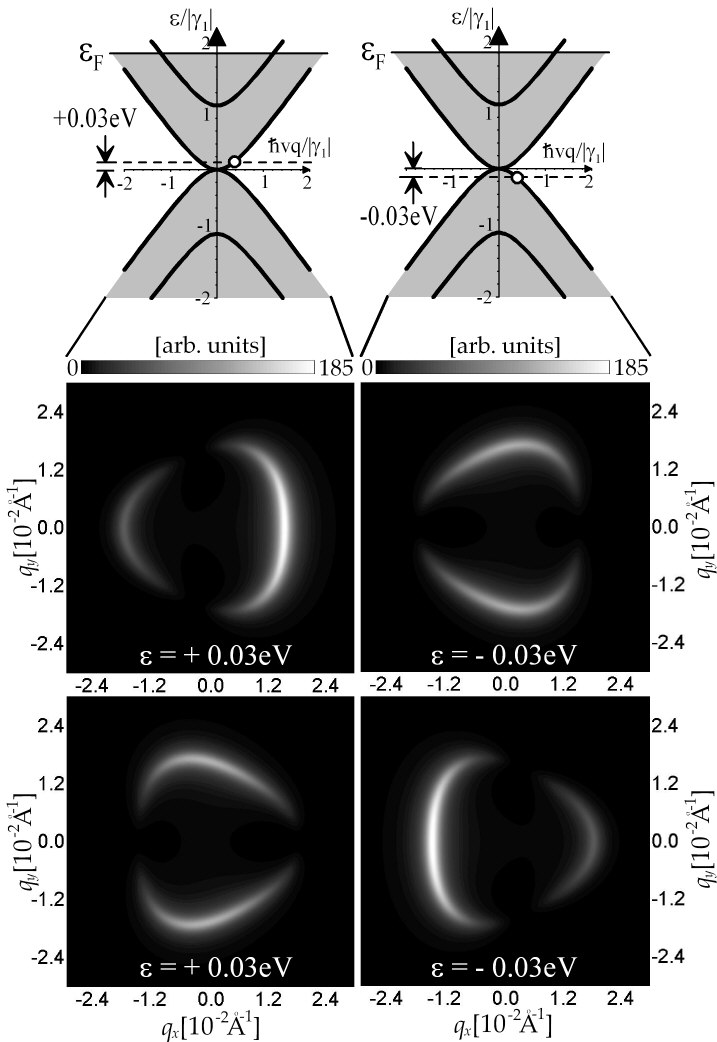
Figure 5 shows the calculated intensity of the photoemission in the vicinity of valley from states very close to the charge-neutrality point in bilayer graphene, at energy eV above (left-hand side) and eV below (right). We consider two different signs of the - interlayer coupling strength, , with eV (top) and eV (bottom). For and emission from the valence band (top right), the pattern is like as expected for two-source interference of chiral electron in bilayer graphene. As shown in Eq. (III.1) [and explained in detail in Section IV], the intensity from this band is not affected by corrections due to the presence of dimer orbitals (it has ). For emission from the conduction band (top left side of Fig. 5), the interference pattern has two peaks, but one of the peaks has about three times stronger maximum intensity than the other because of the presence of the contribution from dimer orbitals (this band has ) discuss . The bottom-left and bottom-right plots in Fig. 5 show the constant-energy maps for for emission above and below the charge-neutrality point, respectively. In this case, the intensity pattern for emission from the conduction band (bottom left) has two peaks with the same maximum intensity, arising from the interference of waves from the and sublattices. For emission from the valence band (bottom right) the peaks have different maximum intensities, owing to the interference of waves from four sublattices.
We note that, once the sign of is known, the sign of - interlayer coupling may also be deduced from the orientation of trigonal warping of the intensity patterns near the charge-neutrality point gammas . In bilayer graphene, there are two principle causes of trigonal warping. The first is the presence of - interlayer coupling that will tend to dominate at low energy, the second is higher-in-momentum terms in the function that will be important at large energy. The latter causes trigonal warping in monolayer graphene while the former is not present in a monolayer. At large energies, when the higher-in-momentum terms dominate, the orientation of trigonal warping is the same in bilayer graphene [e.g. Fig. 3(c)] as in a monolayer [e.g. Fig. 1(c)] whereas, at low energy, the orientation of trigonal warping in a bilayer depends on the sign of parameter (assuming that the sign of is known).
The orientation of trigonal warping flips on changing the sign of as seen by comparing the top and bottom plots in Fig. 5. At very low energy, , and in the absence of lattice asymmetry, the energy eigenvalues mcc06 are
| (24) |
where . This expression illustrates that the angular dependent factor, producing trigonal warping, depends on the sign of the ratio . In this paper we usually choose and to illustrate the possibility that the orientation of trigonal warping is different at lower energies [e.g. Fig. 5 (top)] than that at higher energies.
III.3 Substrate-induced asymmetry in bilayer graphene
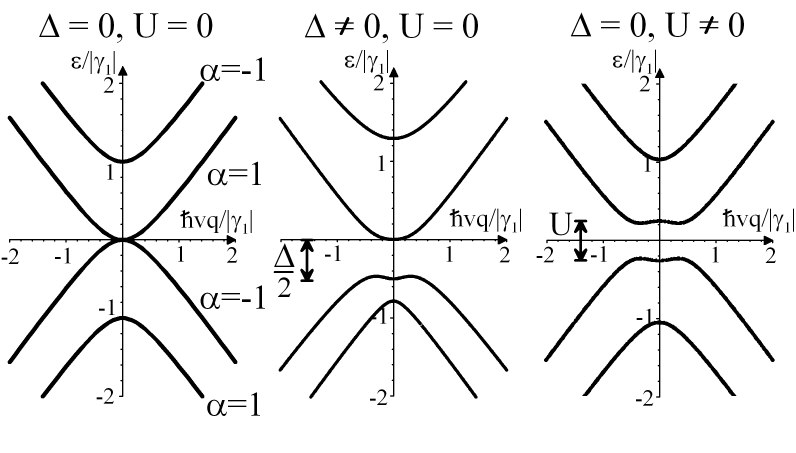
The Hamiltonian , Eq. (20), takes into account the possibility of different on-site energies through its diagonal components. Their effect may be understood by considering the eigenenergies exactly at the center of the valley where , namely , , or
Below, we distinguish between two types of asymmetry in bilayer graphene parameterized using the difference between on-site energies of adjacent atoms in the bottom layer due to the presence of a substrate, and interlayer asymmetry between on-site energies in the two layers arising from a doping effect and charge transfer to the substrate mcc06 ; ohta06 ; guinea06 ; mcc06b ; min07 ; castro ; aoki07 ; mcc07 ; guinea07 ; mcc07b ; guinea07b .
In Fig. 6 (center), the band structure in the vicinity of the K point is plotted in the presence of substrate-induced asymmetry [the plot is shown for and ]. This type of asymmetry introduces a gap as well as electron-hole asymmetry. In Fig. 6 (right), the band structure in the vicinity of the K point is plotted in the presence of interlayer asymmetry . It does not break electron-hole symmetry, but introduces a gap .
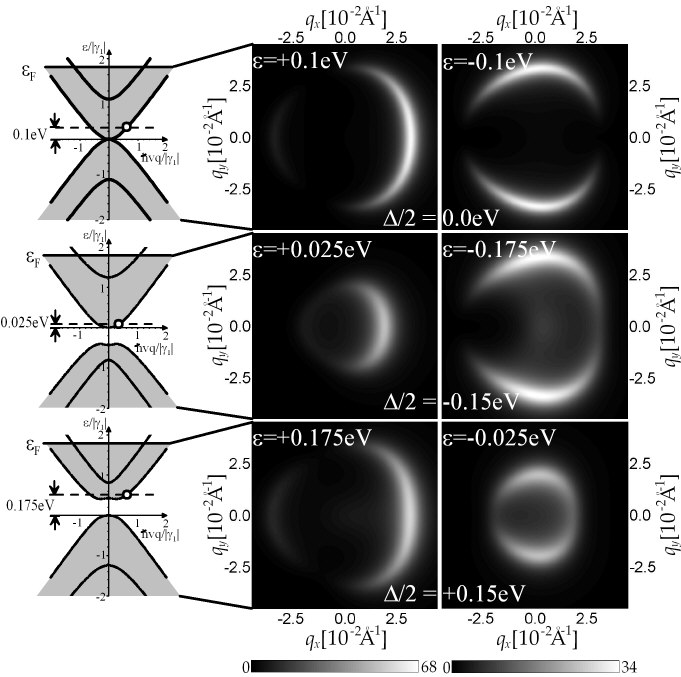
As illustrated in Fig. 7, the constant energy maps are sensitive both to the magnitude and sign of the asymmetry . The plots on the left (right) side of Fig. 7 show constant energy maps for photoemission from conduction (valence) band states at energy eV above (below) the midgap energy. The top two plots are for no asymmetry , the middle two plots show negative asymmetry eV, and the bottom two show positive asymmetry eV. As for the monolayer, one effect of asymmetry is to impair the two-source interference resulting in a weakening of the angular anisotropy of the intensity pattern. The ‘Mexican hat’ structure of the valence band for negative , and the conduction band for positive , is manifested in the larger ARPES contour for emission from these states (shown on the middle right and the bottom left, respectively) as opposed to their counterparts in the other band (middle left and the bottom right, respectively). Experimentally, such a difference in the size and nature of the ARPES contour for emission from conduction or valence bands (at the same distance from the midgap energy) would indicate the presence and sign of intralayer asymmetry .
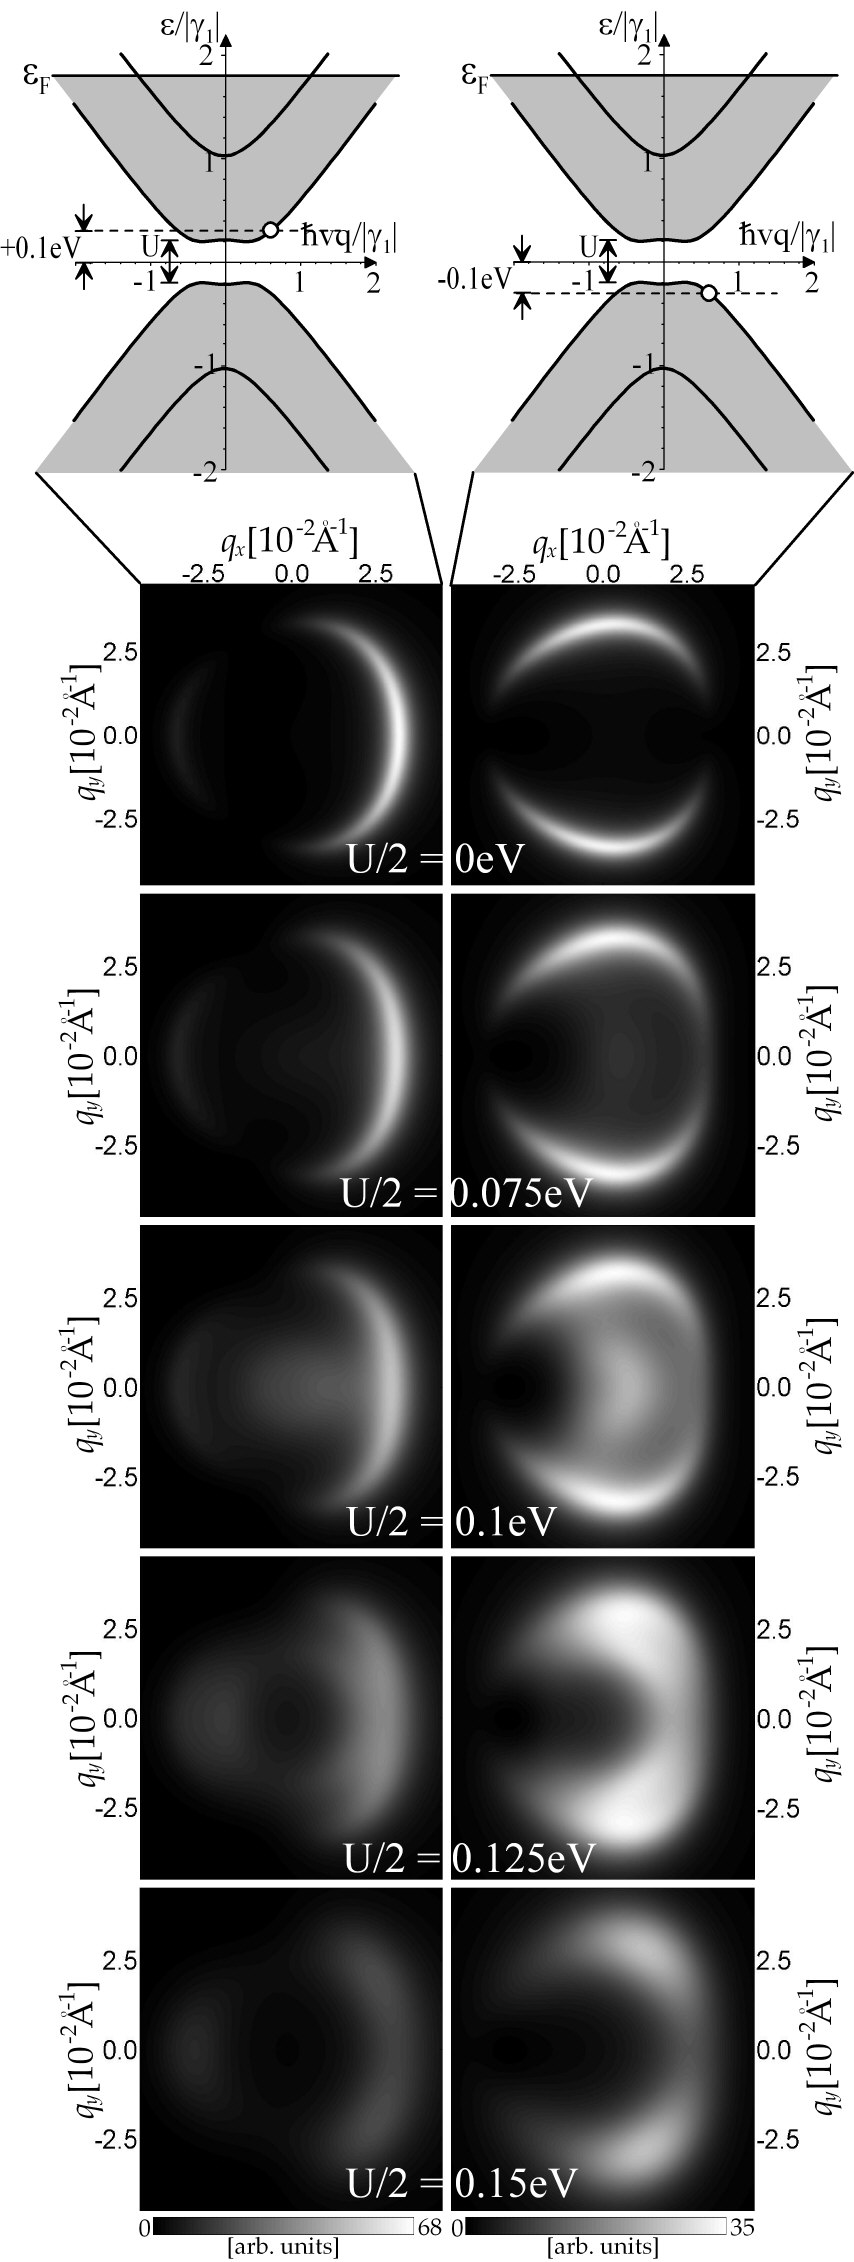
Since interlayer asymmetry results in a gap that preserves electron-hole symmetry and does not depend on the sign of , the constant-energy photoemission maps are sensitive to the magnitude of but not its sign. Figure 8 shows constant energy maps for photoemission from conduction band states at energy eV above the charge-neutrality point (left hand side) and from valence band states at energy eV below the charge-neutrality point (right) as increases in magnitude. Generally, the effect of asymmetry is to weaken the angular anisotropy of the intensity pattern. Both the conduction and valence band in the vicinity of the charge neutrality point display a ‘Mexican hat’ structure mcc06 ; guinea06 ; mcc06b , leading to relatively large ARPES contours (and additional features as seen in the plot at eV), in contrast to asymmetry , Fig. 7, where the ‘Mexican hat’ structure appears in one band only.
IV Discussion
Our numerical data for bilayer graphene, Figs. 4,5, show that the anisotropy of photoemission angular-maps differ in the split bands and degenerate bands at energies above (left side of Fig. 4) and below (right side of Fig. 4) the charge neutrality point. These plots may be interpreted in terms of the interference of photoelectron waves emitted from four non-equivalent sublattices. In fact, for two of the four bands, the parameter in Eq. (III.1), so that the contribution of orbitals on the ‘dimer’ sites and cancel, leaving only the contribution of two terms in that arise from orbitals on sites and . For the other two bands, , the contribution of orbitals on the ‘dimer’ sites and to do not cancel, but interfere with the contribution of orbitals on sites and , producing a different angular dependence and greater peak intensity than for .
As the value of , Eq. (23), depends on the sign of , comparison of the angular dependence of with experimental data provides a method to determine the sign of gammas . To demonstrate this, we make a comparison with our numerical data, plotted in Fig. 4. For the sign of that we adopt in the numerics (), the split band above the charge-neutrality point has so the intensity from this band appears as a very faint ring (that of smaller radius) in the plot at energy eV in Fig. 4. The degenerate band at this energy, however, has so the intensity from it appears as the ring of larger radius with larger peak intensity. As the energy drops below , left side of Fig. 4, the contribution of the split band disappears to leave only the ring arising from the degenerate band with . The energy has to approach the charge-neutrality point before the contribution of the dimer sites and , small in the parameter , weakens to reveal an anisotropy pattern characteristic of two source interference in bilayer graphene, as explained in Section III.2 discuss .
The picture is quite different for energies below the charge-neutrality point (right side of Fig. 4). In this case the split band has so that the intensity from it appears as the ring (of smaller radius) with larger peak intensity at energy eV in Fig. 4. The degenerate band has so the intensity from it appears as the fainter ring (that of larger radius) at energy eV. As the energy increases above , right side of Fig. 4, the contribution of the split band disappears to leave only the ring arising from degenerate band with . This is why the intensity pattern is much easier to detect below the charge-neutrality point than above it. In fact, whether it is easily visible above or below the charge-neutrality point depends on the sign of (here we chose ) so the experimental observation of the anisotropy will provide a way to determine the sign of - interlayer coupling in bilayer graphene.
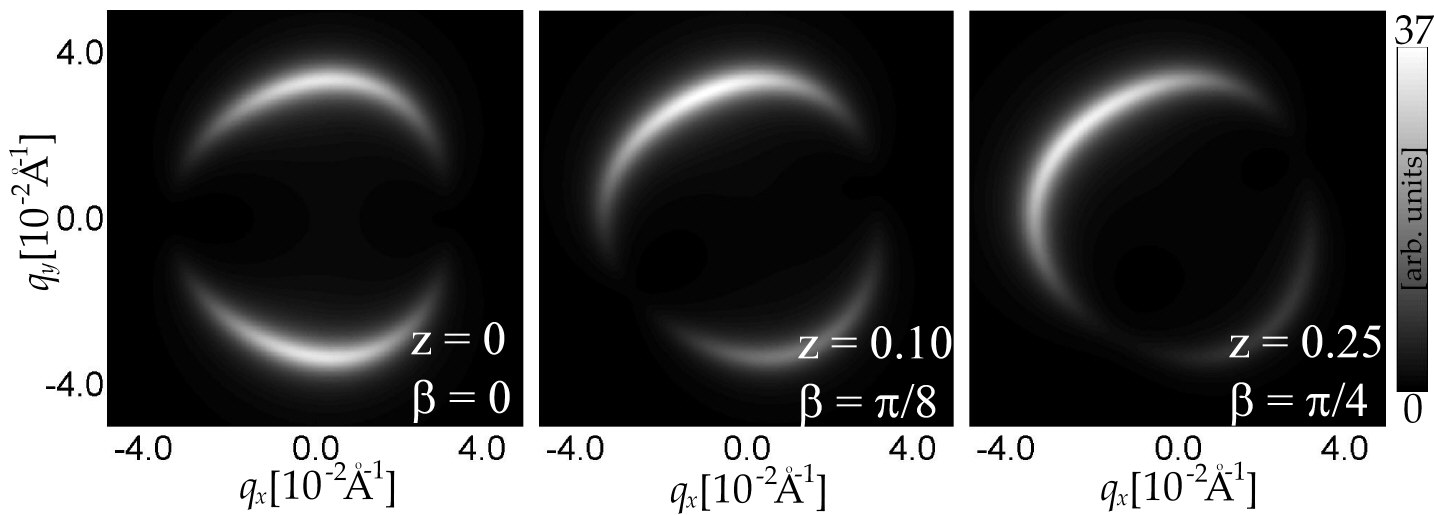
Finally, we note that the anisotropy of the constant-energy maps may be influenced by other factors not modeled here. For example, when the component of photoelectron momentum perpendicular to the bilayer sample is large, we expect that photoelectron waves emitted from the bottom layer will be attenuated with respect to those emitted from the top layer. To obtain an impression of the typical kind of effect, we introduced an exponential attenuation [described by factor where are real parameters] of waves from the bottom layer. As shown in Fig. 9 for photoemission from states at energy eV below the charge-neutrality point in bilayer graphene, the attenuation results in a destruction of the double-peaked intensity pattern and the phase factor has the effect of rotating the whole pattern.
V Conclusions
Using Fermi’s Golden Rule, we modeled the anisotropy of the intensity of photoemission constant-energy maps at low energy in graphene and demonstrated that the anisotropy is a manifestation of electronic chirality. In monolayer graphene, photoemission may be viewed as a two-source interference experiment, à la Young’s double slits, the sources being two inequivalent lattice sites in the unit cell. The resulting intensity displays a single-peaked dependence on the direction of momentum described by angle . In bilayer graphene, the interference of emitted photoelectron waves from four atomic sites produces single- or double-peaked constant-energy maps, depending on the energy of the initial state in graphene. The marked contrast between the anisotropy for emission from the conduction or the valence band at energies below the - interlayer coupling strength, parameterized by gammas , provides an experimental method to determine the magnitude and sign of parameter .
The shape of the photoemission constant-energy maps is determined by the trigonal warping effect in graphene. In monolayers and bilayers, the iso-energetic line changes from an almost-circular to a triangularly-warped shape as the energy increases: the extent of such warping is controlled by the dimensionless parameter , where is the magnitude of the wave vector measured from the center of the valley and is the lattice constant. In bilayer graphene, strong trigonal warping may also occur at low energy because of - interlayer coupling, parameterized by gammas , and the observation of this latter trigonal warping provides an experimental method to determine the magnitude and sign of parameter .
Measurement of the anisotropy of the intensity of photoemission constant-energy maps provides a method to characterize realistic graphene samples. As an example, we take into account substrate-induced asymmetry that impairs the two-source interference in monolayer graphene, resulting in a weakening of the angular anisotropy of the intensity pattern. Analysis of recent experimental data bost07b ; zhou07 in terms of the anisotropy of constant-energy maps may help to shed light on the possible presence of asymmetry in graphene grown epitaxially on SiC substrate. In bilayers, both substrate-induced asymmetry and interlayer asymmetry alter the interference pattern: we describe measurable differences between them. This illustrates the potential of photoemission in the future characterization of few-layer graphene samples.
VI Acknowledgements
The authors thank B.L. Altshuler, T. Ando, F. Guinea, and A. Lanzara for discussions. This project has been funded by EPSRC Portfolio Partnership EP/C511743/1, EPSRC First Grant EP/E063519/1, ESF FoNE project SpiCo EP/D062918/1, the Royal Society, and the Daiwa Anglo-Japanese Foundation. The Advanced Light Source is supported by the Director, Office of Science, Office of Basic Energy Sciences, of the U.S. Department of Energy under Contract No. DE-AC02-05CH11231. V. Fal’ko also acknowledges support from the Alexander von Humboldt Foundation and hospitality of the University of Hannover.
References
- (1) P.R. Wallace, Phys. Rev. 71, 622 (1947).
- (2) J.C. Slonczewski and P.R. Weiss, Phys. Rev. 109, 272 (1958).
- (3) J.W. McClure, Phys. Rev. 108, 612 (1957); ibid. 119, 606 (1960).
- (4) D. DiVincenzo and E. Mele, Phys. Rev. B 29, 1685 (1984).
- (5) G.W. Semenoff, Phys. Rev. Lett. 53, 2449 (1984).
- (6) T. Ando, T. Nakanishi, and R. Saito, J. Phys. Soc. Japan 67, 2857 (1998).
- (7) K.S. Novoselov, A.K. Geim , S.V. Morozov, D. Jiang, Y. Zhang, S.V. Dubonos, I.V. Grigorieva, and A.A. Firsov, Science 306, 666 (2004).
- (8) K.S. Novoselov, A.K. Geim, S.V. Morozov, D. Jiang, M.I. Katsnelson, I.V. Grigorieva, S.V. Dubonos, and A.A. Firsov, Nature 438, 197 (2005).
- (9) Y. Zhang, Y.W. Tan, H.L. Stormer, and P. Kim, Nature 438, 201 (2005).
- (10) K.S. Novoselov, E. McCann, S.V. Morozov, V.I. Fal’ko, M.I. Katsnelson, U. Zeitler, D. Jiang, F. Schedin, and A.K. Geim, Nature Phys. 2, 177 (2006).
- (11) A. Bostwick, T. Ohta, T. Seyller, K. Horn, and E. Rotenberg, Nature Phys. 3, 36 (2007).
- (12) S.Y. Zhou, G.-H. Gweon, J. Graf, A.V. Fedorov, C.D. Spataru, R.D. Diehl, Y. Kopelevich, D.-H. Lee, S.G. Louie, and A. Lanzara, Nature Phys. 2, 595 (2006).
- (13) T. Ohta, A. Bostwick, T. Seyller, K. Horn, and E. Rotenberg, Science 313, 951 (2006).
- (14) T. Ohta, A. Bostwick, J.L. McChesney, T. Seyller, K. Horn, and E. Rotenberg, Phys. Rev. Lett. 98, 206802 (2007).
- (15) A. Bostwick, T. Ohta, J.L. McChesney, K. V. Emtsev, T. Seyller, K. Horn, and E. Rotenberg, New J. Phys. 9, 385 (2007).
- (16) S.Y. Zhou, G.-H. Gweon, A.V. Fedorov, P.N. First, W.A. de Heer, D.-H. Lee, F. Guinea, A.H. Castro Neto, and A. Lanzara, Nature Materials 6, 770 (2007).
- (17) A. Bostwick, T. Ohta, J.L. McChesney, T. Seyller, K. Horn, and E. Rotenberg, Solid State Commun. 143, 63 (2007).
- (18) A. Bostwick, T. Ohta, J.L. McChesney, T. Seyller, K. Horn, and E. Rotenberg, Eur. Phys. J. Special Topics 148, 5 (2007).
- (19) C.-H. Park, F. Giustino, M.L. Cohen, and S.G. Louie, Phys. Rev. Lett. 99, 086804 (2007).
- (20) M. Calandra and F. Mauri, arXiv:0707.1467.
- (21) W.-K. Tse and S. Das Sarma, arXiv:0707.3651.
- (22) M. Polini, R. Asgari, G. Borghi, Y. Barlas, T. Pereg-Barnea, and A.H. MacDonald, arXiv:0707.4230.
- (23) E. McCann and V.I. Fal’ko, Phys. Rev. Lett. 96, 086805 (2006).
- (24) F. Guinea, A. H. Castro Neto, and N. M. R. Peres, Phys. Rev. B 73, 245426 (2006).
- (25) E. McCann, Phys. Rev. B 74, 161403 (2006).
- (26) H. Min, B.R. Sahu, S.K. Banerjee, and A.H. MacDonald, Phys. Rev. B 75, 155115 (2007).
- (27) E.V. Castro, K.S. Novoselov, S.V. Morozov, N.M.R. Peres, J.M.B. Lopes dos Santos, J. Nilsson, F. Guinea, A.K. Geim, and A.H. Castro Neto, cond-mat/0611342.
- (28) M. Aoki and H. Amawashi, Solid State Commun. 142, 123 (2007).
- (29) E. McCann, D.S.L. Abergel, and V.I. Fal’ko, Solid State Commun. 143, 110 (2007).
- (30) F. Guinea, A. H. Castro Neto, and N. M. R. Peres, Solid State Commun. 143, 116 (2007).
- (31) E. McCann, D.S.L. Abergel, and V.I. Fal’ko, Eur. Phys. J. Special Topics 148, 15 (2007).
- (32) F. Guinea, A. H. Castro Neto, and N. M. R. Peres, Eur. Phys. J. Special Topics 148, 117 (2007).
- (33) F. Varchon, R. Feng, J. Hass, X. Li, B.N. Nguyen, C. Naud, P. Mallet, J.-Y. Veuillen, C. Berger, E.H. Conrad, and L. Magaud , Phys. Rev. Lett. 99, 126805 (2007).
- (34) E.L. Shirley, L.J. Terminello, A. Santoni, and F.J. Himpsel, Phys. Rev. B 51, 13614 (1995).
- (35) F.J. Himpsel, Adv. Phys. 32, 1 (1983).
- (36) We define the charge-neutrality point as the position of the Fermi level in nominally undoped graphene and we set this position as that of zero energy. In monolayer graphene, this is often called the Dirac point.
- (37) R. Saito, G. Dresselhaus, and M.S. Dresselhaus, Physical Properties of Carbon Nanotubes (Imperial College Press, London, 1998).
- (38) M.S. Dresselhaus and G. Dresselhaus, Adv. Phys. 51, 1 (2002).
- (39) The tight-binding parameters are defined as where is an atomic orbital located on site , , , and . These definitions agree with those of the Slonczewski-Weiss-McClure model of graphite slonweiss ; mcclure . Note that the parameters describing interlayer hopping (, , and ) enter the Hamiltonian of the Slonczewski-Weiss-McClure model with an additional factor of two that takes into account the greater number of neighboring graphene planes in bulk graphite as compared to bilayer graphene.
- (40) In the absence of trigonal warping , the intensity Eq. (10) in the presence of asymmetry at low energy in monolayer graphene simplifies as .
- (41) B. Partoens and F.M. Peeters, Phys. Rev. B 74, 075404 (2006).
- (42) We studied the influence of parameters and on the intensity pattern for emission at a fixed energy eV below the charge-neutrality point in bilayer graphene (as in Figs. 7, 8, 9). We found no noticeable effect for values eV and .
- (43) J.-C. Charlier, X. Gonze, and J.-P. Michenaud, Phys. Rev. B 43, 4579 (1991).
- (44) For emission from the conduction band at very low energy (top left side of Fig. 5), the interference pattern has two peaks [roughly like ], but one of the peaks has about three times stronger maximum intensity than the other. The reason is that corrections due to the presence of dimer orbitals are small (in parameter ), but finite (this band has ). Their influence may be estimated by considering the function , Eq. (III.1). Comparing the maxima of the two peaks, at angles and , gives . For the energy considered on the top left side of Fig. 5, where , then . So, although this is ‘small’, it yields .