11email: A.L.Melchior@obspm.fr,Francoise.Combes@obspm.fr 22institutetext: Université Pierre et Marie Curie-Paris 6, 4, Place Jussieu, F-75 252 Paris Cedex 05, France
CO investigation of galaxies
We report on the results of an IRAM-30m search for CO emission lines in three galaxies at intermediate redshifts. The idea was to investigate the molecular content of galaxies bright in the infrared at , a redshift desert for molecular line studies, poorly investigated as of yet. We integrated 8-10h per source and did not succeed in detecting any of the sources. From our upper limits, we are able to constrain the molecular gas content in these systems to less than to , assuming a CO-to-H2 conversion factor ( M⊙/(K km s-1 pc2)). We stress the current difficulty of selecting sources with a detectable molecular content, a problem that will be faced by the ALMA First Science projects.
Key Words.:
infrared: galaxies – radio lines: galaxies – submillimetre – galaxies: general – methods: observational1 Introduction
Our current knowledge of the molecular content of galaxies at is currently limited to a fraction of the submillimetre bright objects (Solomon & Vanden Bout, 2005; Greve et al., 2005), usually selected on the basis of their strong infrared (IR) luminosity. The extent to which active galactic nuclei (AGN) contribute to these extreme infrared luminosity is currently a matter of debate. While the interpretation of the IR-radio correlation in terms of on-going star formation is commonly accepted (Condon et al., 1991; Condon, 1992; Yun et al., 2001), this explanation remains uncertain (e.g. Vlahakis et al., 2007). The evidence that, in the strongest infrared sources, a significant fraction of the infrared luminosity is due to AGN (Genzel & Cesarsky, 2000; Alexander et al., 2005) further complicates the interpretation of this correlation. Farrah et al. (2003) have shown a correlation of the AGN and starburst luminosities over a wide range of IR luminosities. The recent detection of a molecular torus in Arp 220 (Downes & Eckart, 2007) demonstrates that the true source of at least part of its infrared luminosity is due to a black hole accretion disc, while this galaxy was considered as a prototypical starburst. Hence, there is the possibility that the infrared luminosity is not a good tracer of star formation activity, which is quite troublesome because this is nevertheless the most reliable and easy tracer used so far (at least unbiased by dust extinction).
In this complex context, the detection of molecular gas emission is essential to get information about the mass and dynamics of these galaxies, and to confirm the huge star formation rates (750-1000 M⊙ yr-1) usually derived for (sub)millimetre galaxies. Ultimately, this will contribute to further constrain the scenario of hierarchical galaxy formation and evolution. However, the current sensitivities are relatively low and require configurations with huge amount of gas. Different types of samples have been investigated so far, with various success. On the one hand, Evans et al. (2006), in their study of molecular gas in quasi-stellar objects , found a low CO to infrared luminosity ratio, suggesting that the infrared luminosities of these QSO might be dominated by the AGN component. Saripalli & Mack (2007) failed to detect any molecular gas in restarting radio galaxies at . On the other hand, for the high-z galaxies with a CO detection, starbursts and AGN do not exhibit significant differences in their molecular gas content (Solomon & Vanden Bout, 2005; Greve et al., 2005). However, there is a clear difference in the CO line widths, a factor of 2.3 narrower in velocity in QSO host galaxies with respect to submillimetre galaxies, while powerful radio galaxies fall in between (Greve et al., 2005; Carilli & Wang, 2006). The origin of this effect is not yet clear: it could be due to a systematic in the orientation of the QSO, but the possibility of merger signatures in submillimetre galaxies is not excluded.
The redshift range corresponds to a key period of the star formation history of the Universe: the end of the Star Formation plateau (e.g. Madau et al., 1998; Dahlen et al., 2007) converging to the nearby galaxy population. This range has been poorly investigated in CO so far due to the lack of appropriate detectors and is known as a redshift desert for molecular studies. This desert is due to the presence of atmospheric lines (O2), which prevent the detection of CO(1-0) below 81 GHz. (A similar situation was observed in optical spectroscopy for galaxies with (Steidel et al., 2004).) However, while most sources detected in CO are magnified, the lower redshift range is relatively more favourable to CO detection because there is no negative K-correction for CO (Combes et al., 1999).
In this paper, we discuss the search for CO emission lines in three galaxies at intermediate redshifts, in order to investigate the molecular gas content of galaxies bright in the infrared at .
Throughout this paper, we adopt a flat cosmology, with , and km s-1 Mpc-1 (Spergel et al., 2007).
| Source | RA (J2000) | DEC (J2000) | LIR ( L☉) | L ( L☉) L | Type | Redshift | (Gpc) | Ref. |
|---|---|---|---|---|---|---|---|---|
| CFRS 14.1329 | 14:17:34.8 | +52:27:52.0 | b | LIRG | 0.375 | 1.96 | 1, 2 | |
| CFRS 14.1157 | 14:17:41.9 | +52:28:24.0 | ULIRG | 1.149 | 7.84 | 3, 2 | ||
| NGP9 F268-0341339 | 12:28:47.4 | +37:06:12.3 | QSO, synch. | 1.515 | 11.12 | 4 |
2 Source selection
We initially defined a sample of star-forming galaxies from the
Canada France Redshift Survey (CFRS, Lilly et al., 1995). We chose
galaxies with an infrared-based star formation tracer indicating
a SFR larger than 100 M⊙ yr-1
(Flores et al., 1999; Hammer et al., 1995). We also considered a subset of
strong radio-sources from the FIRST survey, for which redshifts
were available. In total,
three sources were observed: CFRS 14.1329 and CFRS 14.1157 (two
sources from the CFRS with ISO and VLA detections) and
NGP9 F268-0341339 (a flat spectrum radio galaxy selected from the
FIRST survey).
The infrared luminosities111Please note that
throughout the paper, LIR is defined as the integral of the flux
between 8 and 1000m, while SFR (Kennicutt, 1998). Following
Elbaz et al. (2002), we took ,
where is defined in the range 40-120m.., available for
the CFRS sources (Zheng et al., 2004, Le Floc’h, priv. comm.), are
provided in Table 1 together with the other (updated)
known characteristics of these galaxies. Appendices A
and B provide more details about CFRS 14.1329 and
NGP9 F268-0341339.
3 CO Observations and reduction of the data
We observed at IRAM-30m in May 2000 CO lines in the following galaxies: CFRS 14.1329, CFRS 14.1157 and NGP9~F268-0341339. Table 1 displays their main properties.
Wobbler-switching mode was used, with reference positions offset in azimuth by 90″ for CFRS 14.1329 and CFRS 14.1157 and 200″ for NGP9~F268-0341339. At 1 and 3 mm, we used respectively 1 MHz filterbank and the autocorrelator (1.25 MHz/channel) with bandwidths of 512 and 640 MHz.
The reduction was performed by the IRAM GILDAS software222http://www.iram.fr/IRAMFR/GILDAS. For each line, the spectra have been added and a polynomial of order 1 has been fitted and subtracted.
3.1 CFRS 14.1329
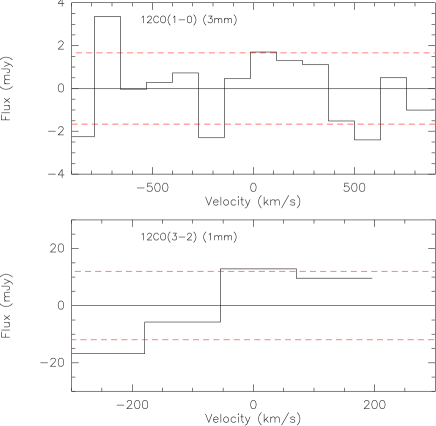
We searched for the CO(1-0) line at 83.83 GHz and the CO(3-2) line at 251.49 GHz, relying on the spectroscopic redshift . At these frequencies, the telescope’s half-power beam widths are respectively 29″ and 9.1″. We integrated 8.5 h on this source, with typical system temperatures of 203 K and 1117 K (on the T scale). The observing conditions were not very stable (wind). We calibrated the spectra using the standard S/T factors: 6.0 and 9.2 Jy K-1. As displayed in Fig. 1, we do not detect any line at the 1.7 and 12.0 mJy (rms) level.
3.2 CFRS 14.1157
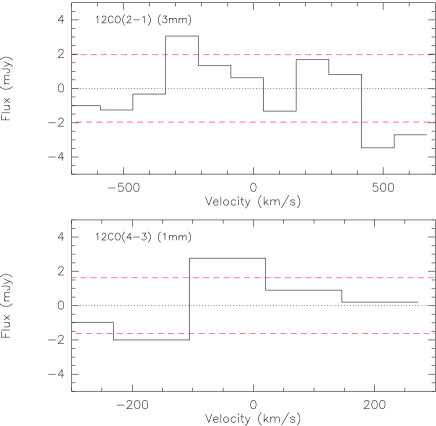
We searched for the CO(2-1) line at 107.28 GHz and the CO(4-3) line at 214.54 GHz, relying on the spectroscopic redshift . At these frequencies, the telescope’s half-power beam widths are respectively 22″ and 12″. We integrated 7.8 h on this source, with typical system temperatures of 147.8 K and 324.1 K (on the T scale). We calibrate the spectra using the standard S/T factors: 6.3 and 7.9 Jy K-1. As displayed in Fig. 2, we do not detect any line at the 1.8 and 3.7 mJy (rms) level. There is obviously some structures in the baseline at 107.28 GHz. However, this bump is too weak to claim any detection and is most probably due to variable baselines, so we do not apply any correction.
3.3 NGP9 F268-0341339
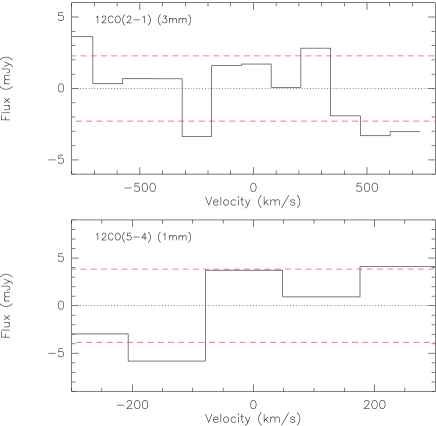
We searched for the CO(2-1) line at 91.670 GHz and the CO(5-4) line at 229.130 GHz, relying on the spectroscopic redshift . At these frequencies, the telescope’s half-power beam widths are respectively 27″and 11″. We integrated 10.3 h on this source, with typical system temperatures of 147 K and 495 K (on the T scale). The observing conditions were not very stable. We calibrated the spectra using the standard S/T factors: 6.1 and 8.6 Jy K-1. As displayed in Fig. 3, we do not detect any line at the 2.3 and 3.8 mJy (rms) level.
4 Analysis
Given the secure spectroscopic optical redshift and the large bandwidth at 3 mm, we do not expect a large velocity shift, which could explain this missing CO emission. Very few galaxies (usually at ) present a CO-line width (FWHM) larger than 1000 km s-1. We would have detected a signal at 3 mm given our reduction procedure.
Following Seaquist et al. (1995), we calculate upper limits on the velocity-integrated line fluxes using:
| (1) |
where is the channel-to-channel dispersion (rms) computed in Jy for a given channel width (in km s-1) and is the (expected) line width in km s-1. For the latter, we assumed a value of 300 km s-1. These upper limits are calculated from the final, binned spectra shown in Fig. 1, 2 and 3.
From the upper limits on the velocity-integrated line fluxes, the corresponding constraints on CO line luminosities are computed as:
| (2) |
where is the CO-line luminosity expressed in K km s-1 pc2, is the rest frequency of the line in GHz, and the luminosity distance in Mpc (Wright, 2006).
We expect that the CO flux () is increasing as for the first CO lines, for a given H2 mass, as derived for starbursts by Combes, Maoli Omont (1999). The ratios , , and are thus taken to be equal to 1. This assumes that the lines are thermalised at high temperature and optically thick. For objects like quiescent nearby galaxies our upper values should be multiplied by a factor up to 1.1 (Braine & Combes, 1992), 1.6 (Devereux et al., 1994), 2.2 and 4.8 (Papadopoulos et al., 2000). However, our galaxies are probably starbursts not representative of nearby sources, so we do not apply any correction.
| Lines | CFRS 14.1329 | Lines | CFRS 14.1157 | Lines | NGP9~F268-0341339 |
|---|---|---|---|---|---|
| Upper limits on (Jy km s-1) | |||||
| CO(1-0) | CO(2-1) | CO(2-1) | |||
| CO(3-2) | CO(4-3) | CO(5-4) | |||
| Raw upper limits on K km s-1 pc2) | |||||
| CO(1-0) | CO(2-1) | CO(2-1) | |||
| CO(3-2) | CO(4-3) | CO(5-4) | |||
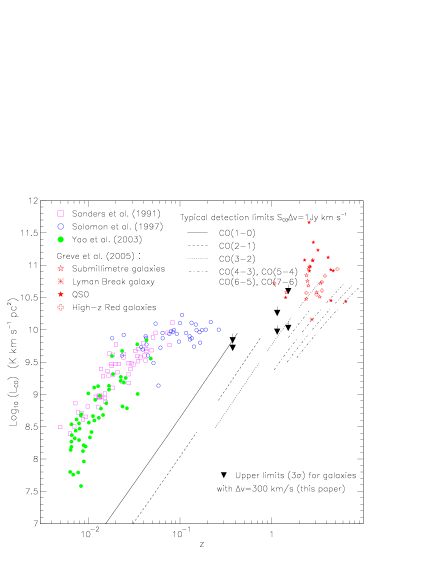
Figure 4 displays the upper limits derived from our observations on , compared to previous detections of submillimetre galaxies detected in CO (Greve et al., 2005; Yao et al., 2003; Solomon et al., 1997; Sanders et al., 1991). These limits can be compared to the IRAM-30m best detection limits. They are displayed in Fig. 4 and correspond to S Jy km s-1 for various CO lines achieved at IRAM-30m. They illustrate the coverage of CO(1-0) measurements and the complementarity of the other CO transition lines.
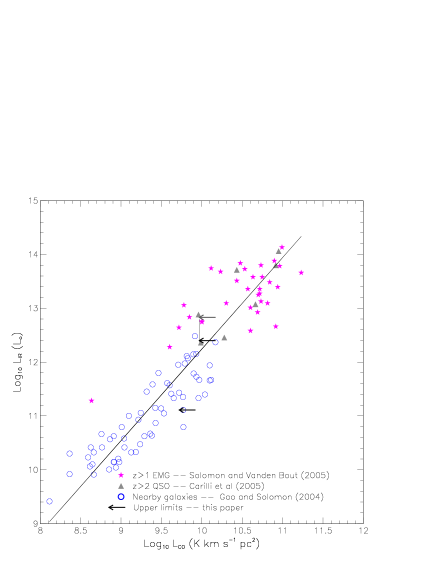
Fig. 5 exhibits the correlation between the infrared and CO luminosities. The upper limits are consistent with the IR-CO correlation given its significant scatter. The two arrows provided for CFRS 14.1157 correspond to the total IR luminosity and to the sole contribution of the starburst, as discussed in Sect. 5.
5 Discussion
The non-CO detections discussed here reveal the difficulties of selecting favourable candidates. The scatter of the correlation between the IR and CO luminosities (see Fig. 5) is large and probably linked to the fact that the IR luminosities does not trace the star formation activity only. In addition, it is difficult to obtain IR luminosities, given the lack of all-sky survey since IRAS. The only solution has been here to rely on IR luminosities derived from shorter wavelength measurements (namely 15m Flores et al., 1999; Zheng et al., 2004).
The lack of CO detections towards CFRS 14.1329 and NGP9~F268-0341339 is probably due to the fact that they are not as good candidates as we initially thought. As explained in Appendix A, CFRS 14.1329 had been selected on the basis of a favourable luminosity (Flores et al., 1999), which was subsequently revised (Zheng et al., 2004). We also discussed in Appendix B that NGP9~F268-0341339 is behind a foreground galaxy at with SFR yr-1.
From our upper limits on the CO(1-0) and CO(3-2) luminosities, we estimate that the molecular gas content333Following Solomon & Vanden Bout (2005), our molecular gas content estimates account for the He mass. of CFRS 14.1329 is smaller than and , assuming a molecular gas mass to CO luminosity ratio K km s-1pc, typical of ultraluminous infrared galaxies (ULIRG) (e.g. Solomon & Vanden Bout, 2005). These total molecular gas masses are consistent with the gas content of local normal spiral galaxies (Gao & Solomon, 2004), while the infrared luminosity (derived from 15 m data) was suggesting a luminous infrared galaxy (LIRG). Hence, the value of is uncertain and probably underestimated. For the more distant galaxy NGP9~F268-0341339, the limits are less stringent and it is still compatible with an (U)LIRG. With the same assumptions, the molecular mass is smaller than and according to our upper limits on the CO(2-1) and CO(5-4) luminosities. The luminosities derived from higher CO line transitions are more stringent than those derived from the lower ones as we assumed that the lines were optically thick (see also Sect. 4).
In contrast, CFRS 14.1157 was a very favourable candidate that has remained as such. Zheng et al. (2004) estimated (SFR M☉ yr-1), relying on the IR-15m luminosities correlation measured by Elbaz et al. (2002). Le Floc’h et al. (2007) published a panchromatic spectral energy distribution of this galaxy with a very good wavelength coverage. They derived a direct estimate444Please note that Le Floc’h et al. (2007) worked with the 1-1000 m range. In this paper, we adapted their figures to the 8-1000m range used here, thanks to the corresponding value kindly provided by E. Le Floc’h. of the infrared luminosity computed over the range 8-1000m : , which would correspond to SFR M☉ yr-1. However, Le Floc’h et al. (2007) have estimated that 67.2 percent of the infrared flux is due to the AGN component. Accordingly, the SFR is probably of order 375 M☉ yr-1.
From our upper limits on the CO(2-1) and CO(4-3) luminosities of CFRS 14.1157, we find that the molecular gas content of this galaxy is smaller than and (with K km s-1pc). This supports the idea that the observed infrared luminosity is probably dominated by the AGN component, as estimated by Le Floc’h et al. (2007). In addition, one can note that the SFR derived on the basis of the O II line is significantly lower: yr-1 relying on the equivalent width and rest-frame absolute magnitude measured by Weiner et al. (2005) and the formula of Guzman et al. (1997), while we estimate yr-1 with an integration of O II the spectra published by Le Floc’h et al. (2007) (see their figure 2a) and normalised to SDSS fluxes. This could be compatible with the IR-derived SFR only with a factor of extinction of , while if one assumes that only one third of the infrared luminosity contributes to the SFR. While a large scatter is known to affect O II luminosities as discussed by Weiner et al. (2007), the previous comparison stresses the importance of the actual fraction of the infrared luminosity due to the starburst: this fraction is often overestimated.
Acknowledgements.
We thank the DEEP collaboration for providing us with the optical spectra of CFRS 14.1157. We are most grateful to C. Willmer and E. Le Floc’h, who help us in this procedure. This research has made use of the NASA/IPAC Extragalactic Database (NED), which is operated by the Jet Propulsion Laboratory, California Institute of Technology, under contract with the National Aeronautics and Space Administration.References
- Alexander et al. (2005) Alexander, D. M., Bauer, F. E., Chapman, S. C., Smail, I., Blain, A. W., Brandt, W. N., & Ivison, R. J. 2005, ApJ, 632, 736
- Becker et al. (1991) Becker, R. H., White, R. L., & Edwards, A. L. 1991, ApJS, 75, 1
- Becker et al. (1995) Becker, R. H., White, R. L., & Helfand, D. J. 1995, ApJ, 450, 559
- Braine & Combes (1992) Braine J., Combes F. 1992, AA, 264, 433
- Calzetti et al. (2000) Calzetti D., Armus L., Bohlin R. C., Kinney A. L., Koornneef J., Storchi-Bergmann T. 2000, ApJ, 533, 682
- Carilli et al. (2005) Carilli, C. L., et al. 2005, ApJ, 618, 586
- Carilli & Wang (2006) Carilli, C. L., & Wang, R. 2006, AJ, 131, 2763
- Chilingarian (2002) Chilingarian I. 2002, Master thesis, Moscow State University, Faculty of Physics.
- Combes et al. (1999) Combes F., Maoli R., Omont A. 1999, AA, 345, 369
- Condon et al. (1991) Condon, J. J., Anderson, M. L., & Helou, G. 1991, ApJ, 376, 95
- Condon (1992) Condon, J. J. 1992, ARA&A, 30, 575
- Dahlen et al. (2007) Dahlen, T., Mobasher, B., Dickinson, M., Ferguson, H. C., Giavalisco, M., Kretchmer, C., & Ravindranath, S. 2007, ApJ, 654, 172
- Dale et al. (2007) Dale, D. A., et al. 2007, ApJ, 655, 863
- Devereux et al. (1994) Devereux N., Taniguchi Y., Sanders D. B., Nakai N., Young J. S. 1994, AJ, 107, 2006
- Dey et al. (1999) Dey A., Graham J. R., Ivison R. J., Smail I., Wright G. S., Liu M. C. 1999, ApJ, 519, 610
- Douglas et al. (1996) Douglas, J. N., Bash, F. N., Bozyan, F. A., Torrence, G. W., & Wolfe, C. 1996, AJ, 111, 1945
- Downes & Eckart (2007) Downes, D., & Eckart, A. 2007, A&A, 468, L57
- Elbaz et al. (2002) Elbaz, D., Cesarsky, C. J., Chanial, P., Aussel, H., Franceschini, A., Fadda, D., & Chary, R. R. 2002, A&A, 384, 848
- Evans et al. (2006) Evans, A. S., Solomon, P. M., Tacconi, L. J., Vavilkin, T., & Downes, D. 2006, AJ, 132, 2398
- Farrah et al. (2003) Farrah, D., Afonso, J., Efstathiou, A., Rowan-Robinson, M., Fox, M., & Clements, D. 2003, MNRAS, 343, 585
- Flores et al. (1999) Flores, H., et al. 1999, ApJ, 517, 148
- Fomalont et al. (1991) Fomalont, E. B., Windhorst, R. A., Kristian, J. A., & Kellerman, K. I. 1991, AJ, 102, 1258
- Gao & Solomon (2004) Gao, Y., & Solomon, P. M. 2004, ApJ, 606, 271
- Genzel & Cesarsky (2000) Genzel, R., & Cesarsky, C. J. 2000, ARA&A, 38, 761
- Gregory & Condon (1991) Gregory, P. C., & Condon, J. J. 1991, ApJS, 75, 1011
- Greve et al. (2005) Greve T. R. et al. 2005, MNRAS, 359, 1165
- Guzman et al. (1997) Guzman, R., Gallego, J., Koo, D. C., Phillips, A. C., Lowenthal, J. D., Faber, S. M., Illingworth, G. D., & Vogt, N. P. 1997, ApJ, 489, 559
- Hammer et al. (1995) Hammer, F., Crampton, D., Lilly, S. J., Le Fevre, O., & Kenet, T. 1995, MNRAS, 276, 1085
- Hammer et al. (2005) Hammer, F., Flores, H., Elbaz, D., Zheng, X. Z., Liang, Y. C., & Cesarsky, C. 2005, A&A, 430, 115
- Kennicutt (1998) Kennicutt, R. C., Jr. 1998, ApJ, 498, 541
- Le Floc’h et al. (2007) Le Floc’h, E., et al. 2007, ApJ, 660, L65
- Lilly et al. (1995) Lilly, S. J., Hammer, F., Le Fevre, O., & Crampton, D. 1995, ApJ, 455, 75
- Madau et al. (1998) Madau, P., Pozzetti, L., & Dickinson, M. 1998, ApJ, 498, 106
- Marzke et al. (1998) Marzke, R. O., da Costa, L. N., Pellegrini, P. S., Willmer, C. N. A., & Geller, M. J. 1998, ApJ, 503, 617
- Mazzarella et al. (1993) Mazzarella, J. M., Graham, J. R., Sanders, D. B., & Djorgovski, S. 1993, ApJ, 409, 170
- Melchior et al. (2001) Melchior A.-L., Combes F., Guiderdoni B., Hatton S. 2001, ESA SP-460: The Promise of the Herschel Space Observatory, 467; preprint (astro-ph/0102086)
- Odewahn & Aldering (1995) Odewahn, S. C., & Aldering, G. 1995, AJ, 110, 2009
- Papadopoulos et al. (2000) Papadopoulos, P. P., Röttgering, H. J. A., van der Werf, P. P., Guilloteau, S., Omont, A., van Breugel, W. J. M., & Tilanus, R. P. J. 2000, ApJ, 528, 626
- Patnaik et al. (1992) Patnaik, A. R., Browne, I. W. A., Wilkinson, P. N., & Wrobel, J. M. 1992, MNRAS, 254, 655
- Sanders et al. (1991) Sanders D. B., Scoville N. Z., Soifer B. T. 1991, ApJ, 370, 158
- Saripalli & Mack (2007) Saripalli, L., & Mack, K.-H. 2007, MNRAS, 376, 1385
- Schmitt et al. (1997) Schmitt, H. R., Kinney, A. L., Calzetti, D., & Storchi Bergmann, T. 1997, AJ, 114, 592
- Seaquist et al. (1995) Seaquist, E. R., Ivison, R. J., & Hall, P. J. 1995, MNRAS, 276, 867
- Snellen et al. (2002) Snellen, I. A. G., Lehnert, M. D., Bremer, M. N., & Schilizzi, R. T. 2002, MNRAS, 337, 981
- Solomon et al. (1997) Solomon P. M., Downes D., Radford S. J. E., Barrett J. W. 1997, ApJ, 478, 144
- Solomon & Vanden Bout (2005) Solomon P. M., Vanden Bout P. A. 2005, ARAA, 43, 677
- Spergel et al. (2007) Spergel, D. N., et al. 2007, ApJS, 170, 377
- Steidel et al. (2004) Steidel, C. C., Shapley, A. E., Pettini, M., Adelberger, K. L., Erb, D. K., Reddy, N. A., & Hunt, M. P. 2004, ApJ, 604, 534
- van den Bergh (2001) van den Bergh, S. 2001, AJ, 122, 621
- Vogt et al. (2005) Vogt, N. P., et al. 2005, ApJS, 159, 41
- Vlahakis et al. (2007) Vlahakis, C., Eales, S., & Dunne, L. 2007, MNRAS, 379, 1042
- Weiner et al. (2005) Weiner, B. J., et al. 2005, ApJ, 620, 595
- Weiner et al. (2007) Weiner, B. J., et al. 2007, ApJ, 660, L39
- White & Becker (1992) White, R. L., & Becker, R. H. 1992, ApJS, 79, 331
- Wright (2006) Wright, E. L. 2006, PASP, 118, 1711
- Yao et al. (2003) Yao, L., Seaquist, E. R., Kuno, N., & Dunne, L. 2003, ApJ, 588, 771
- Yun et al. (2001) Yun, M. S., Reddy, N. A., & Condon, J. J. 2001, ApJ, 554, 803
- Zheng et al. (2004) Zheng, X. Z., Hammer, F., Flores, H., Assémat, F., & Pelat, D. 2004, A&A, 421, 847
Appendix A CFRS 14.1329
This galaxy was first detected in radio by Fomalont et al. (1991). It was subsequently detected in the CFRS survey (Lilly et al., 1995; Hammer et al., 1995). It has been classified as a dusty Sa by van den Bergh (2001), while Flores et al. (1999) classified it as a strong starburst and highly reddened starburst with a lenticular morphology. Flores et al. (1999) fitted Schmitt et al. (1997) spectral energy distribution templates to optical, K and mid-infrared data, as well as to the 60m flux (derived from the radio-FIR correlation). The infrared luminosity555This luminosity corresponds to SFRyr-1 relying on Kennicutt (1998). derived for CFRS 14.1329 in this way was . We relied on this infrared luminosity to select CFRS 14.1329 for CO observations. In the meantime, Zheng et al. (2004) reanalysed a CFRS sample containing CFRS 14.1329 with the mid-infrared and infrared correlation found by Elbaz et al. (2002), and published a revised version of the infrared luminosity a factor of smaller: (SFRyr-1). This revision reflects the uncertainties related to the determination of the infrared luminosity based on correlations with other wavelengths luminosities. This lower value is in agreement with our non-CO detection (see Table 2). More recently, it has been further observed with the DEEP Groth Strip Survey (Vogt et al., 2005). In addition, Hammer et al. (2005) estimate SFR(O II)=3.5 M☉ yr-1, which would require a factor of extinction of 6.4, while .
Appendix B NGP9 F268-0341339
This object is a radio-flat spectrum galaxy. Its optical spectra is typical of an AGN. The SCANPI/IRAS tool suggests a possible signal at 12 m. However, there is foreground disc galaxy (SDSS J122847.72+370606.9) at , which is hosting an intense star formation activity (SFRM☉yr-1). Its optical spectra is typical of an Sb galaxy, while it exhibits a strong H emission line (SFRM☉yr-1). Given its close angular distance (5″) to NGP9~F268-0341339, it most probably dominates the possible infrared IRAS fluxes.