Keck spectroscopy of globular clusters in the spiral galaxy NGC 2683
Abstract
We analyse Keck spectra of 24 candidate globular clusters (GCs) associated with the spiral galaxy NGC 2683. We identify 19 bona fide GCs based on their recession velocities, of which 15 were suitable for stellar population analysis. Age and metallicity determinations reveal old ages in 14 out of 15 GCs. These old GCs exhibit age and metallicity distributions similar to that of the Milky Way GC system. One GC in NGC 2683 was found to exhibit an age of 3 Gyr. The age, metallicity and -element abundance of this centrally located GC are remarkably similar to the values found for the galactic centre itself, providing further evidence for a recent star formation event in NGC 2683.
keywords:
globular clusters: general – galaxies: individual: NGC 2683 – galaxies: star clusters.1 Introduction
Despite their historical importance in understanding the formation processes of our own Galaxy (Eggen, Lynden-Bell & Sandage 1962; Searle & Zinn 1978; Mackey & Gilmore 2004; Forbes, Strader & Brodie 2004), detailed studies of the stellar populations of globular cluster (GC) systems in spiral galaxies beyond the Local Group are somewhat limited. It is important that this be rectified, not only to inform formation models of spiral galaxies, but also to constrain formation models of other morphological types. For example, Ashman & Zepf (1992) proposed that the GC systems of elliptical galaxies represent the merged systems of spiral galaxies plus the addition of newly formed red (metal-rich) GCs. Bedregal et al. (2006) have argued that the GC systems of S0s are consistent with faded spirals. A better understanding of GC systems in spirals, with a range of types and luminosities, is needed to test these ideas.
Imaging studies of GC systems exist for about a dozen spirals (e.g. Kissler-Patig et al. 1999; Larsen, Forbes & Brodie 2001; Goudfrooij et al. 2003). When sufficient numbers of GCs are present, they reveal a bimodal colour distribution (similar to those seen in elliptical galaxies) with the red (metal-rich) subpopulation associated with the galaxy bulge component (see Forbes, Brodie & Larsen 2001). Spectroscopic studies of GCs in spirals beyond the Milky Way and M31 (Burstein et al. 1984; Beasley et al. 2004) are even more limited. Schroder et al. (2002) investigate the stellar population properties of 16 individual GCs in M81. Similar, or smaller, numbers have been investigated in M104 (Larsen et al. 2002), NGC 253 and NGC 300 (Olsen et al. 2004), and M33 (Chandar et al. 2006). These studies generally find old ages with a wide range of metallicities for the GCs. Some GC systems reveal bulk rotation, while others do not, but small numbers and the lack of edge-on systems make such analyses uncertain.
| Galaxy | Hubble | Distance | MV | Bulge reff | Disc Scale | Mass HI | NGC | SN |
|---|---|---|---|---|---|---|---|---|
| Type | (Mpc) | (mag) | (kpc) | (kpc) | (109M⊙) | |||
| Milky Way | S(B)bc1 | – | -20.91 | 2.53 | 5.05 | 4.05 | 160201 | 0.70 |
| M31 | Sb1 | 0.78 | -21.21 | 2.43 | 6.45 | 3.05 | 400551 | 1.32 |
| NGC 2683 | Sb2 | 7.2 | -20.3 | 2.54 | 1.72 | 0.62 | 120406 | 0.90 |
Based on the HST Advanced Camera for Surveys (ACS) imaging study of Forde et al. (2007), we have obtained Keck telescope spectra of GC candidates in the nearby, edge-on Sb spiral NGC 2683. A variety of distance estimates exist in the literature for NGC 2683. Here we adopt the surface brightness fluctuation distance modulus of Tonry et al. (2001) modified by the correction found by Jensen et al. (2003). This is gives m–M = 29.28 0.36 or 7.2 1.3 Mpc which lies near the midpoint of the literature estimates. With a luminosity of MV = –20.31 mag it has a lower luminosity (by a factor of 2) than the Milky Way or M31. We note that, although possessing a Hubble type and bulge size similar to the Milky Way and M31, NGC 2683 exhibits a disc size and HI gas mass that are significantly smaller. Rhode et al. (2007) show that the extent of the GC system of NGC 2683 is also rather small, with the projected density of the system falling to background levels within 8 kpc. This can be compared to the Milky Way GC system in which a fraction of the GC system lies outside 30 kpc. Some properties of NGC 2683 are compared to those of the Milky Way and M31 in Table 1.
In Section 2 we present our observations and data reduction methods. The measurement and analysis of recession velocities and Lick indices are given in Section 3. The results of our chemical and kinematic analysis of the sample is outlined in Section 4. Our conclusions are presented in in Section 5.
2 Observations and data reductions
Spectra of 24 GC candidates around NGC 2683 were obtained with the Low Resolution Imaging Spectrometer (LRIS; Oke et al. 1995) on the Keck I telescope. Candidate selection, based on ACS imaging data, is detailed in Forde et al. (2007). Briefly, our spectroscopic sample was selected from amongst the brightest of GC candidates. The candidates were chosen to represent both red and blue subpopulations. While not a full statistical sample, the candidates are therefore representative of the GC system as a whole. It should also be noted that, with GCs only partially resolved in the HST imaging, it is to be expected that the sample will include some foreground stars.
Spectral observations were obtained in 2005 February 07–08 with an integration time of s = 8 hours. Seeing was 1 arcsec on both nights. A 600 lines-per-mm grating blazed at 4000 Å was used on the blue side, resulting in a wavelength range of 3300 – 5900 Å and a FWHM spectral resolution of Å. The spectra were not flux calibrated.
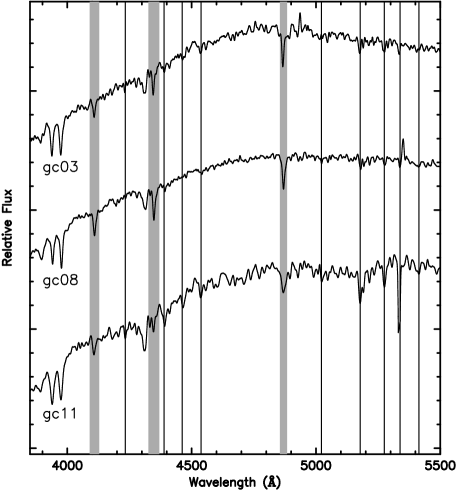
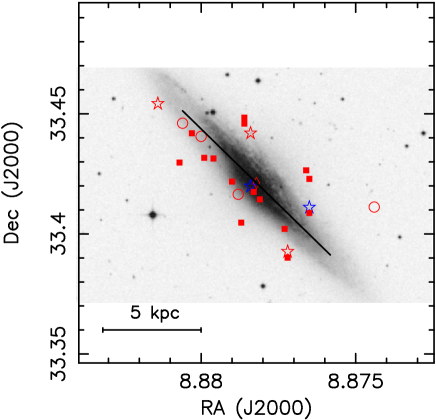
Data reduction was carried out using standard IRAF111IRAF is distributed by the National Optical Astronomy Observatories, which are operated by the Association of Universities for Research in Astronomy, Inc., under cooperative agreement with the National Science Foundation commands. The tracing of spectra and background-subtraction was done using the command apall. Comparison lamp spectra were used for wavelength calibration (mostly based on 8 Hg lines). Zero–point corrections of up to 1.5 Å were performed on the science spectra using the bright [OI] skyline at 5577 Å. The 16 individual spectra of each GC candidate were then average-combined with 3- clipping. A sample of the GC spectra are shown in Fig. 1. The backgrounds subtracted from the spectra of the GC candidates – admixtures of background galaxy light and sky – were retained for analysis of the galaxy rotation curve. These were average combined and then sky-subtracted. The removal of the sky was achieved by identifying the GC candidate with the lowest background level; gc01 – a candidate lying at large radial and azimuthal distances from the galaxy centre (see Fig. 2; right). The candidate was also found to have signal-to-noise 1 Å-1, and therefore probably contained no object. The background of this candidate, which lies in the halo of the galaxy, is therefore the least contaminated by either galaxy or globular cluster light. Indeed, cross-correlation of the spectrum of the background of this candidate with the solar spectrum gave a recession velocity less than 1 km s-1, indicating very little contamination from NGC 2683. By scaling this spectrum by the total flux in the bright OI skyline at 5577 Å, estimates of the sky levels in the backgrounds of other candidates could be made and subtracted. The residuals from this process are therefore estimates of the spectra of the background galaxy. These were used to measure a rotation curve for the galaxy, but were not subject to stellar population analysis.
We also measured the gas kinematics in NGC 2683 using the bright [OIII]5007 Å emission-lines evident in most of the galaxy spectra. We have therefore been able to measure GC, stellar and gaseous recession velocities from the majority of slitlets in the mask.
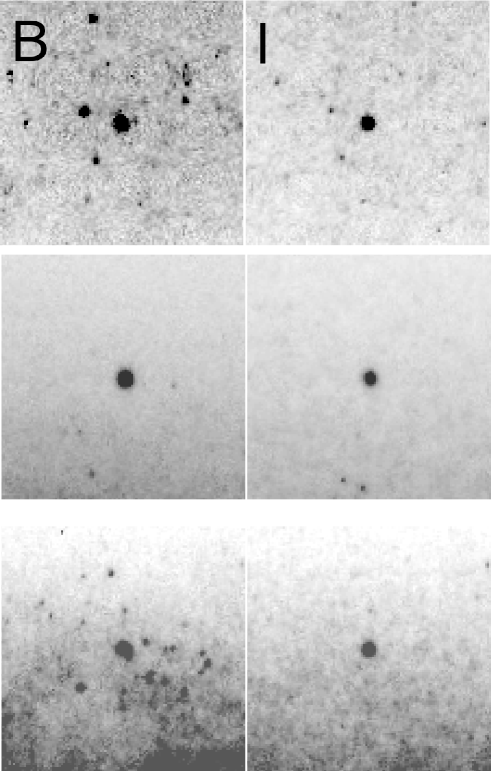
During the reductions, three GC candidates (gc02, gc15 and gc24) were identified by their spectra to be stars. Four others (gc01, gc13, gc20 and gc23) were found to have signal-to-noise ratios below 10 . A visual inspection of the Forde et al. (2007) imaging identified two other candidates to be contaminated by stars in OB associations in NGC 2683 itself (see Fig. 3). All nine of the candidates identified above were therefore excluded from our stellar population analysis. The sample therefore contains 19 GCs suitable for recession velocity (RV) analysis and 15 GCs suitable for stellar population analysis. Details are given as Notes in Table 2.
| ID | RA | Dec | Note | RVGC | RVGal | RVGas | r | z | B0 | I0 | (B-I)0 | Size |
|---|---|---|---|---|---|---|---|---|---|---|---|---|
| (J2000) | (J2000) | (km s-1) | (km s-1) | (km s-1) | (“) | (“) | (mag) | (mag) | (mag) | (pc) | ||
| gc01 | 8:52:27.8 | 33:24:40.4 | S/N1 (Sky) | – | – | – | – | – | – | – | – | – |
| gc02 | 8:52:27.8 | 33:24:40.4 | Star | – | – | – | 147.4 | 96.3 | 20.97 | 19.10 | 1.87 | 1.24 |
| gc03 | 8:52:37.9 | 33:23:24.4 | – | 368(3) | 559(7) | 525(20) | 111.7 | -46.9 | 21.12 | 19.52 | 1.60 | 1.92 |
| gc04 | 8:52:35.3 | 33:24:31.4 | – | 602(16) | 552(1) | 590(20) | 87.3 | 23.5 | 22.87 | 20.86 | 2.02 | 2.27 |
| gco5 | 8:52:35.5 | 33:24:39.7 | Contam | 283(14) | 546(2) | 593(20) | 79.7 | 27.6 | 23.28 | 21.39 | 1.89 | 2.66 |
| gc06 | 8:52:38.2 | 33:24:07.5 | – | 491(3) | 563(2) | 530(20) | 78.6 | -19.0 | 22.14 | 20.44 | 1.70 | 2.31 |
| gc07 | 8:52:35.3 | 33:25:22.5 | – | 557(14) | 532(4) | 497(20) | 59.6 | 51.2 | 22.83 | 21.33 | 1.51 | 2.86 |
| gc08 | 8:52:35.6 | 33:25:35.5 | – | 560(4) | 396(5) | 437(20) | 66.2 | 39.3 | 21.24 | 19.72 | 1.52 | 4.17 |
| gc09 | 8:52:41.0 | 33:24:51.7 | – | 388(4) | 481(2) | 471(20) | 22.5 | -12.6 | 20.95 | 18.98 | 1.97 | 2.96 |
| gc10 | 8:52:43.5 | 33:24:16.8 | – | 317(15) | 447(31) | 477(20) | 25.0 | -59.4 | 22.84 | 20.86 | 1.98 | 2.67 |
| gc11 | 8:52:42.0 | 33:25:02.9 | – | 430(3) | 461(8) | 460(20) | 5.7 | -13.5 | 21.33 | 19.82 | 1.51 | 5.55 |
| gc12 | 8:52:42.3 | 33:25:11.3 | Contam | 432(3) | 432(3) | 424(20) | -2.9 | -10.2 | 21.88 | 20.00 | 1.89 | 3.09 |
| gc13 | 8:52:43.6 | 33:24:59.4 | S/N10 | – | 500(27) | – | -6.0 | -30.2 | 22.77 | 20.89 | 1.88 | 2.04 |
| gc14 | 8:52:44.4 | 33:25:18.6 | – | 304(5) | 426(2) | 424(20) | -26.6 | -23.7 | 21.27 | 19.43 | 1.84 | 2.22 |
| gc15 | 8:52:42.1 | 33:26:30.8 | Star | – | 351(5) | 386(20) | -57.3 | 47.8 | 20.86 | 18.47 | 2.39 | 1.01 |
| gc16 | 8:52:42.8 | 33:26:45.3 | – | 217(5) | 344(5) | – | -73.8 | 51.8 | 22.05 | 19.97 | 2.08 | 2.96 |
| gc17 | 8:52:43.1 | 33:26:54.1 | – | 435(5) | 385(7) | – | -82.7 | 55.4 | 21.57 | 19.84 | 1.73 | 9.66 |
| gc18 | 8:52:46.7 | 33:25:52.9 | – | 244(6) | 365(2) | – | -71.2 | -19.8 | 22.48 | 20.99 | 1.49 | 2.18 |
| gc19 | 8:52:47.7 | 33:25:54.1 | – | 352(4) | 371(4) | 304(20) | -80.9 | -27.8 | 20.85 | 19.20 | 1.65 | 1.89 |
| gc20 | 8:52:48.0 | 33:26:26.1 | S/N10 | 247(21) | 295(2) | 237(20) | -106.2 | -7.8 | 23.61 | 21.62 | 1.99 | 1.77 |
| gc21 | 8:52:50.4 | 33:25:46.9 | – | 711(5) | 259(5) | 329(20) | -99.8 | -56.8 | 21.89 | 20.50 | 1.40 | 2.52 |
| gc22 | 8:52:49.0 | 33:26:30.9 | – | 307(49) | 307(2) | 329(20) | -118.5 | -13.3 | 23.01 | 21.54 | 1.47 | 2.67 |
| gc23 | 8:52:50.0 | 33:26:45.9 | S/N10 | 456(43) | 285(4) | – | -137.9 | -11.5 | 23.35 | 21.38 | 1.97 | 3.07 |
| gc24 | 8:52:53.0 | 33:27:15.3 | Star | – | 166(85) | 252(20) | -185.2 | -17.3 | 22.09 | 20.58 | 1.52 | 1.31 |
| Index | Offset | Error |
|---|---|---|
| H | 0.373 | 0.254 |
| H | 0.007 | 0.127 |
| CN1 | -0.001 | 0.011 |
| CN2 | 0.005 | 0.012 |
| Ca4227 | 0.298 | 0.091 |
| G4300 | 0.142 | 0.211 |
| H | -0.460 | 0.170 |
| H | 0.011 | 0.059 |
| Fe4383 | 0.583 | 0.188 |
| Ca4455 | 0.420 | 0.091 |
| Fe4531 | 0.180 | 0.108 |
| C4668 | -0.846 | 0.073 |
| H | 0.032 | 0.123 |
| Fe5015 | 0.696 | 0.140 |
| Mg1 | 0.027 | 0.005 |
| Mg2 | 0.052 | 0.003 |
| Mgb | -0.115 | 0.050 |
| Fe5270 | 0.086 | 0.083 |
| Fe5335 | 0.384 | 0.114 |
| Fe5406 | -0.025 | 0.068 |
3 Spectral analysis
In the following we outline the spectral analysis from which we measure recession velocities and stellar population properties. We also make use of the HST photometric measurements of Forde et al. (2007) (see Table 2).
3.1 Kinematics
The recession velocities of GC candidates and their galaxy backgrounds were determined by cross-correlation against six high signal-to-noise stellar templates using the IRAF command fxcor. The heliocentric velocities of the templates themselves were measured by cross-correlation against a high resolution solar spectrum. The average of the values of RV derived from comparison to the six template stars was taken as the measured value, while the rms scatter was taken as the error. The RVs of the galaxy’s gas were also measured in the background galaxy spectra. This was achieved by the fitting of Gaussians to the bright [OIII]5007 emission lines evident in most galaxy spectra.
The results of this analysis are presented in Section 4. We next detail the determination of the properties of the stellar populations in our sample of GCs using Lick indices.
3.2 Measurement and analysis of Lick indices
We measured Lick indices using the definitions of Trager et al. (1998) and Worthey & Ottaviani (1997). Indices were measured after convolving the spectra with the Gaussians required to broaden to the wavelength-dependent Lick resolution (Worthey & Ottaviani 1997). Lick indices and their associated errors are shown in Table 5. Calibration to the Lick system was performed using 6 Lick standard stars. The additive corrections required to match the Lick system and their errors are given in Table 3.
The measured indices were then compared with SSP models. We elected to use the recent models of Lee & Worthey (2005) combined with Houdashelt (2002) sensitivities to abundances ratios. We detail the method by which the SSP models are combined with the Houdashelt sensitivities in Mendel et al. (2007), in which we show that this combination reproduces the ages, metallicities and ‘’–abundance ratios of Galactic globular clusters extremely well. This gives us confidence in making direct comparisons of our results with the Galactic globular cluster system (Section 4).
The comparisons to SSP models were carried out using the -fitting procedure of Proctor & Sansom (2002) (see also Proctor et al. 2004a,b and Proctor et al. 2005) to measure the derived parameters; log(age), [Fe/H], [Z/H] and [E/Fe] (a proxy for the ‘’–abundance ratio; see Thomas et al. 2003 for details). Briefly, the technique for deriving these parameters involves the simultaneous comparison of as many observed indices as possible to models of single stellar populations (SSPs). The best fit is found by minimising the deviations between observations and models in terms of the observational errors, i.e. . We have shown this approach to be relatively robust with respect to many problems which are commonly experienced in the measurement of spectral indices and their errors. These include poor or no flux calibration, poor sky subtraction and poor calibration to the Lick system. The method is similarly robust with respect to many of the uncertainties in the SSP models used in interpretation of the measured indices; e.g. the second parameter effect in horizontal branch morphologies and the uncertainties associated with the Asymptotic-Giant Branch. It was shown in Proctor et al. (2004a) and Proctor et al. (2005) that the results derived using the technique are, indeed, significantly more reliable than those based on only a few indices.
The process by which the candidate spectra were compared to the models was iterative. First, fits were obtained for all the candidates using all the available indices. The patterns of deviations from the fits obtained was then used to identify individual indices that matched the models poorly (see Fig. 4). These included the H, CN indices for which flux levels were generally too low for accurate determination and Mg1 and Mg2 indices which suffer from flux calibration sensitivity. These indices were excluded from the analysis and the fits performed again. These fits were carried out using a clipping procedure in which indices deviating from the model fit by more than 3 were excluded, and the fit performed again. Many of these poorly fitting indices could be associated with known problems, e.g. the contamination of the Mgb index by the 5202 Å sky-line in low signal-to-noise candidates. Indices that are excluded on this basis are in parentheses in Table 5. On average, after all exclusions, 10 indices were used in each of the final fits.
For each GC in the sample, errors in the derived parameters (log(age), [Fe/H], [E/Fe] and [Z/H]) were estimated using 50 Monte-Carlo realisations. Best-fit model indices were perturbed by Gaussians, the width of which were set equal to the observational errors added in quadrature to the errors in offset to the Lick system (Table 3). Error estimates in the derived parameters are therefore highly sensitive to the estimates of index errors. The process also makes no allowance for the correlated components of the observational index errors, such as velocity dispersion, flux calibration and background subtraction errors. The errors are modelled instead as purely random Gaussian distributions. As a consequence, our error estimates must be considered to include both random and systematic errors.

4 Results
4.1 Results of recession velocity analysis
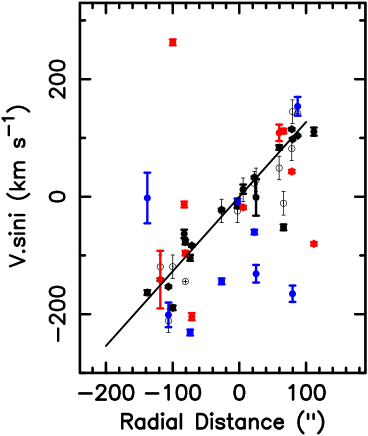
The results of our analysis of recession velocities are given in Table 2 and are presented in Fig. 5. The value assumed for the galactic centre (442.8 km s-1) was estimated such that the value of the least-squares fit to the stellar RVs with radial distance (solid line in Fig. 5) passes through 0.0 km s-1 at a radial distance of 0.0 arcsec. Note that candidates identified as stars and the single object with signal-to-noise 1 are omitted from these and all subsequent plots of GC data. We therefore present recession velocities for 19 GCs.
The stellar and gas emission-line data (Fig. 5) clearly show an increasing rotation speed with increasing radial distance from the galactic centre, and can be seen to be essentially cylindrical (i.e. there is little scatter and no particular trend in RV with distance above or below the least-square fit). The figure also shows the rotation of gas and stars to be in very good agreement.
It is evident that we do not reach the radii at which rotation is observed to flatten. However, our results are nevertheless consistent with the rotation of Casertano & van Gorkom (1991) and Broeils & van Woerden (1994), who find similar rotation curves with a flattening/peak lieing just beyond the range probed by our data. The apparent dip in stellar and gaseous RVs at radial distance 65 arcsec in the rotation profile of Barbon & Capaccioli (1975) is also present at similar radii in our data (Fig. 5; lower left), although we note that they find a significantly steeper rotation curve than Casertano & van Gorkom (1991), Broeils & van Woerden (1994) or ourselves. Our ‘dip’ is also significantly deeper than that observed by Casertano & van Gorkom, with both stars and gas rotating in the opposite sense to the rest of the galaxy at similar radii.
The RVs measured in the GC spectra are also shown in
Fig. 5. GC recession velocities are generally
consistent with those of the stars and gas. However, we lack sufficient
numbers to unambiguously identify rotation in the GC system.
4.2 Results of stellar population analysis
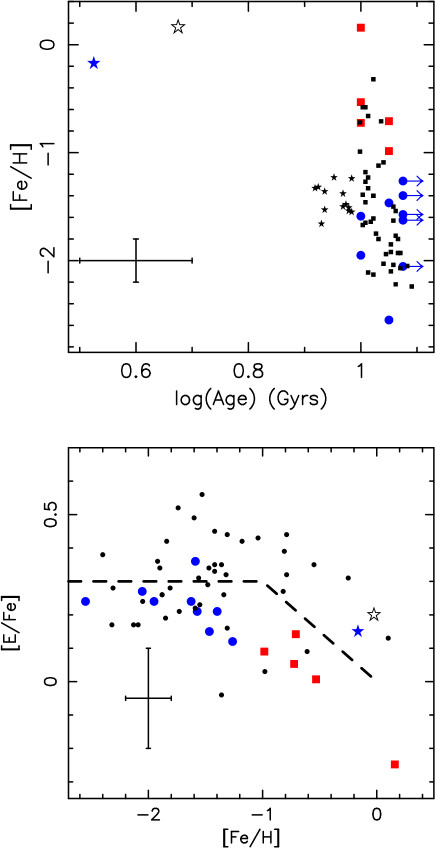
The results of our age and metallicity determinations are given in Table 4 and plotted in Fig. 6. Candidates with signal-to-noise 10 are excluded from our analysis, leaving 15 GCs suitable for stellar population analysis.
In Fig. 6 our results are compared to the values for Galactic
GCs from de Angeli et al. (2005) and Pritzl, Venn & Irwin (2005). It is
shown in Mendel et al. (2007) that ages and metallicities derived from
Lee & Worthey (2005) SSP models agree extremely well with Galactic GC
measurements from colour-magnitude diagrams and high resolution
spectral studies. For [Fe/H], Mendel et al. find only a 0.0280.024 dex
average offset between the value derived from Lee & Worthey SSPs
models and the Harris (1996) values for 42 Galactic GCs. A similar
offset (–0.0240.021 dex or –0.280.24 Gyr) was found
in the comparison of the derived ages with the data from de Angeli et
al. (2005). Finally, the average values of [E/Fe] derived by Mendel et
al. (2007) for Galactic GCs are offset from the Pritzl et al. (2005)
values by –0.0240.02 dex (T. Mendel 2007; private communication). The
Mendel et al. (2007) results are consequently fully consistent with the
literature data. We therefore have reasonable confidence in our
comparison of the ages and metallicities of GCs of NGC 2683 with those
of the Milky Way.
4.3 Consistency checking
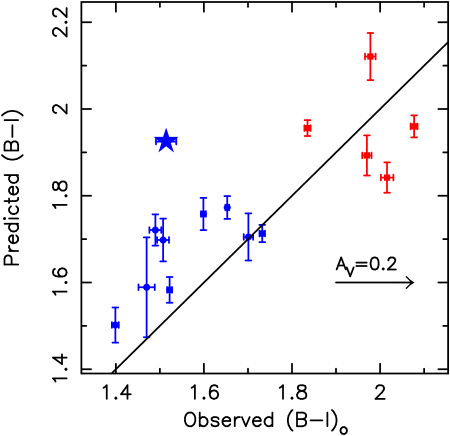
However, before interpreting the ages and metallicity estimates, we sought to gain further confidence in our results by using them to predict the B-I colours of our GC sample (using the SSP models of Bruzual & Charlot 2003) for comparison to the observed HST colours (Forde et al. 2007). The comparison is shown in Fig. 7. The predictions compare quite favourably with the observed values, particularly given the 0.15 mag overestimation of predicted (B–I) colour found by Pierce et al. (2005, 2006) in similar studies. This is believed to be primarily the effect of the poor modelling of the horizontal branch (see also Strader & Smith 2007). Scatter should also be expected to be relatively high in our study due to the highly variable internal extinction in NGC 2683.
There is, however, one clearly aberrant GC – gc11; an apparently
young GC (Table 4). We note that the spectrum of this GC
is clearly different from other GCs of the same colour in a sense
consistent with the derived younger age and higher metallicity,
i.e. similar Balmer line strengths and stronger metal lines (see
Fig. 1). It is clear from Fig. 7 that this
effect is not the result of extinction. However, the proximity of this
GC to the galactic centre makes contamination by the background galaxy
a concern. We therefore experimented with adding galaxy light back
into the GC spectrum and then subjecting the resultant spectrum to our
age/metallicity analysis. We found that when 50% of the galaxy light
was recombined with the GC spectrum the derived age increased by
0.2 dex (i.e to 5 Gyr), while the metallicity fell by a similar
amount, resulting in a similar predicted colour. This is both a
relatively small change (for a relatively large amount of galaxy
contamination) and is in the opposite sense to that required to
explain the young age by galaxy contamination. We therefore conclude
that background contamination in the spectroscopic analysis is
unlikely to be the cause of the observed young age of this GC, or the
discrepancy with its predicted colour. The cause of the discrepancy
between observed and predicted colours therefore remains unknown.
4.4 Stellar population parameters
Having gained some confidence in our measured stellar parameters we now return our attention to the age and metallicity estimates.
Our stellar population analysis identifies a single young GC, with a derived age of 3.3 Gyr. This is similar to the luminosity-weighted age of 4.7 Gyr found for the galactic centre by Proctor & Sansom (2002). The central [Fe/H]=–0.030.09 and [E/Fe]=0.200.04 found in Proctor & Sansom (2002) are also similar to the values found for this young GC (–0.170.04 and 0.160.03 respectively; Fig. 6). This suggests the possibility that this GC formed in the same event that fuelled the central star-burst.
We find the remaining 14 of 15 GCs to possess ages older than 10 Gyr (Fig. 6). In five cases we find an age equal to the oldest age modelled by Lee & Worthey (2005). It is apparent that the scatter in GC age estimates is smaller than the error given by our Monte-Carlo analysis (Section 3.2). We take this to be a combination of three effects; i) the error includes both random and systematic errors, ii) the scatter is slightly suppressed by the GCs hitting the oldest age, iii) a slight over-estimation of observational errors is also a possibility (see Section 3.2).
The 14 GCs found to be old span a broad range of metallicities (Fig. 6), similar to that observed in other spiral galaxy GC systems (Burstein et al. 1984; Beasley et al. 2004; Schroder et al. 2002; Larsen et al. 2002; Olsen et al. 2004). They also span a similar range to the Milky Way GC system (de Angeli et al. 2005; Fig. 6).
| ID | Age | Log(age) | [Fe/H] | [E/Fe] | [Z/H] |
|---|---|---|---|---|---|
| (Gyr) | (Gyr) | ||||
| gc03 | 11.9 | 1.08(0.15) | -1.40(0.13) | 0.21(0.08) | -1.20(0.16) |
| gc04 | 11.2 | 1.05(0.13) | -0.99(0.17) | 0.09(0.08) | -0.90(0.15) |
| gc06 | 11.9 | 1.08(0.20) | -1.57(0.33) | 0.21(0.14) | -1.38(0.24) |
| gc07 | 11.9 | 1.08(0.18) | -1.63(0.26) | 0.24(0.11) | -1.40(0.22) |
| gc08 | 10.0 | 1.00(0.08) | -1.95(0.09) | 0.24(0.15) | -1.73(0.13) |
| gc09 | 10.0 | 1.00(0.18) | -0.72(0.17) | 0.05(0.07) | -0.68(0.21) |
| gc10 | 10.0 | 1.00(0.18) | 0.16(0.18) | -0.25(0.24) | -0.08(0.24) |
| gc11 | 3.3 | 0.53(0.02) | -0.17(0.03) | 0.16(0.02) | -0.03(0.03) |
| gc14 | 10.0 | 1.00(0.07) | -0.53(0.12) | 0.01(0.11) | -0.53(0.08) |
| gc16 | 11.2 | 1.05(0.07) | -0.71(0.10) | 0.14(0.10) | -0.58(0.12) |
| gc17 | 11.2 | 1.05(0.14) | -1.47(0.12) | 0.15(0.05) | -1.33(0.09) |
| gc18 | 10.0 | 1.00(0.10) | -1.59(0.24) | 0.36(0.25) | -1.25(0.16) |
| gc19 | 11.9 | 1.08(0.15) | -1.26(0.11) | 0.12(0.05) | -1.15(0.12) |
| gc21 | 11.2 | 1.05(0.04) | -2.55(0.19) | 0.24(0.11) | -2.33(0.18) |
| gc22 | 11.9 | 1.08(0.26) | -2.05(0.56) | 0.27(0.27) | -1.80(0.52) |
Fig. 6 also shows a comparison of [E/Fe] values from our
study to the [/Fe] results of Pritzl et al. (2005). We show
in Mendel et al. (2007) that, for Galactic GCs, there is good
agreement between [E/Fe] from Lick studies using Lee & Worthey (2005)
models, and the [/Fe] results of Pritzl, Venn & Irwin (2005).
The data suggest a slightly lower [E/Fe] in NGC 2683 than in the Milky
Way, but a larger, high signal-to-noise sample is required before we can
draw any firm conclusions.
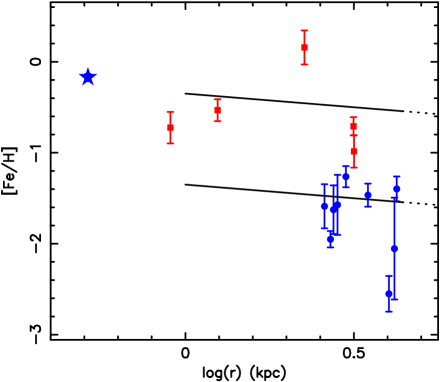
4.5 Radial metallicity distribution
The final step in our analysis is to consider the radial distribution in GC metallicities. To this end, a plot of [Fe/H] with radial distance along the major axis is presented in Fig. 8.
Radial trends in GC metallicity with galactocentric radius are expected in a dissipative formation scenario. The GC systems of both M31 (Barmby et al. 2000) and Milky Way (Armandroff, Da Costa & Zinn 1992) have been found to exhibit little, or no, overall radial metallicity gradient. However, Harris (2000) shows that weak trends in metallicity with radius are present when red and blue GC subpopulations are considered separately. More recently, Lee et al. (2007) showed that trends between metallicity and orbital parameters are present in the sub-sample of the Milky Way population that excludes many blue GCs with extreme horizontal-branch morphologies. Citing the extreme horizontal-branch GCs as probable accreted (and stripped) dwarf galaxies, Lee et al. (2007) conclude that the ‘normal’ GCs show clear signs of dissipational collapse.
We find no evidence for trends with azimuthal distance (perpendicular to the galaxy rotation plane) in NGC 2683, although we note the extremely limited range of our data. Our data do, on the other hand, suggest a trend of decreasing GC [Fe/H] with increasing distance along the major axis of NGC 2683 with logarithmic slope of –1.7 (Fig. 8). However, the data for both red and blue GCs of NGC 2683 are also consistent with the Harris (2000) trends for the average [Fe/H] with radius in Galactic GCs. In the Milky Way, there is no significant trend in the GC system as a whole, but individually both red and blue sub-populations show weak trends with radius of logarithmic slope –0.3, albeit with considerable scatter. We also note that our sample for NGC 2683 contains no blue GCs within 2 kpc, and no red GCs beyond 3 kpc, while the photometry of Forde et al. (2007) clearly shows that both red and blue GCs are present throughout the radius range covered by our data. Therefore, we suspect that the apparent trend is the result of the lack of observations of red GCs at large radii and blue GCs at small radii, and is consequently simply a sampling issue. A definitive description of this aspect of the GC system of NGC 2683 must, however, await a more extensive study.
5 Conclusions
We have analysed the recession velocities and stellar populations of a small sample of GCs in the spiral galaxy NGC 2683 and compared the results with the Galactic GC system.
Our stellar population analysis identified one GC, located near the centre of NGC 2683, with the relatively young age of 3.30.5 Gyr. The age, metallicity and [E/Fe] of this young GC appear remarkably similar to the values found by Proctor & Sansom (2002) for the centre of NGC 2683 itself. This result therefore suggests the possibility that this GC and the recent burst in the central regions were formed at the same time, from the same gas supply, and provide further evidence for a star-formation event in NGC 2683 about 3 Gyr ago.
The stellar population parameters of the 14 old globular
clusters in our sample show many similarities to the old globular
clusters of the Milky Way. The metallicity distribution spans a
similar range to those found in studies of the Milky Way and other
spiral galaxy systems, i.e from –2.5 to 0.0 dex.
The data for NGC 2683 GCs are also consistent with
the trends in [Fe/H] with radius observed in red and blue Galactic GC
subpopulations.
6 Acknowledgements
We thank Soeren Larsen for help preparing the slit mask and Kieran Forde
for providing information prior to publication. We also thank Lee Spitler
for assistance with the photometric analysis.
Part of this research was funded by NSF grant AST-02-06139 The data presented
herein were obtained at the W.M. Keck Observatory, which is operated
as a scientific partnership among the California Institute of
Technology, the University of California and the National Aeronautics
and Space Administration. The Observatory was made possible by the
generous financial support of the W.M. Keck Foundation. This research
has made use of the NASA/IPAC Extragalactic Database (NED), which is
operated by the Jet Propulsion Laboratory, Caltech, under contract
with the National Aeronautics and Space Administration. We also
thank the Australian Research Council for funding that supported this work.
7 References
Armandroff T.E., Da Costa G.S., Zinn R., 1992, AJ, 104, 164
Ashman K.M., Zepf, S.E., 1992, ApJ, 384, 50
Barbon R., Capaccioli M., 1975, A&A, 42, 221
Barmby P., Huchra J.P., Brodie J.P., Forbes D.A., Schroder L.L., Grillmair C.J. 2000, AJ, 119, 727
Beasley M.A., Brodie J.P., Strader J., Forbes D.A., Proctor R.N., Barmby P., Huchra J.P., 2004, AJ, 128, 1623
Bedregal A.G., Aragón-Salamanca A., Merrifield M.R., 2006, MNRAS, 373, 1125
Broeils A.H., van Woerden H., 1994, A&AS, 107, 129
Bruzual A.G., Charlot S., 2003, MNRAS, 344, 1000
Burstein D., Faber S.M., Gaskell C.M., Krumm N., 1984, ApJ, 287, 586
Casertano S., van Gorkom J.H., 1991, AJ, 101, 1231
Chandar R., Puzia T.H., Sarajedini A., Goudfrooij P., 2006, ApJ, 646L, 107
Courteau S., van den Bergh S., 1999, AJ, 118, 337
De Angeli F., Piotto G., Cassisi S., Busso G., Recio-Blanco A., Salaris M., Aparicio A., Rosenberg A., 2005, AJ, 130, 116
Eggen O.J., Lynden-Bell D., Sandage A.R., 1962, ApJ, 136, 748
Forbes D.A., Beasley M.A., Bekki K., Brodie J.P., Strader J., 2003, Science, 301, 1217
Forbes D.A., Brodie J.P., Larsen S.S., 2001, ApJ, 556 , 83
Forbes D.A., Strader J., Brodie J.P., 2004, AJ, 127, 3394
Forde et al., 2007, in preparation
Gilmore G., King I., van der Kruit P., 1989, Proceedings of the 19th Advanced Course of the Swiss Society of Astronomy and Astrophysics (SSAA), Saas-Fee, Leysin, Vaud, Switzerland, 13-18 March, 1989, Geneva: Observatory, 1989, edited by Buser, Roland, p334
Goudfrooij P., Strader J., Brenneman L., Kissler-Patig M., Minniti D., Huizinga J.E., 2003, MNRAS, 343, 665
Harris W.E., 2000, “Star Clusters”, in “28th Saa-Fee Advanced Course for Astrophysics and Astronomy”
Houdashelt M.L., Trager S.C., Worthey G., Bell R.A., 2002, Elemental Abundances in Old Stars and Damped Lyman-α Systems, 25th meeting of the IAU, Joint Discussion 15, 22 July 2003, Sydney, Australia
Ibata R.A., Gilmore G., Irwin M.J., 1995, MNRAS, 277, 781
Jensen J.B., Tonry J.L., Barris B.J., Thompson R.I., Liu M.C., Rieke M.J., Ajhar E.A., Blakeslee J.P., 2003, ApJ, 583, 712
Kent S.M., 1985, ApJS, 59, 115
Kissler-Patig M., Ashman K.M., Zepf S.E., Freeman K.C., 1999, AJ, 118, 197
Lanfranchi G.A., Matteucci F., 2004, MNRAS, 351, 1338
Larsen S.S., Forbes D.A., Brodie J.P., 2001, MNRAS, 327, 1116
Larsen S.S., Brodie J.P., Beasley M.A., Forbes D.A., 2002, AJ, 124, 828
Lee H., Worthey G., 2005, ApJS, 160, 176
Lee Y-K., Gim H.B., Casetti-Dinescu D.I., ApJ, 661, L52
Mackey A.D., Gilmore G.F., 2004, MNRAS, 355, 504
Martin N.F., Ibata R.A., Bellazzini M., Irwin M.J., Lewis G.F., Dehnen W., 2004, MNRAS, 348, 12
Mendel J.T., Proctor R.N., Forbes D.A., 2007, MNRAS, 379, 1618
Merrifield M.R., Kuijken K., 1999, A&A, 345, 47
Oke J.B., Cohen J.G., Carr M., Cromer J., Dingizian A., Harris F.H., Labrecque S., Lucinio R., Schaal W., Epps H., Miller J., 1995, PASP, 107, 375
Olsen K.A.G., Miller B.W., Suntzeff N.B., Schommer R.A., Bright J., 2004, AJ, 127, 2674
Pierce M., Brodie J.P., Forbes D.A., Beasley M.A., Proctor R.N., Strader J., 2005, MNRAS, 358., 419
Pierce M., Bridges T., Forbes D.A., Proctor R.N., Beasley M.A., Gebhardt K., Faifer F.R., Forte J.C., Zepf S.E., Sharples R., Hanes D.A., 2006, MNRAS, 368. 325
Pritzl B.J., Venn K.A., Irwin M., 2005, AJ, 130, 2140
Proctor R.N., Sansom A.E., 2002, MNRAS, 333, 517
Proctor R.N., Forbes D.A., Beasley M.A., 2004a, MNRAS, 355, 1327
Proctor R.N., Forbes D.A., Hau G.K.T., Beasley M.A., De Silva G.M., Contreras R., Terlevich A.I., 2004b, MNRAS, 349, 1381
Proctor R.N., Forbes D.A., Forestell A., Gebhardt K., 2005, MNRAS, 362, 857
Rhode K.L., Zepf S.E., Kundu A., Larner A.N., astro-ph/0708.1166
Schroder L.L., Brodie J.P., Kissler-Patig M., Huchra J,P., Phillips A.C., 2002, AJ, 123, 2473
Searle L., Zinn R., 1978, ApJ, 225, 357
Strader J., Smith G., 2007, ApJ, submitted
Thomas D., Maraston C., Bender R., 2003, MNRAS, 339, 897
Tonry J.L., Dressler A., Blakeslee J.P., Ajhar E. A., Fletcher A.B., Luppino G.A., Metzger M.R., Moore C.B., 2001, ApJ, 546, 681
Trager S.C., Worthey G., Faber S.M., Burstein D., Gonzarlez J.J., 1998, ApJS, 116, 1
van den Bergh S., 1999, A&ARv, 9, 273
Worthey G., Ottaviani D.L., 1997, ApJS, 111, 377
Appendix A Lick indices
| GC | Ca4227 | G4300 | H | H | Fe4383 | Ca4455 | Fe4531 | C4668 | H | Fe5015 | Mgb | Fe5270 | Fe5335 | Fe5406 |
|---|---|---|---|---|---|---|---|---|---|---|---|---|---|---|
| gc03 | 0.613 | 2.496 | (-0.773) | 1.357 | 2.356 | 0.878 | 1.667 | 0.856 | 2.407 | (3.319) | (0.789) | 1.459 | 1.354 | 0.473 |
| 0.158 | 0.308 | (0.284) | 0.150 | 0.382 | 0.195 | 0.285 | 0.413 | 0.202 | (0.396) | (0.195) | 0.230 | 0.278 | 0.203 | |
| gc04 | 0.826 | (2.314) | -1.802 | (0.650) | 4.043 | (2.170) | 3.129 | 3.086 | 0.849 | 3.717 | 1.704 | 1.537 | 1.434 | 1.024 |
| 0.252 | (0.497) | 0.484 | (0.283) | 0.644 | (0.335) | 0.513 | 0.776 | 0.347 | 0.706 | 0.327 | 0.388 | 0.457 | 0.341 | |
| gc05 | 0.491 | 4.129 | -1.598 | 1.097 | (0.016) | 1.410 | 2.178 | 3.120 | 2.710 | 5.260 | (3.361) | 2.823 | 2.081 | (2.848) |
| 0.297 | 0.515 | 0.543 | 0.316 | (0.800) | 0.400 | 0.596 | 0.898 | 0.375 | 0.847 | (0.406) | 0.481 | 0.558 | (0.388) | |
| gc06 | 0.558 | 1.760 | 1.102 | 1.957 | (-0.892) | 0.026 | (4.640) | -0.698 | (2.973) | – | (2.502) | (2.594) | (3.365) | 0.975 |
| 0.272 | 0.498 | 0.457 | 0.268 | (0.756) | 0.368 | (0.505) | 0.823 | (0.334) | – | (0.349) | (0.401) | (0.459) | 0.360 | |
| gc07 | 0.674 | 1.421 | (2.184) | 2.137 | 1.481 | (1.445) | 1.969 | 1.189 | (1.944) | (-0.967) | 1.359 | 0.712 | (2.443) | (1.234) |
| 0.259 | 0.493 | (0.455) | 0.273 | 0.706 | (0.354) | 0.567 | 0.853 | (0.357) | (0.811) | 0.367 | 0.445 | (0.508) | (0.392) | |
| gc08 | 0.270 | (2.277) | 1.095 | (2.398) | 1.525 | 0.543 | 1.005 | (-0.971) | 2.817 | 1.963 | (0.889) | 0.527 | (-0.296) | 0.478 |
| 0.139 | (0.277) | 0.245 | (0.121) | 0.335 | 0.170 | 0.249 | (0.354) | 0.179 | 0.341 | (0.159) | 0.196 | (0.239) | 0.168 | |
| gc09 | 0.987 | 4.497 | (-1.567) | (1.870) | 4.216 | 1.480 | 2.695 | (3.496) | (3.054) | 4.700 | 2.082 | 1.809 | 2.001 | 1.139 |
| 0.146 | 0.288 | ( 0.274) | (0.138) | 0.347 | 0.176 | 0.261 | (0.375) | (0.192) | 0.374 | 0.177 | 0.213 | 0.250 | 0.183 | |
| gc10 | (2.085) | (4.412) | -6.486 | (-0.820) | 5.984 | 1.888 | 3.711 | (-0.545) | (3.132) | 4.335 | (5.628) | 3.803 | 3.382 | (-1.105) |
| (0.266) | (0.571) | 0.672 | (0.397) | 0.806 | 0.417 | 0.621 | (1.018) | (0.378) | 0.908 | (0.402) | 0.496 | 0.589 | (0.508) | |
| gc11 | (1.282) | 4.757 | -3.718 | 0.044 | 4.424 | 1.341 | 2.790 | 4.384 | 2.302 | (4.093) | 3.153 | 2.577 | – | 1.314 |
| (0.101) | 0.226 | 0.193 | 0.081 | 0.221 | 0.110 | 0.143 | 0.160 | 0.136 | (0.192) | 0.080 | 0.109 | – | 0.092 | |
| gc14 | (2.066) | (8.325) | (-6.007) | -0.872 | 3.526 | 1.497 | 2.655 | 2.910 | (2.760) | (7.069) | (6.047) | (3.092) | 2.487 | (2.594) |
| (0.152) | (0.310) | (0.349) | 0.198 | 0.427 | 0.219 | 0.314 | 0.454 | (0.214) | (0.407) | (0.181) | (0.232) | 0.278 | (0.193) | |
| gc16 | (1.335) | 4.365 | -4.644 | -0.772 | 4.343 | 1.316 | 1.977 | (0.293) | 1.886 | (5.444) | (1.715) | 2.616 | 1.721 | 1.147 |
| (0.177) | 0.350 | 0.364 | 0.211 | 0.454 | 0.236 | 0.354 | (0.530) | 0.237 | (0.463) | (0.227) | 0.255 | 0.311 | 0.226 | |
| gc17 | 0.812 | 2.337 | -0.019 | (1.640) | 1.692 | (0.951) | 1.631 | (0.399) | (2.379) | 2.857 | 1.007 | (1.963) | (1.882) | 0.660 |
| 0.134 | 0.277 | 0.247 | (0.124) | 0.331 | (0.167) | 0.241 | (0.340) | (0.177) | 0.324 | 0.151 | (0.178) | (0.220) | 0.159 | |
| gc18 | 0.602 | (4.593) | -1.077 | 0.433 | 1.818 | 1.729 | (-0.295) | (-3.244) | (3.752) | (6.285) | (6.797) | 1.817 | (2.002) | 0.362 |
| 0.191 | (0.358) | 0.379 | 0.223 | 0.553 | 0.259 | (0.452) | (0.660) | (0.273) | (0.597) | (0.260) | 0.364 | (0.429) | 0.340 | |
| gc19 | 0.347 | 2.742 | -0.704 | 1.413 | 2.508 | 0.893 | 2.543 | (1.323) | 1.885 | 3.133 | 1.415 | (2.099) | 1.694 | 0.657 |
| 0.168 | 0.319 | 0.299 | 0.160 | 0.404 | 0.208 | 0.307 | (0.454) | 0.214 | 0.426 | 0.205 | (0.241) | 0.292 | 0.217 | |
| gc21 | 0.414 | 0.368 | 2.799 | 3.054 | 1.560 | 0.614 | 0.488 | (-3.468) | 3.386 | 1.508 | (1.695) | -1.085 | 1.114 | 0.011 |
| 0.250 | 0.470 | 0.406 | 0.228 | 0.629 | 0.326 | 0.533 | (0.810) | 0.316 | 0.732 | (0.347) | 0.451 | 0.510 | 0.392 | |
| gc22 | 0.554 | 1.470 | 2.364 | (3.414) | 1.936 | 1.382 | -1.338 | – | – | (-0.760) | – | (-2.791) | (-3.424) | (3.388) |
| 0.350 | 0.795 | 0.672 | (0.393) | 1.015 | 0.570 | 0.967 | – | – | (1.420) | – | (0.840) | (1.076) | (0.642) |