Precise Half-Life Measurement of the
Superallowed emitter 10C
Abstract
The half-life of 10C has been measured to be 19.310(4) s, a result with 0.02% precision, which is a factor of three improvement over the best previous result. Since 10C is the lightest superallowed emitter, its value has the greatest weight in setting an upper limit on the possible presence of scalar currents.
pacs:
21.10.Tg,23.40.-s,27.20.+nI Introduction
For many years, measurements of superallowed transitions have resulted in increasingly precise tests of several key ingredients of the electroweak standard model: the Conserved Vector Current (CVC) hypothesis, the absence of scalar currents and the unitarity of the Cabibbo-Kobayashi-Maskawa (CKM) matrix. In particular, a recent survey HT05 of world data on superallowed decays confirmed CKM unitarity (to %) and two of the CVC assertions: that the vector coupling constant has the same value for all nine well-known transitions (%), and that the induced scalar interaction is consistent with zero (%). Furthermore, the latter result also ruled out any fundamental scalar interaction at the same level of precision.
All these are important results, but it is the test for scalar currents that motivates the present measurement. Each superallowed transition is characterized by an value, which is derived from its measured value by the inclusion of calculated corrections for radiative and isospin-symmetry-breaking effects HT05 . The test for scalar currents is based on how the values vary with the of the daughter nucleus: if there is no scalar current, then should be completely independent of ; if a scalar current were to exist, then the locus of values would show a slope (either up or down) that increases strongly – and would be most easily identifiable – at low HT05a . The decay of 10C is the lowest- example of a superallowed transition and thus is the most influential in probing for a scalar current.
The value that characterizes any -transition depends on three measured quantities: the total transition energy, , the half-life, , of the parent state and the branching ratio, , for the particular transition of interest. The -value is required to determine the statistical rate function, , while the half-life and branching ratio combine to yield the partial half-life, . The current value for 10C yields a value for with 0.05% precision; the branching ratio is known to 0.13%; and, before the measurement reported here, the half life was known to 0.06% HT05 . All these values can be improved. Our new half-life value for 10C has 0.02% precision and represents a first step in bringing the uncertainty in the value for this transition down from 0.15%, where it is now, to 0.04% or better, where the most precisely known values now lie. Such increased precision would correspondingly increase the sensitivity of the corrected value to the presence of a scalar interaction.
II Execution of the experiment
Our experimental set-up was similar to the one used in our recently reported measurement of the half-life of 34Ar Ia06 . Apart from the details specific to the 10C measurement, only a brief description will be presented here.
A primary beam of 11B at 23 MeV, produced by the superconducting cyclotron at Texas A&M University, impinged on a 1.6-atm hydrogen gas target cooled to liquid nitrogen temperature. The fully stripped ejectiles were then analyzed by the Momentum Achromat Recoil Separator (MARS), with the result that a 99.8% pure beam of radioactive 10C at 18.5 MeV was produced at the focal plane. This beam exited into air through a 51-m-thick kapton window, and then passed through a 0.3-mm thin BC-404 plastic scintillator and through a set of aluminum degraders, eventually being implanted in the 76-m-thick aluminized mylar tape of a fast tape-transport system. The combination of selectivity in MARS and range selectivity in the degraders resulted in no detectable impurities being present in the implanted samples.
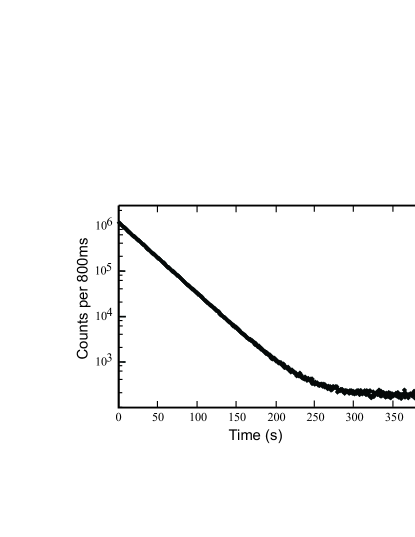
The 10C nuclei were collected in the tape for 10 s, then the beam was turned off and the activity was moved in 180 ms to the center of a 4 proportional gas counter. The gas counter was shielded against neutrons and gammas to reduce the background rate to a minimum. Once the activity arrived at the gas counter, the emitted positrons were detected with 95% efficiency and their signals multiscaled for 400 s, which is just over 20 half-lives of the 19.3-s 10C. The clock-controlled collect-move-detect cycles were repeated until the desired statistics were achieved. The time base for the acquired spectra was defined by a Stanford Research System pulser (Synthesized Function Generator, model DS345), which is accurate to 0.01 ppm. For this measurement, we recorded in this way a total of decays. The total decay spectrum, spanning nearly four decades in count rate, is presented in Figure 1.
In order to probe as carefully as possible for weak long-lived impurities, we also made measurements with two different collect-move-detect settings of 20 s-0.180 s-900 s and 120 s-0.180 s-900 s. Finally, we established room background under measurement conditions by recording data with the “normal” collect-move-detect settings but with the tape-move feature disabled.
Overall, great care was taken to test thoroughly for systematic effects caused by detection parameters. Signals from the gas detector were amplified and sent to a discriminator, whose output was split and processed in parallel by two separate systems, each with a different pre-set dominant non-extendable dead-time. The two data streams allowed us to test that our dead-time-corrected result was independent of the actual dead time of the circuit. In addition to this check, the overall measurement was also subdivided into many separate runs, differing from one another only in their detection parameters: dominant dead-time, detector bias and discriminator threshold.
Other special precautions were taken too. The tape-transport system is quite consistent in placing the collected source within 3 mm of the center of the detector, but it is a mechanical device, and occasionally larger deviations occur. Although there is no reason to expect that this could lead to a false half-life result, we separately recorded the number of implanted nuclei detected in the scintillator at the beginning of each cycle, and the number of positrons recorded in the gas counter during the subsequent count period. The ratio of the latter to the former is a sensitive measure of whether the source is seriously misplaced in the proportional counter. In analyzing the data later, we rejected the results from any cycle with an anomalous (low) ratio. This happened rarely: less than 1% of the cycles were rejected for this reason.
III Results
We analyzed the two measurements made with longer collect and detect times first in order to search for possible long-lived impurities. Only one very weak contaminent activity could be detected, and it proved not to have originated from the collected sample but instead from neutron activation of the copper housing of the gas detector. We identified 5.12-min 66Cu, produced from 65Cu(n,)66Cu. Although 64Cu was undoubtedly also produced from neutron capture on the other stable isotope of copper, 63Cu, only 66Cu needed to be considered in our subsequent analyses since 64Cu has a half-life of 12.7 hours and thus serves only to increase slightly the constant background. We determined that, under the timing conditions of our 10C half-life measurements, the activity of 66Cu produced by neutron activation was 0.03% of the activity of the 10C sample implanted in the tape each cycle. Although very small, this 66Cu contribution was nevertheless included in all our 10C decay analyses.
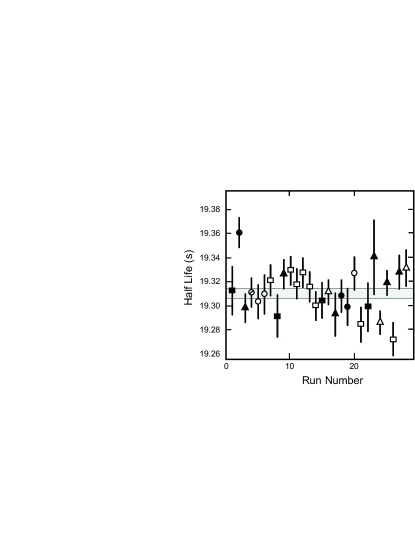
In all, we recorded data from 478 collect-move-detect cycles, divided into 28 separate runs, each characterized by a different combination of detector high-voltage, discriminator-threshold and dominant dead-time settings. We processed the data run-by-run, first by summing the dead-time-corrected spectra from all accepted cycles in each run. Then the 28 sum spectra were individually analyzed by a maximum-likelihood fit with a function incorporating two exponentials – for 10C and 66Cu – and a constant background. (The methods used were those described in Ref. Ko97 .) The 66Cu parameters in each run were fixed to its accepted half-life, 5.120(14) min Bh98 , and to an intensity determined by adjustment of the results from our contaminant tests to account for the actual collect and detect times of the particular run.
The half-life results from all 28 runs are plotted individually in Figure 2, where each point is identified with two of its parameter settings. It can be seen that there is no indication of a systematic dependence on detector bias or discriminator threshold. The results, which had already been dead-time corrected, were equally insensitive to the actual circuit dead time used in each run, although this parameter is not identified in the figure.
| Source | Uncertainty (ms) |
|---|---|
| counting statistics | 2.6 |
| 66Cu contaminant | 1.5 |
| dead time | 0.6 |
| detector bias | 2.0 |
| discriminator threshold | 2.5 |
| total uncertainty (ms) | 4.4 |
As a further systematic check, in this case on the fitting procedure, we generated by Monte Carlo techniques a set of spectra which matched, cycle by cycle, the statistics and composition of the data from each cycle. The half-life we used in generating these spectra was chosen to be similar to that of 10C. We then fitted these artificial data with the same techniques we used for the real data. The half-life we obtained from fitting our artificial data agreed with the input half-life within statistical uncertainties, thus validating the fitting procedure and the result obtained from it.
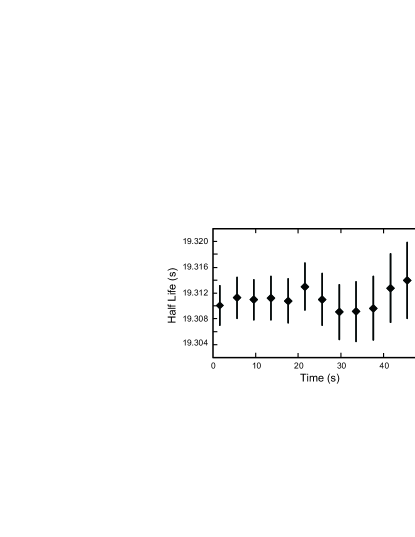
We also checked for the possible presence of unidentified short-lived impurities or other possible count-rate-dependent effects. We removed data from the first 4 s of the counting period in each measurement and refitted the remainder; then we repeated the procedure, removing the first 8 s, then 12 s and so on. As can be seen from Fig. 3, within statistics the derived half-life was also stable against these changes.
Our final result for the half life of 10C is 19.310(4) s. The quoted uncertainty contains contributions from a number of sources as itemized in Table 1. We determined the contribution from each experimental parameter – dead time, detector bias or discriminator threshold – by the spread in half-life averages obtained when all the data were grouped only according to the values set for that parameter. We obtained the contribution from the 66Cu contaminant by assuming that the uncertainty of its intensity equalled one-third of its total value. In all cases, we consider these to be very conservative estimates of the experimental and systematic uncertainties.
IV Conclusions
We have obtained the most precise value yet for the 10C half life, 19.310(4) s. This result – with 0.02% precision – can be compared with the only two previous measurements whose precision is within a factor of ten of that of the present measurement HT05 : 19.280(20) s Az74 and 19.295(15) Ba90 . Our value agrees with the more recent, 1990, result Ba90 within the latter’s uncertainty, and is not seriously different from the 1974 measurement Az74 . However, our precision is better than both by at least a factor of four. When all three results are averaged together, the resulting half-life is 19.308(4) s and, with the other properties for the superallowed decay of 10C taken from Ref. HT05 , the corresponding value becomes 3042.4(43) s. This represents a reduction in uncertainty from the previous value HT05 , 3039.5(47) s, now leaving the branching ratio and, to a lesser extent, the value as the major contributors to the overall uncertainty.
It is interesting to note that our new measurement of the half life increases the value for 10C as well as reducing its uncertainty. Naturally, its corrected value is increased as well, to 3077.4(46) s. This is slightly above the overall average of all well-known superallowed transitions HT05 and, if this tendency for 10C is reenforced by branching-ratio and -value measurements with improved precision, it could indicate the presence of a small contribution from a scalar current. Clearly, high priority should be attached to the remeasurement of these two quantities with improved precision.
Acknowledgements.
This work was supported by the U.S. Department of Energy under Grant No. DE-FG03-93ER40773 and by the Robert A. Welch Foundation under Grant No. A-1397.References
- (1) J.C. Hardy and I.S. Towner, Phys. Rev. C 71, 055501 (2005).
- (2) J.C. Hardy and I.S. Towner, Phys. Rev. Lett. 94, 092502 (2005).
- (3) V.T. Koslowsky, E. Hagberg, J.C. Hardy, G. Savard, H. Schmeing, K.S. Sharma and X.J. Sun, Nucl. Instr. and Meth. Phys. Res. A 401, 289 (1997).
- (4) V.E. Iacob, J.C. Hardy, J.F. Brinkley, C.A. Gagliardi, V.E. Mayes, N. Nica, M. Sanchez-Vega, G. Tabacaru, L. Trache, and R.E. Tribble, Phys. Rev. C 74, 055502 (2006).
- (5) M. R. Bhat, Nuclear Data Sheets 83, 789 (1998).
- (6) G. Azuelos, J.E. Crawford and J.E. Kitching, Phys. Rev. C 9, 1213 (1974).
- (7) P.H. Barker and G.D. Leonard, Phys. Rev. C 41, 246 (1990).