Supernovae in Low-Redshift Galaxy Clusters:
Observations by the Wise Observatory Optical Transient Search (WOOTS)
Abstract
We describe the Wise Observatory Optical Transient Search (WOOTS), a survey for supernovae (SNe) and other variable and transient objects in the fields of redshift 0.06–0.2 Abell galaxy clusters. We present the survey design and data-analysis procedures, and our object detection and follow-up strategies. We have obtained follow-up spectroscopy for all viable SN candidates, and present the resulting SN sample here. Out of the 12 SNe we have discovered, seven are associated with our target clusters while five are foreground or background field events. All but one of the SNe (a foreground field event) are Type Ia SNe. Our non-cluster SN sample is uniquely complete, since all SN candidates have been either spectroscopically confirmed or ruled out. This allows us to estimate that flux-limited surveys similar to WOOTS would be dominated () by SNe Ia. Our spectroscopic follow-up observations also elucidate the difficulty in distinguishing active galactic nuclei from SNe. In separate papers we use the WOOTS sample to derive the SN rate in clusters for this redshift range, and to measure the fraction of intergalactic cluster SNe. We also briefly report here on some quasars and asteroids discovered by WOOTS.
1 Introduction
Searches for extragalactic variable or transient astronomical phenomena are almost as old as modern optical astronomy. Well-known examples are the searches for extragalactic variable stars by Edwin Hubble (e.g., Hubble & Humason 1931) and his successors, and the pioneering searches for supernovae (SNe) by Fritz Zwicky (e.g., Zwicky, Humason, & Gates 1960). For many decades, these searches were mostly targeted at specific nearby (redshift ) galaxies or clusters. In the late 1980s, Norgaard-Nielsen et al. (1989) undertook a survey for SNe in more distant galaxy clusters, resulting in the discovery of a Type Ia supernova (SN Ia) in the cluster AC 118 (). This breakthrough achievement illustrated the potential of such surveys, though the observational costs of this project were considerable. Perlmutter et al. (1990, 1995) used the emerging new technologies of wide-field CCD imaging and image subtraction to carry out the first efficient surveys for high-redshift SNe in clusters and in the field. These methods, employed by large international collaborations (e.g., Perlmutter et al. 1997, Schmidt et al. 1998), have resulted in the discovery of hundreds of high- SNe Ia. Analysis of these objects indicates that the expansion of the Universe is currently accelerating (Riess et al. 1998, 2004, 2007; Perlmutter et al. 1999; Tonry et al. 2003; Knop et al. 2003; Astier et al. 2006; Wood-Vasey et al. 2007); see Filippenko (2005b) for a review.
SNe are not the only variable or transient objects that are luminous enough to be observed in distant galaxies. Other types of objects include variable active galactic nuclei (AGNs; e.g., Hawkins & Veron 1993; Gal-Yam et al. 2002; Sarajedini et al. 2006) of various sorts, and optical transients associated with cosmological gamma-ray bursts (GRBs; e.g. van Paradijs et al. 1997). We have undertaken a survey for SNe and other transient or variable sources in the fields of galaxy clusters, the Wise Observatory Optical Transient Search (WOOTS; Gal-Yam & Maoz 2000a,b; Gal-Yam et al. 2005). Our main motivation is to study SNe in galaxy clusters. In particular, measurement of the cluster SN Ia rate has interesting implications for SN Ia progenitors and the origin of metals in the intracluster medium (ICM; e.g., Gal-Yam, Maoz, & Sharon 2002; Maoz & Gal-Yam 2004). Another objective is to discover and quantify the occurrence of intergalactic SNe (Gal-Yam et al. 2003a).
Here, we describe the technical design of this survey, the data-analysis methods (§ 2), and the SNe we discovered (§ 3.1), along with a brief report on other types of objects (§ 3.2). In a companion paper (Sharon et al. 2007; Paper II) we derive from our SN sample a measurement of the rate of SNe in galaxy clusters. The discovery of intergalactic SNe by WOOTS was reported by Gal-Yam et al. (2003a).
2 Technical Design
2.1 The Cluster Sample
The cluster sample we surveyed was drawn from the only large galaxy-cluster catalog available at the time, by Abell, Corwin, & Olowin (1989; hereafter ACO). This catalog is based on selection of galaxy overdensities from photographic plates. It is thus prone to projection problems, particularly to superposition of several poor clusters or groups along the same line of sight, appearing as single richer systems. However, the catalog was shown to be largely uncontaminated by such superpositions in the redshift range considered for our study (; Lucey 1983). At the time WOOTS was initiated, no large, X-ray-selected cluster catalogs were available.
The clusters were selected using the following criteria. First, all ACO clusters with measured redshifts in the compilation of Struble & Rood (1991) were considered. This redshift range was chosen so as to include clusters that are generally more distant than those studied by previous search programs (e.g., Reiss et al. 1998; ), while still sufficiently nearby that SNe in the cluster galaxies are detectable with the m telescope at Wise Observatory. To ensure proper visibility from Wise, we limited the sample to northern-hemisphere clusters with declinations . Seeking to increase the number of galaxies per field, we selected only rich clusters (Abell richness class ) with an Abell galaxy count of . We also required that the radius of the clusters, as estimated by Leir & van den Bergh (1977), be smaller than , in order for most of the cluster galaxies to fall within the field of view of the Wise Observatory Tektronix CCD imager. Applying these cuts to the ACO catalog, we ended up with 161 galaxy clusters. During the survey runs, we observed two additional clusters that had similar properties and were known gravitational lenses. The final cluster sample, including 163 entries, is listed in Table 2.1111Due to technical difficulties in data acquisition and recovery, 23 clusters were excluded from the analysis in Paper II, and thus the cluster sample reported there includes only 140 clusters..
The cluster sample defined above is not uniformly distributed on the sky, with most of the targets at relatively high Galactic latitudes. In order to optimize the use of allocated telescope time, we supplemented our cluster target list with a secondary list of empty fields in the vicinity of the clusters residing in sparsely populated sky areas (Abell numbers 24–913; 2244–2694). This secondary list of targets was imaged when additional telescope time was available, after all suitable cluster targets had been imaged. These additional data were searched for SNe in the same manner as the cluster fields (leading, e.g., to the discovery of SN 1999fd).
| Target | Abell | RA | Declination | Redshift | Richness | Radius | Galaxy |
|---|---|---|---|---|---|---|---|
| Number | Number | (B1950) | (B1950) | Class | (arcmin) | Count | |
| 1 | 24 | 00h19m54s | 0.134 | 2 | 20 | 127 | |
| 2 | 31 | 00h24m30s | 0.160 | 2 | 10 | 90 | |
| 3 | 79 | 00h38m00s | 0.093 | 1 | 8 | 73 | |
| 4 | 84 | 00h39m12s | 0.103 | 1 | 8 | 76 | |
| 5 | 98 | 00h43m48s | 0.104 | 3 | 20 | 185 | |
| 6 | 115 | 00h53m18s | 0.197 | 3 | 13 | 174 | |
| 7 | 125 | 00h57m30s | 0.188 | 1 | 12 | 66 | |
| 8 | 136 | 01h01m24s | 0.157 | 2 | 12 | 99 | |
| 9 | 175 | 01h16m54s | 0.129 | 2 | 20 | 84 | |
| 10 | 234 | 01h38m18s | 0.173 | 1 | 11 | 76 | |
| 11 | 279 | 01h53m48s | 0.080 | 1 | 11 | 70 | |
| 12 | 293 | 01h59m24s | 0.163 | 2 | 15 | 87 | |
| 13 | 403 | 02h56m36s | 0.103 | 2 | 13 | 100 | |
| 14 | 410 | 03h01m18s | 0.090 | 1 | 14 | 70 | |
| 15 | Ms0440 | 04h40m31s | 0.190 | - | - | - | |
| 16 | 508 | 04h43m18s | 0.148 | 2 | 12 | 85 | |
| 17 | 509 | 04h45m06s | 0.084 | 1 | 15 | 72 | |
| 18 | 562 | 06h46m30s | 0.110 | 1 | 16 | 70 | |
| 19 | 588 | 07h33m36s | 0.160 | 1 | 12 | 78 | |
| 20 | 629 | 08h10m18s | 0.138 | 1 | 8 | 78 | |
| 21 | 655 | 08h21m48s | 0.124 | 3 | 14 | 142 | |
| 22 | 665 | 08h26m12s | 0.182 | 5 | 11 | 321 | |
| 23 | 750 | 09h06m24s | 0.162 | 3 | 18 | 142 | |
| 24 | 795 | 09h21m18s | 0.136 | 3 | 13 | 151 | |
| 25 | 801 | 09h25m12s | 0.192 | 2 | 9 | 81 | |
| 26 | 873 | 09h48m24s | 0.182 | 3 | 20 | 133 | |
| 27 | 913 | 09h59m48s | 0.168 | 1 | 8 | 65 | |
| 28 | 914 | 10h04m18s | 0.195 | 2 | 12 | 114 | |
| 29 | 917 | 10h04m12s | 0.132 | 1 | 12 | 66 | |
| 30 | 918 | 10h06m06s | 0.167 | 1 | 20 | 69 | |
| 31 | 922 | 10h06m18s | 0.190 | 2 | 10 | 85 | |
| 32 | 924 | 10h04m06s | 0.099 | 1 | 10 | 75 | |
| 33 | 947 | 10h11m36s | 0.177 | 1 | 16 | 77 | |
| 34 | 960 | 10h15m06s | 0.129 | 2 | 11 | 117 | |
| 35 | 968 | 10h17m24s | 0.195 | 2 | 9 | 119 | |
| 36 | 975 | 10h19m06s | 0.116 | 2 | 13 | 84 | |
| 38 | 1025 | 10h28m12s | 0.151 | 2 | 15 | 87 | |
| 39 | 1029 | 10h31m00s | 0.126 | 2 | 15 | 81 | |
| 40 | 1046 | 10h34m00s | 0.190 | 2 | 10 | 108 | |
| 41 | 1061 | 10h37m18s | 0.189 | 2 | 7 | 99 | |
| 42 | 1066 | 10h36m48s | 0.070 | 1 | 16 | 68 | |
| 43 | 1073 | 10h39m36s | 0.139 | 2 | 18 | 82 | |
| 44 | 1081 | 10h42m00s | 0.159 | 2 | 15 | 83 | |
| 45 | 1123 | 10h52m54s | 0.123 | 2 | 15 | 108 | |
| 46 | 1132 | 10h55m18s | 0.136 | 1 | 15 | 74 | |
| 47 | 1170 | 11h04m54s | 0.162 | 2 | 13 | 104 | |
| 48 | 1190 | 11h09m00s | 0.079 | 2 | 20 | 87 | |
| 49 | 1201 | 11h10m24s | 0.169 | 2 | 15 | 103 | |
| 50 | 1207 | 11h12m36s | 0.135 | 1 | 11 | 72 | |
| 51 | 1227 | 11h18m48s | 0.112 | 2 | 13 | 112 | |
| 52 | 1232 | 11h19m30s | 0.168 | 1 | 12 | 70 | |
| 53 | 1234 | 11h19m48s | 0.166 | 2 | 11 | 88 | |
| 54 | 1235 | 11h20m18s | 0.104 | 2 | 20 | 122 | |
| 55 | 1249 | 11h22m24s | 0.156 | 1 | 10 | 77 |
| Target | Abell | Right | Declination | Redshift | Richness | Radius | Galaxy |
|---|---|---|---|---|---|---|---|
| Number | Number | Ascension | (B1950) | Class | (arcmin) | Count | |
| 56 | 1255 | 11h24m24s | 0.166 | 1 | 13 | 77 | |
| 57 | 1264 | 11h24m36s | 0.127 | 2 | 20 | 99 | |
| 58 | 1278 | 11h27m36s | 0.129 | 3 | 15 | 151 | |
| 59 | 1302 | 11h30m30s | 0.116 | 2 | 15 | 85 | |
| 60 | 1307 | 11h30m12s | 0.083 | 1 | 13 | 71 | |
| 61 | 1345 | 11h38m36s | 0.109 | 1 | 13 | 71 | |
| 62 | 1349 | 11h39m24s | 0.136 | 1 | 17 | 66 | |
| 63 | 1356 | 11h39m54s | 0.070 | 1 | 10 | 77 | |
| 64 | 1360 | 11h40m30s | 0.154 | 1 | 9 | 66 | |
| 65 | 1372 | 11h42m54s | 0.113 | 1 | 10 | 70 | |
| 66 | 1381 | 11h45m42s | 0.117 | 2 | 15 | 92 | |
| 67 | 1401 | 11h49m30s | 0.165 | 3 | 17 | 153 | |
| 68 | 1406 | 11h50m36s | 0.118 | 1 | 10 | 69 | |
| 69 | 1408 | 11h51m12s | 0.110 | 1 | 15 | 72 | |
| 70 | 1412 | 11h53m06s | 0.084 | 2 | 13 | 86 | |
| 71 | 1413 | 11h52m48s | 0.143 | 3 | 16 | 196 | |
| 72 | 1415 | 11h53m12s | 0.159 | 1 | 10 | 66 | |
| 73 | 1421 | 11h54m24s | 0.119 | 1 | 10 | 65 | |
| 74 | 1437 | 11h57m54s | 0.134 | 3 | 13 | 154 | |
| 75 | 1445 | 11h59m12s | 0.169 | 2 | 13 | 81 | |
| 76 | 1446 | 11h59m18s | 0.104 | 2 | 17 | 85 | |
| 77 | 1470 | 12h04m24s | 0.192 | 2 | 12 | 93 | |
| 78 | 1474 | 12h05m24s | 0.079 | 1 | 18 | 70 | |
| 79 | 1477 | 12h06m24s | 0.111 | 1 | 5 | 71 | |
| 80 | 1495 | 12h10m24s | 0.143 | 2 | 15 | 123 | |
| 81 | 1497 | 12h11m36s | 0.167 | 2 | 14 | 101 | |
| 82 | 1504 | 12h12m48s | 0.184 | 2 | 14 | 98 | |
| 83 | 1514 | 12h15m24s | 0.199 | 3 | 18 | 132 | |
| 84 | 1524 | 12h19m12s | 0.137 | 2 | 6 | 103 | |
| 85 | 1528 | 12h20m30s | 0.154 | 1 | 12 | 75 | |
| 86 | 1539 | 12h24m00s | 0.171 | 2 | 12 | 96 | |
| 87 | 1548 | 12h26m30s | 0.161 | 3 | 10 | 155 | |
| 88 | 1552 | 12h27m18s | 0.084 | 1 | 11 | 75 | |
| 89 | 1553 | 12h28m18s | 0.165 | 2 | 10 | 100 | |
| 90 | 1562 | 12h31m48s | 0.190 | 1 | 11 | 77 | |
| 91 | 1566 | 12h32m48s | 0.101 | 2 | 10 | 91 | |
| 92 | 1607 | 12h41m00s | 0.136 | 2 | 12 | 82 | |
| 93 | 1617 | 12h45m24s | 0.152 | 3 | 9 | 139 | |
| 94 | 1632 | 12h50m36s | 0.196 | 2 | 10 | 80 | |
| 95 | 1661 | 12h59m24s | 0.167 | 2 | 10 | 97 | |
| 96 | 1667 | 13h00m24s | 0.165 | 2 | 10 | 98 | |
| 97 | 1674 | 13h01m42s | 0.107 | 3 | 12 | 165 | |
| 98 | 1677 | 13h03m30s | 0.183 | 2 | 9 | 112 | |
| 99 | 1678 | 13h03m00s | 0.170 | 1 | 8 | 78 | |
| 100 | 1679 | 13h04m12s | 0.170 | 2 | 10 | 115 | |
| 101 | 1681 | 13h03m24s | 0.091 | 1 | 10 | 79 | |
| 102 | 1697 | 13h10m42s | 0.183 | 2 | 9 | 84 | |
| 103 | 1731 | 13h20m48s | 0.193 | 2 | 15 | 92 | |
| 104 | 1738 | 13h23m12s | 0.115 | 2 | 18 | 85 | |
| 105 | 1741 | 13h22m42s | 0.075 | 1 | 15 | 73 | |
| 106 | 1759 | 13h31m36s | 0.168 | 3 | 10 | 132 | |
| 107 | 1760 | 13h31m42s | 0.171 | 3 | 11 | 168 | |
| 108 | 1763 | 13h33m06s | 0.187 | 3 | 10 | 152 | |
| 109 | 1767 | 13h34m12s | 0.070 | 1 | 18 | 65 | |
| 110 | 1773 | 13h39m36s | 0.078 | 1 | 10 | 66 |
| Target | Abell | Right | Declination | Redshift | Richness | Radius | Galaxy |
|---|---|---|---|---|---|---|---|
| Number | Number | Ascension | (B1950) | Class | (arcmin) | Count | |
| 111 | 1774 | 13h39m00s | 0.169 | 2 | 10 | 81 | |
| 112 | 1780 | 13h42m06s | 0.079 | 1 | 16 | 71 | |
| 113 | 1795 | 13h46m42s | 0.062 | 2 | 18 | 115 | |
| 114 | 1827 | 13h55m54s | 0.067 | 1 | 16 | 68 | |
| 115 | 1852 | 14h01m36s | 0.181 | 1 | 9 | 77 | |
| 116 | 1880 | 14h10m54s | 0.141 | 1 | 15 | 67 | |
| 117 | 1889 | 14h14m30s | 0.186 | 2 | 11 | 112 | |
| 118 | 1892 | 14h10m24s | 0.091 | 1 | 7 | 79 | |
| 119 | 1904 | 14h20m18s | 0.071 | 2 | 20 | 83 | |
| 120 | 1909 | 14h21m48s | 0.146 | 1 | 16 | 79 | |
| 121 | 1911 | 14h22m24s | 0.191 | 2 | 8 | 80 | |
| 122 | 1914 | 14h24m00s | 0.171 | 2 | 13 | 105 | |
| 123 | 1918 | 14h23m54s | 0.140 | 3 | 10 | 142 | |
| 124 | 1920 | 14h25m42s | 0.131 | 2 | 12 | 103 | |
| 125 | 1926 | 14h28m18s | 0.132 | 2 | 15 | 112 | |
| 126 | 1936 | 14h32m54s | 0.139 | 1 | 8 | 69 | |
| 127 | 1937 | 14h33m00s | 0.139 | 2 | 8 | 99 | |
| 128 | 1940 | 14h33m54s | 0.140 | 3 | 13 | 130 | |
| 129 | 1954 | 14h39m54s | 0.181 | 2 | 8 | 120 | |
| 130 | 1966 | 14h42m48s | 0.151 | 2 | 5 | 104 | |
| 131 | 1979 | 14h48m54s | 0.169 | 2 | 9 | 108 | |
| 132 | 1984 | 14h50m12s | 0.124 | 2 | 11 | 93 | |
| 133 | 1986 | 14h50m54s | 0.118 | 1 | 10 | 67 | |
| 134 | 1990 | 14h51m36s | 0.127 | 3 | 11 | 140 | |
| 135 | 1999 | 14h52m36s | 0.103 | 1 | 16 | 68 | |
| 136 | 2005 | 14h56m36s | 0.126 | 2 | 11 | 105 | |
| 137 | 2008 | 14h57m48s | 0.181 | 2 | 9 | 93 | |
| 138 | 2009 | 14h58m00s | 0.153 | 1 | 10 | 66 | |
| 139 | 2029 | 15h08m30s | 0.077 | 2 | 20 | 82 | |
| 140 | 2048 | 15h12m48s | 0.094 | 1 | 13 | 75 | |
| 141 | 2053 | 15h14m42s | 0.113 | 1 | 10 | 75 | |
| 142 | 2061 | 15h19m12s | 0.078 | 1 | 20 | 71 | |
| 143 | 2062 | 15h19m18s | 0.112 | 1 | 15 | 69 | |
| 144 | 2069 | 15h21m54s | 0.116 | 2 | 13 | 97 | |
| 145 | 2089 | 15h30m36s | 0.073 | 1 | 20 | 70 | |
| 146 | 2100 | 15h34m30s | 0.153 | 3 | 10 | 138 | |
| 147 | 2122 | 15h42m36s | 0.065 | 1 | 8 | 68 | |
| 148 | 2172 | 16h15m06s | 0.139 | 1 | 8 | 69 | |
| 149 | 2198 | 16h26m30s | 0.080 | 2 | 6 | 85 | |
| 150 | 2213 | 16h34m54s | 0.160 | 1 | 8 | 75 | |
| 151 | 2218 | 16h35m42s | 0.171 | 4 | 10 | 214 | |
| 152 | 2235 | 16h53m18s | 0.151 | 1 | 8 | 73 | |
| 153 | 2240 | 16h54m00s | 0.138 | 3 | 14 | 165 | |
| 154 | 2244 | 17h00m54s | 0.097 | 2 | 16 | 89 | |
| 155 | 2255 | 17h12m12s | 0.081 | 2 | 20 | 102 | |
| 156 | 2283 | 17h44m54s | 0.183 | 1 | 10 | 65 | |
| 157 | 2355 | 21h32m48s | 0.124 | 2 | 8 | 112 | |
| 158 | 2356 | 21h33m12s | 0.116 | 2 | 16 | 89 | |
| 159 | 2390 | 21h51m12s | 0.231 | - | - | - | |
| 160 | 2471 | 22h39m18s | 0.108 | 2 | 10 | 92 | |
| 161 | 2616 | 23h30m42s | 0.183 | 2 | 7 | 94 | |
| 162 | 2623 | 23h32m30s | 0.178 | 3 | 11 | 142 | |
| 163 | 2694 | 00h00m00s | 0.096 | 3 | 13 | 132 |
2.2 Observations, Reduction, and Analysis
2.2.1 Observing Strategy
The main objective of WOOTS, to detect SNe out to , is challenging for an imaging survey with a m telescope. We used s unfiltered images which, under good conditions at Wise, reach a point-source detection limit equivalent to mag (; tied to photometric zeropoints derived from USNO-A1 catalog magnitudes; Monet et al. 1998). Unfiltered images obtained with the Wise cameras typically reach flux limits that are a factor of fainter than broad-band or imaging. This allowed us to detect bright SNe Ia (with a peak -band magnitude of at ), as well as somewhat fainter events. We were allocated nights per month on the Wise m, and were able to observe approximately 40 cluster fields per night. In Paper II we discuss in some detail the photometric calibration of WOOTS unfiltered magnitudes using Sloan Digital Sky Survey (SDSS) data that have subsequently become available.
We split the s observation of each field into s frames that were obtained within an interval of min. The splits allowed us to reject cosmic rays and chip defects, while the time staggering is important for locating Solar System objects that may appear to be stationary transient sources if one obtains only a single image.
Between Oct. 1997 and Dec. 1999 we used the Tektronix CCD imager, which is a thinned, back-illuminated chip with pixels, each on a side, resulting in a field of view. In Mar. 2000, we commissioned and began using a new, blue-sensitized SITe CCD camera having pixels, each on a side, with a total field of view of . However, initial technical problems with the camera electronics and operating system, as well as increased problems in data analysis, limited the results from these observations. Only one supernova, SN 2001al, was discovered with the SITe CCD. In Paper II, we analyze only the 1997–1999 observations taken with the Tektronix CCD.
2.2.2 Data Reduction
Bias-subtracted WOOTS images were reduced in the following manner. We constructed “superflat” calibration frames from the actual science data by median combining the stacks of images obtained each night. This method worked well and was far superior to using twilight-sky images (“sky flats”) or images of an illuminated white calibration surface (“dome flats”), probably due to the difference in color between the calibration illuminating source (twilight sky or dome lamps) and the color of the night sky across our extremely wide unfiltered band. Good superflats were obtained provided that two requirements were met – a lack of variable illumination (e.g., by the Moon), and inclusion of some minimum number of different fields in the superflat stack. We found that at least eight different fields were needed to create an acceptable superflat calibration frame. Moon illumination was generally not a problem since most of the observations were obtained close to new moon. While reducing data obtained during nights in which a sizable fraction of the images were moderately affected by moonlight, we have found that using two superflat frames (constructed from dark and slightly illuminated images separately) provided a good solution for most of the data. A small number of images which were strongly affected by moonlight were useless for our search and were discarded.
Debiased and flattened images were registered to a reference frame defined by previous images of each field using a triangulation algorithm developed by Giveon (2000)222available from ftp://wise-ftp.tau.ac.il/pub/eran/IRAF/xyshift.f .. When needed, additional correction for field rotation (due to inaccurate setting of the telescope rotator angle) was performed using the geomap and geotran tasks within IRAF 333IRAF (Image Reduction and Analysis Facility) is distributed by the National Optical Astronomy Observatories, which are operated by AURA, Inc., under cooperative agreement with the National Science Foundation.. Finally, individual sub-exposures of each field were summed to obtain the final, s frame.
2.2.3 Image Subtraction
In order to discover variable or transient objects, we compared every new image with a previously obtained reference frame. To initiate efficient follow-up observations of interesting candidate objects (both imaging and spectroscopy; see below), we needed to handle large amounts of data (several tens of fields surveyed each night of the project) and to detect variable sources during each observing run or shortly thereafter. This required the construction of an automated analysis pipeline. We used image subtraction to detect variable sources in the images, with the advantage that any constant, underlying light, even if bright compared to the variable source, is removed. The required matching of the point-spread functions (PSFs) of new and reference images was done using the IRAF task psfmatch. As this method includes a division in Fourier space, it introduces noise at high spatial frequencies that are poorly sampled by the discrete data. We found that, in the case of WOOTS images, this noise was manifested as residuals in the centers of bright galaxies and stars, limiting our ability to detect faint nuclear variability in galaxies and increasing the number of false candidates. However, the overall performance was acceptable, and allowed good detection of non-nuclear sources and of brighter sources in galaxy cores.
An alternative algorithm has been presented by Alard & Lupton (1998) and Alard (2000). This method (commonly referred to as “ISIS”) does not perform calculations in Fourier space. A software package implementing the ISIS algorithm was made publicly available by C. Alard. We obtained this package in 2000, and experimented with it during the last phases of WOOTS. We found that ISIS generally performs image subtractions superior to the results obtained with psfmatch. However, its mode of operation as a “black box,” with the user having almost no influence on the selections made by the program, caused it to fail occasionally (e.g., due to selection of image sections that are contaminated by saturated stars).
Motivated by the inadequate performance of psfmatch, and in particular, the limited sensitivity of WOOTS data to nuclear variability due to residual subtraction artifacts, we have also developed an alternative subtraction algorithm, the common PSF method (CPM; Gal-Yam et al. 2004; see Appendix A). Unfortunately, both of the new algorithms (CPM and ISIS) were not available during most of the time WOOTS was in operation.
Following the use of psfmatch in our analysis pipeline, the images, now having similar PSFs, were next linearly scaled in flux using the IRAF task linmatch. The reference image was then subtracted from the new image to create a difference image. Variable or transient sources appeared as positive or negative residuals in this image. Image subtraction involves a increase in Poisson noise, in addition to possible subtraction residuals. Therefore, the faintest variable sources we could typically detect had variable flux equivalent to mag.
2.2.4 Variability Detection
The difference images produced by the image subtraction pipeline were systematically searched for residuals using the findstar package written by E. Almoznino444See ftp://wise-ftp.tau.ac.il/pub/nan/findst.ps.gz ., which proved superior to the more commonly used daofind IRAF task. Chip defects and residuals from saturated, bright, or known variable stars were automatically excluded. For residuals detected at the level in the difference images, we required that a object be detected in all three sub-exposures that were combined to create the new image. This cut rejected the vast majority of cosmic-ray hits, as well as many of the faster-moving Solar System objects, which appear at a different position in each sub-exposure. The final candidate lists (between zero and a few tens per field) were scanned by eye, and obvious artifacts rejected. The remaining objects were further studied (e.g., by searching the same locations in previous images) and all convincing candidates were flagged for follow-up observations.
2.2.5 Follow-up Data
Our follow-up observations consisted of photometric confirmation using the Wise Observatory m telescope, and spectroscopy with various larger telescopes. Follow-up photometry of candidate variable or transient objects was secured as part of the WOOTS program. As soon as we identified a good candidate source (many times while the WOOTS observing run was still in progress), we imaged the field again, in order to confirm (or refute) the validity of the source. A field in which an interesting object (usually a SN) was discovered was given a high priority for imaging in future WOOTS runs. Thus, if an object was still visible during subsequent runs (typically spaced by one month), its light curve would be sampled further. Sources discovered after a WOOTS run was already finished were often confirmed on subsequent nights, courtesy of our colleagues at Wise. All of our sources ended up having two or more photometry points within 1 week of discovery.
For each source, we tried to get at least one filtered observation to supplement our unfiltered data and to enable us to report the magnitude of the object in a standard system. Such -band magnitudes (calibrated relative to nearby sources from the USNO A.1 catalog) are reported in Table 2. Unfortunately, our data were usually not of sufficient quality to produce meaningful light curves for our SNe (see Appendix A for the exception), and typically consist of two detections within week, at similar flux levels, followed by non-detections in later runs.
Prompt spectroscopy was used to identify the SN types (see below), utilizing a variety of telescopes, as listed in Table 3. For a few events, late-time spectroscopy (obtained long after the SN had faded) was obtained using the low-resolution imaging spectrometer (LRIS; Oke et al. 1995) mounted on the Keck-I 10 m telescope, in order to determine the host-galaxy redshift or to identify AGN activity.
3 Results
3.1 Supernovae
3.1.1 SN Identification
During the course of WOOTS, we discovered many variable and transient objects. The selection of a clean sample containing only SNe was performed in the following manner. First, we rejected variable point sources (i.e., sources that appear point-like in all available epochs, and vary) which are either variable stars or AGNs. We were left with candidates that appeared either as new point sources superposed on or near galaxies, or transient sources that appeared for a short period of time and then faded away (with no apparent host galaxy). Both classes of sources contain a mixture of SNe and AGNs.
The first class contains “regular” SNe superposed on their host galaxies, and AGNs with resolved hosts. The second class (which is less common) contains “hostless” SNe, either cluster intergalactic SNe (2 such events detected; Gal-Yam et al. 2003a) or possibly SNe whose hosts are too faint to detect in our imaging data (see, e.g., Strolger et al. 2002; the WOOTS sample, as it turns out, did not contain such events). This class also contains AGNs below our detection limit that become visible during bright flares. Such a faint, variable, background AGN was projected near a foreground galaxy in the field of the cluster Abell 24 and was initially reported as SN 1999de. The AGN nature of the event became evident from follow-up imaging obtained with the Keck I telescope in 2005, and confirmed spectroscopically (Gal-Yam 2005).
We rejected some AGNs from the above sample using their photometric properties. If follow-up imaging showed that a nuclear SN candidate behaves in a manner which is not expected of a SN (i.e., it exhibits an extended period of optical variability containing several rebrightenings), it was flagged as an AGN. Follow-up spectroscopy of several such examples always showed that this was indeed the case. We did not reject any SN candidate, though, based on its nuclear location alone. Final distinction between SNe and AGNs required spectroscopic follow-up observations. These were preferentially obtained shortly after discovery, and allowed us to confirm the SN nature of candidates and to determine the SN type and redshift. Detailed discussion of SNe 1998fc and 2001al is presented by Gal-Yam et al. (2003a), and their spectra are shown there (Figures 3.1 and 3.2). An initial determination of the SN redshifts, ages, and types (Gal-Yam 2003) was done by comparing the observed spectra to redshifted versions of high signal-to-noise ratio (S/N) template spectra of nearby SNe, of various types and ages (see Filippenko 1997 for a review), drawn from the spectroscopic archive presented by Poznanski et al. (2002). A detailed description of the procedure used is given by Gal-Yam et al. (2003a). Usually, a second- or third-order polynomial was fitted and subtracted from both the spectra and the templates, in order to remove continuum variations due to instrumental and reddening effects, as well as (crudely) any host-galaxy contamination.
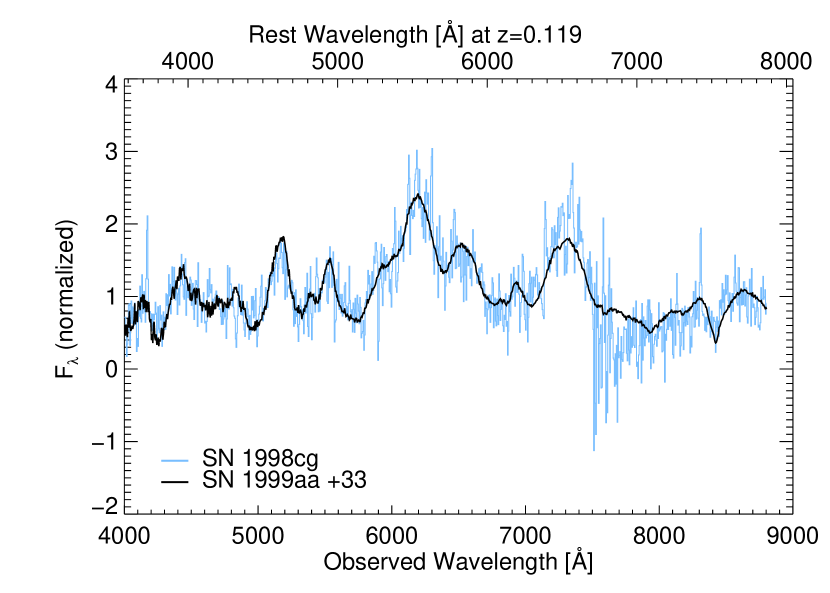
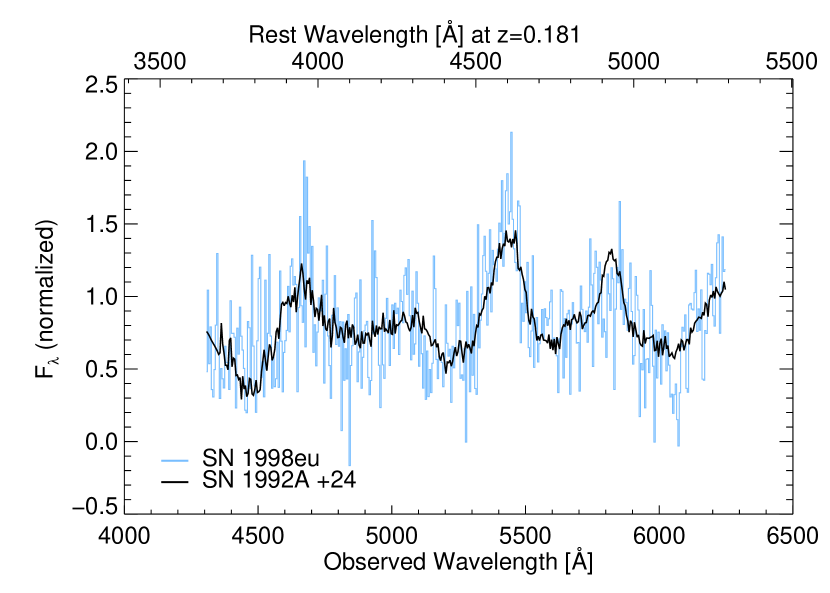
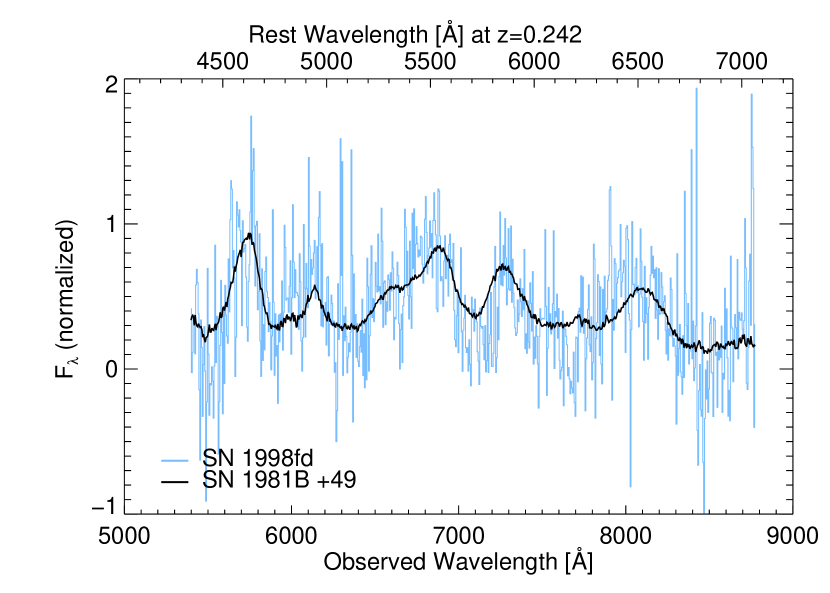
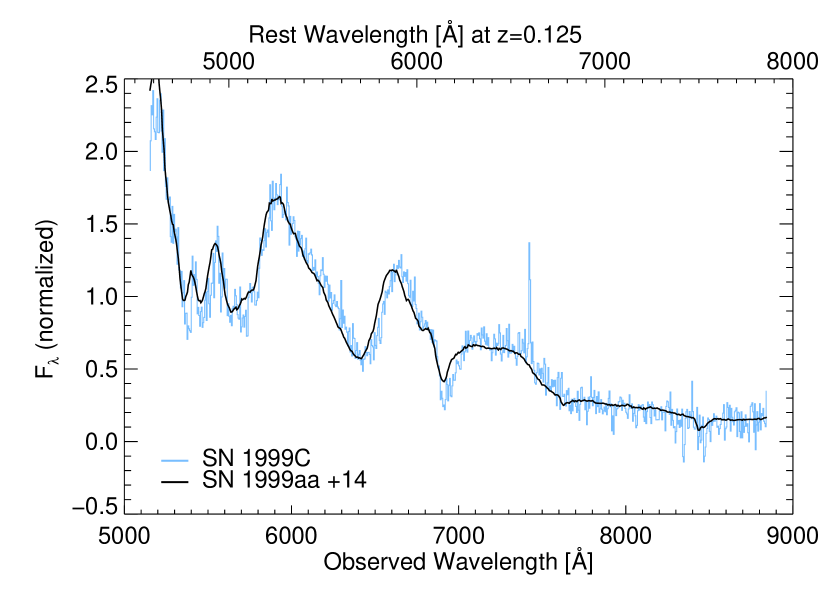
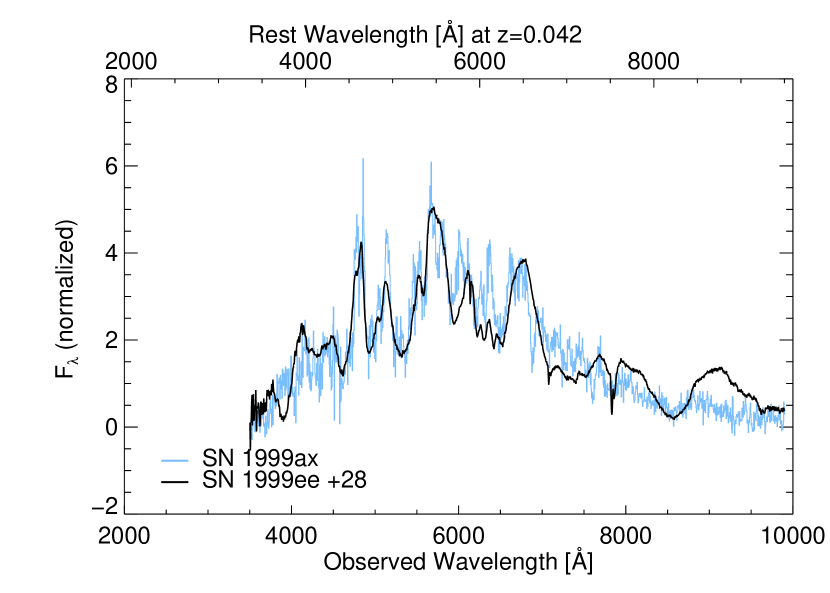
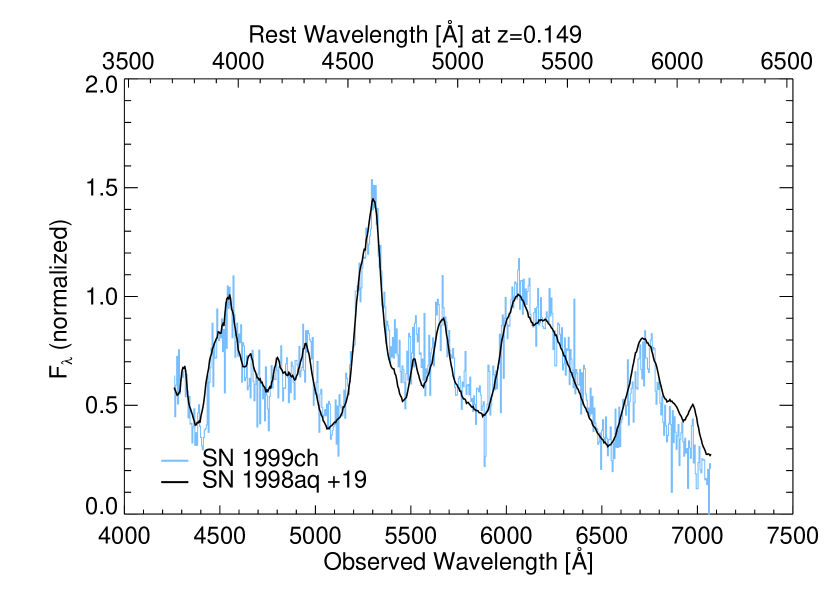
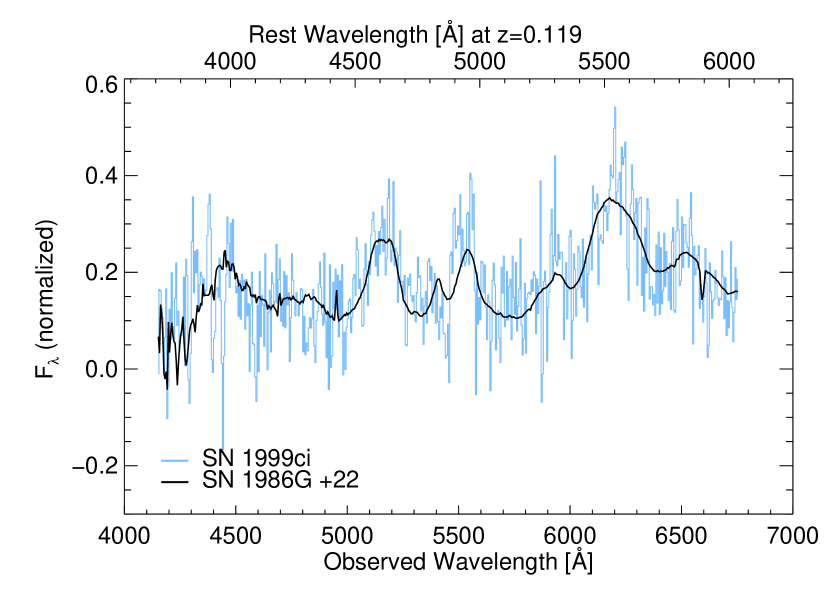
For the final analysis we present here, we have employed the Superfit SN spectral identification software package (Howell et al. 2005) in the following manner. When possible, we have determined the host-galaxy redshift from narrow emission lines. Next, we have run Superfit on each spectrum using the measured redshift (when known) or a large range of redshifts in all other cases. The software was set to investigate all SN types and to attempt to fit an unknown extinction ( mag) and host-galaxy contamination. The best-fit results are presented in Figures 2–9 below. In all but two cases, the identifications are obvious, and confirm the analysis of Gal-Yam (2003).
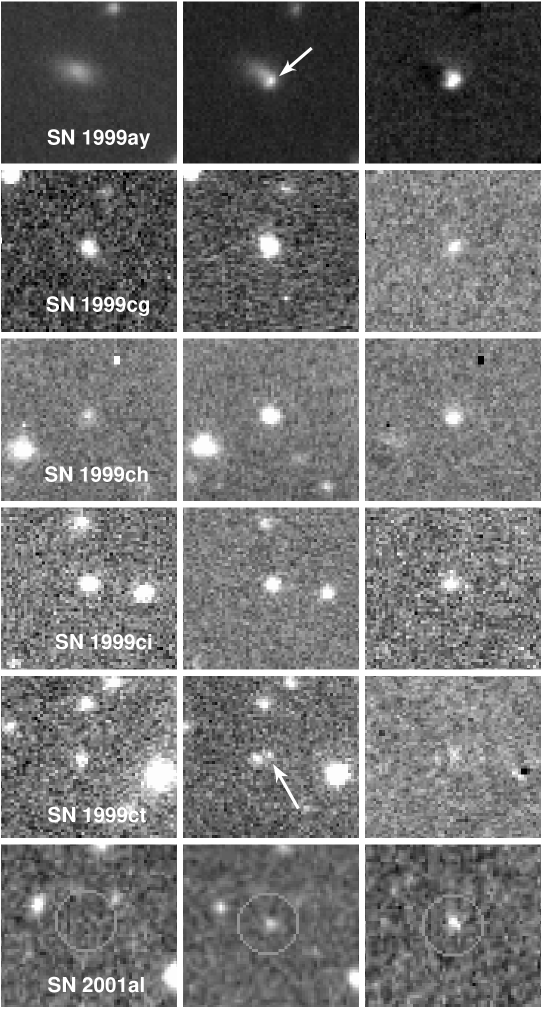
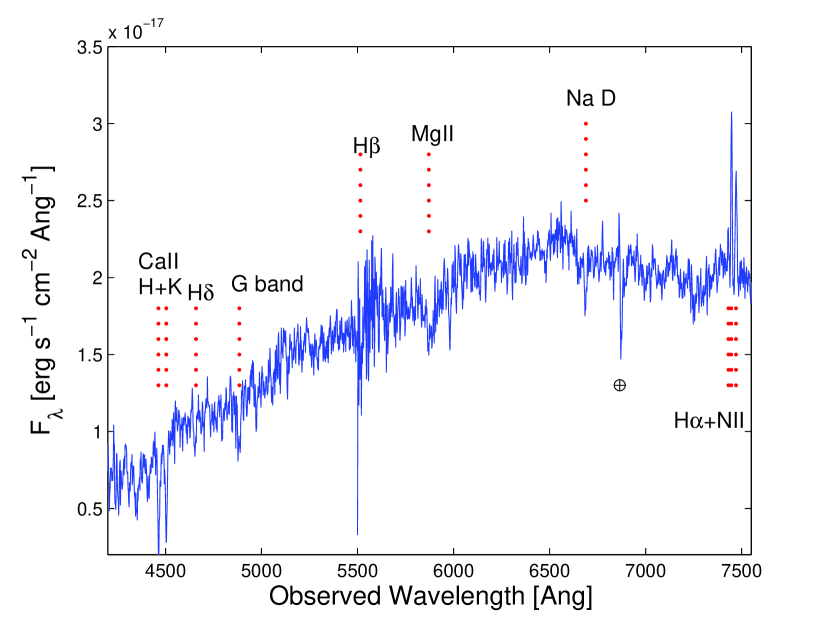
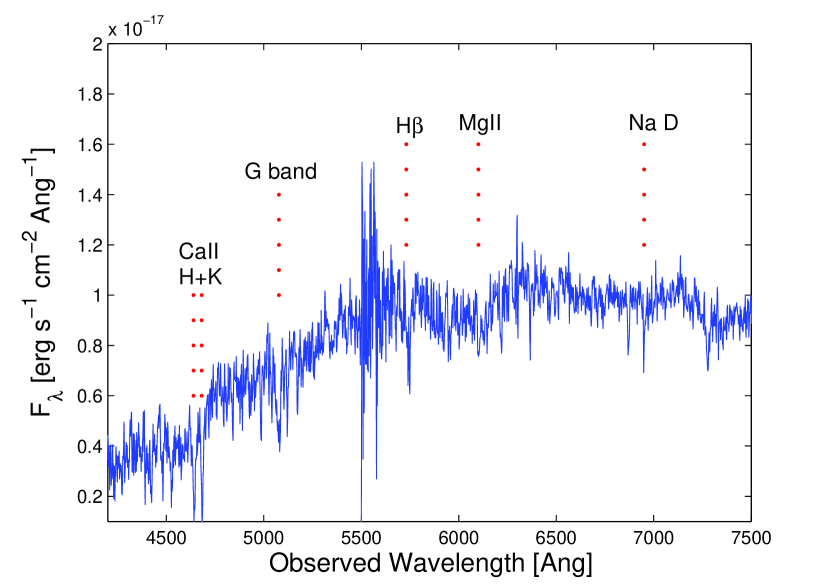
The spectra of SN 1999cg and SN 1999ct are noisy, and strongly contaminated by host-galaxy light. Comparison of these spectra to that of SN 1999ci, which combines the signal from a confirmed old SN Ia with significant contamination from a cluster galaxy, reveals strong similarity, and suggests that these are also cluster SNe Ia (Gal-Yam 2003), but our Superfit analysis does not provide conclusive identifications. We have therefore obtained high S/N follow-up spectroscopy of the host galaxies of these SNe (Fig. 10, Fig. 11). The data confirm that these are early-type galaxies, lacking signatures of recent star formation, at the cluster redshifts. Non-Type-Ia SNe are rarely observed in such galaxies. In view of their photometric behavior and the lack of any AGN signatures, we thus conclude that both SN 1999cg and SN 1999ct were most likely SNe Ia.
Spectroscopy of all other candidates, beyond the 12 SNe mentioned above, showed that they were AGNs. Images of the SNe are shown in Fig. 1, and their properties are summarized in Table 2. Spectroscopic observations are reported in Table 3 and shown in Figures 2–9. A brief description of the AGNs we found is provided below (§ 3.2).
| SN | Type | Redshift | Cluster | RA & Dec | Offsets | Discovery | Referenceg | ||
|---|---|---|---|---|---|---|---|---|---|
| (Redshift) | (J2000)a | (from host)b | [mag]c | Dated | Templatee | ||||
| 1998cg | Ia | 0.119 | A1514 (0.199) | E | 18.5 | 980501 | 980401 | (1) | |
| N | 980513 | ||||||||
| 1998eu | Ia | 0.181 | A125 (0.188) | 20.7 | 981114 | 980724 | (2) | ||
| 981117 | |||||||||
| 1998fcf | Ia | 0.1023 | A403 (0.103) | 20.5 | 981220 | 980114 | (3) | ||
| 990107 | |||||||||
| 1998fd | Ia | 0.24 | Field | E | 21.3 | 981224 | 980115 | (3) | |
| N | 990109 | ||||||||
| 1999C | Ia | 0.125 | A914 (0.195) | E | 19.8 | 990114 | 980331 | (4) | |
| 990115 | |||||||||
| 1999ax | Ia | 0.05 | A1852 (0.181) | W | 18.5 | 990320 | 980625 | (5) | |
| N | 990407 | ||||||||
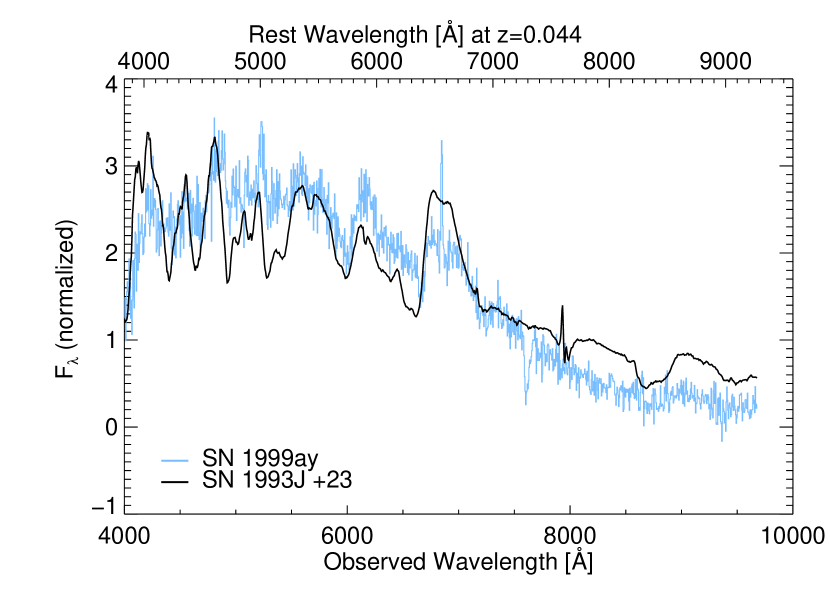
| 1999ay | IIb | 0.044 | A1966 (0.151) | W | 18.0 | 990321 | 980727 | (5) | |
| S | 990322 | ||||||||
| 1999cg | Ia | 0.135 | A1607 (0.136) | 20.0 | 990415 | 990320 | (6) | ||
| 990512 | |||||||||
| 1999ch | Ia | 0.15 | A2235 (0.151) | W | 19.8 | 990513 | 990502 | (6) | |
| 990516 | |||||||||
| 1999ci | Ia | 0.12 | A1984 (0.124) | 20.4 | 990515 | 980527 | (6) | ||
| 990523 | |||||||||
| 1999ct | Ia | 0.180 | A1697 (0.183) | W | 21.2 | 990613 | 990215 | (7) | |
| N | 990615 | ||||||||
| 2001alf | Ia | 0.0723 | A2122/4 (0.0661) | 21.4 | 010326 | 000820 | (8) | ||
| 010328 | |||||||||
Notes:
a Astrometry was performed with respect to nearby USNO-A sources, with typical precision better than in each coordinate.
b Blank entry indicates SN superposed on the nucleus of a compact host for which no offsets are detected.
c Photometry was calibrated onto an -band grid of nearby USNO-A sources, with an average scatter of mag. However, individual values may suffer up to 0.5 mag offsets due to uncertainties in the USNO-A plate-to-plate calibration (Ofek 2000).
d Dates of discovery (upper) and confirmation (lower).
e Date of the latest image (obtained prior to the discovery date) in which the SN does not appear.
f No host galaxy detected.
g References: 1. IAUC 6917 (Gal-Yam & Maoz 1998a); 2. IAUC 7055 (Gal-Yam & Maoz 1998b); 3. IAUC 7082 (Gal-Yam & Maoz 1998a); 4. IAUC 7088 (Gal-Yam & Maoz 1999b); 5. IAUC 7130 (Gal-Yam et al. 1999); 6. IAUC 7181 (Gal-Yam & Maoz 1999c); 7. IAUC 7210 (Gal-Yam & Maoz 1999d); 8. IAUC 7607 (Gal-Yam & Maoz 2001).
| Observed | Telescope + | Observers | Observing | Estimated | Referenceb |
|---|---|---|---|---|---|
| SN | Instrument | Date | SN Agea | ||
| 1998cg | ESO 3.6m + EFOSC2 | Patat & Turatto | 980530 | 33 | (1) |
| 1998eu | AAT 4m + RGO | Stathakis, Cannon, & James | 982111 | 24 | (2) |
| 1998fc | ESO 3.6m + EFOSC2 | Leisy, Hainaut, & Sekiguchi | 990114 | (3) | |
| Keck II + LRIS | Filippenko, Leonard, & Riess | 990120 | 25–42 | (4) | |
| 1998fd | Keck II + LRIS | Filippenko, Leonard, & Riess | 990119 | 49 | (4) |
| 1999C | Keck II + LRIS | Filippenko, Leonard, & Riess | 990120 | 14 | (5) |
| 1999ax | KPNO 4m + RC | Aldering | 990407 | 28 | (6) |
| AAT 4m + RGO | Stathakis | 990409 | (6) | ||
| 1999ay | KPNO 4m + RC | Aldering | 990407 | 23 | (6) |
| 1999cg | Keck II + LRIS | Sorenson & Schaefer | 990530 | (7) | |
| (host) | Keck I + LRIS | Gal-Yam & Sharon | 070716 | (8) | |
| 1999ch | KPNO 4m + RC | Pogge | 990608 | 19 | (9) |
| 1999ci | KPNO 4m + RC | Pogge | 990609 | 22 | (9) |
| 1999ct | Keck II + LRIS | Guhathakurta | 990806 | (10) | |
| (host) | Keck I + LRIS | Gal-Yam & Sharon | 070716 | (8) | |
| 2001al | Keck I + LRIS | Filippenko, Barth, & Leonard | 010329 | 21–33 | (11) |
Notes:
a SN age, at the time of spectroscopy, given in days relative to -band maximum.
b References: 1. IAUC 6925 (Patat & Turatto 1998); 2. IAUC 7082 (Gal-Yam & Maoz 1999a); 3. IAUC 7093 (Gal-Yam & Maoz 1999e); 4. IAUC 7091 (Filippenko, Leonard, & Riess 1999a); 5. IAUC 7092 (Filippenko, Leonard, & Riess 1999b); 6. IAUC 7357 (Gal-Yam & Maoz 2000c); 7. IAUC 7198 (Gal-Yam, Maoz, & Guhathakurta 1999); 8. This work; 9. IAUC 7199 (Gal-Yam, Maoz, & Pogge 1999); 10. IAUC 7356 (Gal-Yam, Maoz, & Guhathakurta 2000); 11. IAUC 7607 (Filippenko, Barth, & Leonard 2001).
![[Uncaptioned image]](/html/0711.0808/assets/x1.png)
3.1.2 The WOOTS SN Sample
In total, we discovered 12 SNe in the course of WOOTS. Of those, seven occurred in cluster galaxies, while the rest were field events. Eleven of the SNe, including all cluster events, are SNe Ia, based on spectroscopy and host-galaxy properties. Contamination by core-collapse SNe, even of SNe Ic that sometimes closely resemble SNe Ia, is unlikely in the cluster sample (due to the early-type nature of the hosts) and also for the 4 field SNe Ia (which happen to have relatively high S/N spectra). We identify the only non-SN Ia event, SN 1999ay, as a possible SN IIb (Filippenko 1988; Filippenko, Matheson, & Ho 1993) at –0.05 based on two spectra (Gal-Yam & Maoz 2000c, and this work). Its photometric behavior (Appendix A), and a redshift of 0.044 recently measured by the Sloan Digital Sky Survey (SDSS; Adelman-McCarthy et al. 2005), appear to support our identification.
For two of the cluster SNe we detected no visible hosts in WOOTS data and in deep Keck images; these turned out to be the first demonstrable cases of intergalactic SNe, which are discussed in detail by Gal-Yam et al. (2003a). We found no background SNe for which there was evidence of lensing by the clusters.
WOOTS is the only survey we are aware of that produced a sample of SN candidates which were all spectroscopically confirmed (or ruled out). Based on our statistics of non-cluster SNe, in a flux-limited SN survey with a limiting magnitude comparable to that of WOOTS (i.e., mag in the band), 4/5 of SNe discovered would be SNe Ia. This estimate is of course crude, as it is based on so few events. However, it is supported by results from other similar surveys. In particular, we find that SNe Ia account for (21/30) of the SNe discovered by the Lick Observatory Supernova Search (LOSS) with the Katzman Automatic Imaging Telescope (Filippenko et al. 2001; Filippenko 2005a; Filippenko & Li 2008) in random galaxies projected around LOSS target galaxies. Since the vast majority of the nearby galaxies targeted by LOSS cover only a small fraction of the KAIT field of view, this program provides, in addition to the main SN survey in nearby galaxies, also a blank-field survey covering small patches of surrounding sky to a limiting magnitude of mag, which is almost spectroscopically complete (see Appendix B for more details). Results from the SN Factory project (Weaver et al. 2006) lead to very similar estimates (P. Nugent, 2007, private communication).
Comparing the above results with the reported fraction of SNe Ia from the total number of field events in the Mount Stromlo Abell Cluster SN Search (MSACSS; ; Table 1 of Germany et al. 2004) shows a puzzling discrepancy. A likely explanation is that SN classification in MSACSS, which relied heavily on light-curve fitting due to the low fraction of SNe with spectroscopic observations, was compromised. Perhaps a significant fraction of the events that Germany et al. (2004) classify as “nIa” (non-SNe Ia, based on light-curve shape) are in fact SNe Ia, which either have peculiar light curves, or poorer photometry than the authors realized, or are not SNe at all (e.g., these are AGNs).
The ratio of SNe Ia to core-collapse (non-Ia) events reflects the strong bias favoring the discovery of luminous SNe Ia, rather than the relative rates (per unit volume) of SNe. We also note that for a program with similar properties (depth and field size), a cluster survey increases the number of detected SNe by a factor of compared to blank-field imaging (similar to the results reported by Reiss et al. 1998 and Germany et al. 2004, see below).
Since the completion of WOOTS, data from the SDSS have become available for most of our SN fields. In Table 4 we summarize the properties of the host galaxies of eight WOOTS SNe as measured by the SDSS. We note that, with the exception of SN 1998cg, which resides in a large field spiral, most SNe (both cluster and field events) occurred in relatively low-luminosity (0.1- 0.15) galaxies. While field SNe occurred in blue ( mag) galaxies, cluster SNe typically occurred in red ( mag) galaxies, where we adopt mag, the minimum in the bimodal color distributions of Blanton et al. (2003a, their Fig. 7), as the division between red and blue galaxies. Curiously, however, cluster SN Ia 1998eu occurred in a faint blue galaxy at the redshift of the cluster Abell 125.
| SN host | RA & Dec | Photometry (mag) | Luminositya | Comments | |||||
|---|---|---|---|---|---|---|---|---|---|
| (J2000) | |||||||||
| 1998cg-host | 1.82 | 0.58 | 17.28 | 0.31 | 0.47 | 1.23 | Face-on spiral (field) | ||
| 1998eu-host | 0.81 | 0.34 | 21.06 | 0.14 | 0.25 | 0.10 | Faint blue galaxy (cluster) | ||
| 1998ax-host | 1.02 | 0.47 | 19.05 | 0.89 | 0.10 | 0.04 | Galaxy pair – NW (field) | ||
| 1998ax-host | 1.33 | 0.35 | 17.73 | 0.11 | 0.32 | 0.13 | Galaxy pair – SE (field) | ||
| 1998ay-host | 1.75 | 0.46 | 17.50 | 0.32 | 0.49 | 0.12 | Blue spiral (field) | ||
| 1999ch-host | 2.72 | 0.82 | 20.37 | 0.35 | 0.70 | 0.12 | Faint compact galaxy (cluster) | ||
| 1999ci-host | 2.56 | 0.80 | 19.62 | 0.41 | 0.74 | 0.16 | Faint early type (cluster) | ||
| 1999ct-host | 1.78 | 0.98 | 20.68 | 0.51 | 0.82 | 0.14 | Faint early type (cluster) | ||
Notes:
a Luminosities are calculated assuming mag for the SDSS band from Blanton et al. (2003b), and the standard flat WMAP cosmology ( km s-1 Mpc-1, ). Galactic extinction correction based on maps by Schlegel, Finkbeiner, & Davis (1998) has been applied.
3.2 Other Transients
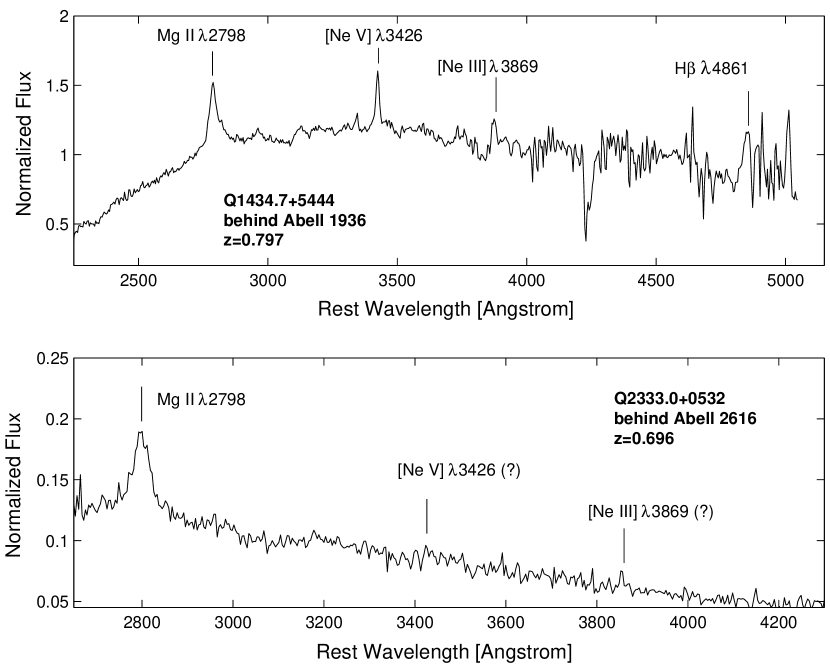
A number of variable sources that are not SNe (based on their variability properties) were also discovered in WOOTS data. Being lower-priority targets, many of these sources were not followed up. Some of them are Galactic variable stars of various kinds, while others have turned out to be AGNs behind the target clusters. Additional AGNs were spectroscopically culled from the SN sample (see above). Example AGNs are listed in Table 5 and example spectra are shown in Fig. 12. It is interesting to note that all the AGNs we discovered reside at relatively low redshifts (). However, our selection process (which rejected variable point sources prior to spectroscopy, but retained resolved or marginally resolved AGNs) is probably responsible for this effect, since high- (and thus more luminous) AGNs would dominate their host, and thus appear star-like. Lower-luminosity AGNs (analogs of local Seyfert galaxies), on the other hand, which we could detect only out to lower redshifts, would better mimic SNe (and gain spectroscopic follow-up observations) due to higher contamination by their resolved host-galaxy light.
One of the original goals of WOOTS was to discover nuclear variability in galaxies due to AGNs in the clusters or to tidal disruption of stars by central supermassive black holes in quiescent galaxies. Our ability to conduct such a search was compromised by imperfection in the image-subtraction methods we initially used, resulting in many spurious residuals in galaxy cores. None of the AGNs we discovered turned out to be cluster members.
| AGN | Redshift | RA & Dec | SDSS Photometry (mag) | Referencec | |||||
|---|---|---|---|---|---|---|---|---|---|
| (J2000) | |||||||||
| WOOTSJ143444+544427 | 0.797 | b | 20.18 | 19.95 | 19.77 | 19.66 | 19.51 | (1) | |
| WOOTSJ233304+053224 | 0.696 | (2) | |||||||
| WOOTSJ144409+585332 | 0.791 | b | 19.45 | 19.12 | 18.99 | 19.07 | 18.92 | (3) | |
| WOOTSJ002731+214247 | 1.064 | (4) | |||||||
| WOOTSJ002228+232356 | 0.650 | (4) | |||||||
| WOOTSJ131315+462001a | b | 20.21 | 20.00 | 19.94 | 19.89 | 19.76 | (5) | ||
Notes:
a No spectrum obtained of this source. However, its strong variability and blue SDSS colors suggest an AGN with .
b SDSS astrometry is reported for these sources rather than our original USNO-based locations, which are, however, always within of the SDSS coordinates.
c References: 1. IAUC 7356 (Gal-Yam, Maoz, & Guhathakurta 2000); 2. IAUC 7228 (Matheson, Modjaz, & Filippenko 1999); 3. IAUC 8171 (Gal-Yam et al. 2003c); 4. ATEL 586 (Gal-Yam 2005); 5. IAUC 7210 (Gal-Yam & Maoz 1999d).
3.3 Asteroids
The automated WOOTS analysis pipeline also detected asteroids in the data. Due to their proper motion, asteroids usually appear to be “smeared” in each sub-exposure, and show detectable motion between each of the three sub-exposures we normally obtained. Upon discovery of an asteroid by our program, amateur astronomer I. Manulis performed astrometry using the WOOTS images and reported these positions to the International Astronomical Union Minor Planet Center (MPC). When possible, the positions were used to calculate a preliminary motion vector, and follow-up observations were obtained in order to determine the orbit of each object. In other cases, the positions we measured were linked by the MPC to other observations and used to determine the orbits of these objects. Over 50 asteroids were reported, more than of them previously unknown (see Manulis 2002 for more details). Three objects have so far been numbered by the MPC. We have found that the relatively deep limiting magnitudes obtained by WOOTS (asteroids as faint as mag were measured) made our data unique in sampling a faint population of main-belt asteroids that was not accessible to other systematic surveys for Solar System objects active at the time. We did not discover any comets, slowly moving (Kuiper belt or Trans-Neptunian) objects, or very fast (near-Earth) bodies.
4 Comparison with Other Surveys
Numerous surveys for SNe and other variable and transient objects have been carried out over the last few years. In particular, the cosmological utility of SNe Ia has been a driver for many dedicated SN surveys, from nearby galaxies (e.g., LOSS, Filippenko et al. 2001; Filippenko 2005a; Filippenko & Li 2008) out to high redshifts (e.g., the SN legacy survey, Astier et al. 2006; ESSENCE, Wood-Vasey et al. 2007) and very high redshifts (e.g., GOODS, Riess et al. 2007; SDFSNS, Poznanski et al. 2007). Most of these programs do not target clusters of galaxies. Here, we briefly compare our survey with other cluster SN search programs.
The Mount Stromlo Abell Cluster SN Search (MSACSS; Reiss et al. 1998) was a survey of similar design to WOOTS, targeting lower-redshift clusters () using the MACHO Camera mounted on the Mount Stromlo telescope. Comparing MSACSS and our survey, we find that while MSACSS found more SNe (52, some of which are probably cluster members), WOOTS had complete spectroscopic follow-up observations (compared to for MSACSS). These additional observations allowed us to discover and characterize the population of intergalactic SNe, presented by Gal-Yam et al. (2003a). The fact that MSACSS targeted lower- clusters, as well as the availability of the wide-field, two-color MACHO camera, enabled MSACSS to acquire better follow-up photometry and measure the SN light curves (Germany et al. 2004). Both surveys acquired data suitable for the calculation of cluster SN rates (Paper II), though the rates from MSACSS remain unpublished.
Mannucci et al. (2007) recently reported a measurement of the SN rate in local () clusters, which was derived from the cluster-SN subsample within the large dataset of events found in five historical SN surveys targeting individual galaxies analyzed by Cappellaro et al. (1999). Sand et al. (2007) present preliminary results from a survey with very similar design and goals to those of WOOTS, conducted with the 90” telescopes at Steward Observatory.
Moving on to higher redshifts, we have been pursuing ground-based cluster SN surveys at using numerous telescopes (e.g., Gal-Yam et al. 2003c,d; 2005). Following a different approach, we have measured the cluster SN rate in high-redshift clusters using a handful of SNe discovered in archival Hubble Space Telescope (HST) data (Gal-Yam, Maoz, & Sharon 2002), and are in the process of conducting an HST survey of rich clusters in order to obtain a more accurate measurement (Sharon et al. 2005; 2006). Finally, the Supernova Cosmology Project group is leading a large HST program to search for SNe Ia in the most distant known galaxy clusters (Dawson et al. 2005). These HST efforts should ultimately allow the evolution of cluster SN rates to be traced to .
5 Conclusions
We have conducted a survey for SNe and other transients in the fields of rich Abell galaxy clusters at . Using unfiltered imaging with the Wise m telescope, we have achieved a sensitivity limit of mag for variable sources. An automated pipeline was written to reduce and analyze the data, using image subtraction to detect variability. A dozen SNe were discovered and spectroscopically confirmed. Seven SNe turned out to have occurred in cluster galaxies, while five are field events. Eleven of the SNe (including all cluster events) are apparently SNe Ia, typically discovered near maximum light. From the statistics of non-cluster SNe, and relying on the fact that the WOOTS SN sample is complete (i.e., all SN candidates have been either confirmed or ruled out), we can estimate that flux-limited SN surveys with similar limiting magnitudes will be dominated () by SNe Ia.
Our follow-up spectroscopy shows that AGNs may mimic SNe, and that reliably rejecting all AGNs without spectroscopy is difficult. Two of our cluster SNe had no visible hosts in the WOOTS images, nor in deep Keck images, and were subsequently shown to be the first good candidates for intergalactic SNe, whose progenitor stars are not associated with galaxies (Gal-Yam et al. 2003a). The cluster SN sample is suitable for the calculation of the SN rate in clusters in this redshift range, as reported in Paper II. The survey also detected several quasars behind the cluster sample, as well as numerous asteroids and variable stars.
Acknowledgments
This project would not have come to final fruition without the diligence and perseverance of K. Sharon. We are grateful to D. Reiss, E. O. Ofek, and D. Poznanski for help and advice. F. Patat, M. Turatto, D. C. Leonard, A. G. Riess, P. Leisy, O. Hainaut, T. Sekiguchi, G. Aldering, P. Nugent, C. Sorensen, B. Schaefer, A. J. Barth, and R. Pogge provided follow-up data and observations. Special thanks go to R. Stathakis for supporting observations at the AAO, and to the ESO Director for Director’s Discretionary observations of several WOOTS SNe. We acknowledge A. Howell for supplying a copy of the Superfit code. We also thank S. Ben Gigi, J. Dann, and Y. Lipkin for helping with observations at Wise, and the entire Wise Observatory staff at Mizpe Ramon and at the Tel Aviv headquarters, without whose assistance this work would not have been possible. Our colleagues in the Astrophysics Department at Tel Aviv University observed WOOTS sources during their observing runs at the Wise 1 m telescope. We are grateful to the staff at the W. M. Keck Observatory for their assistance. The Keck Observatory is operated as a scientific partnership among the California Institute of Technology, the University of California, and the National Aeronautics and Space Administration (NASA); the Observatory was made possible by the generous financial support of the W. M. Keck Foundation. This research has made use of the NASA/IPAC Extragalactic Database (NED), which is operated by the Jet Propulsion Laboratory, California Institute of Technology, under contract with the National Aeronautics and Space Administration. A.G. acknowledges support by NASA through Hubble Fellowship grant #HST-HF-01158.01-A awarded by the Space Telescope Science Institute (STScI), which is operated by AURA, Inc., for NASA, under contract NAS 5-26555. This work was supported by a grant from the Israel Science Foundation (D.M.). The work of A.V.F.’s group at UC Berkeley is supported by National Science Foundation (NSF) grant AST-0607485, as well as by NASA grant GO–10493 from STScI. P.G. acknowledges support from NSF grants AST-0307966 and AST-0607852.
References
- Abell et al. (1989) Abell, G. O., Corwin, H. G., Jr., & Olowin, R. P. 1989, ApJS, 70, 1
- Adelman-McCarthy et al. (2006) Adelman-McCarthy, J. K., et al. 2006, ApJS, 162, 38
- Alard (2000) Alard, C. 2000, A&AS, 144, 363
- Alard & Lupton (1998) Alard, C., & Lupton, R. H. 1998, ApJ, 503, 325
- Astier et al. (2006) Astier, P., et al. 2006, A&A, 447, 31
- Blanton et al. (2003) Blanton, M. R., et al. 2003a, ApJ, 594, 186
- Blanton et al. (2003) Blanton, M. R., et al. 2003b, ApJ, 592, 819
- Dawson et al. (2005) Dawson, K. S., et al. 2005, Bulletin of the American Astronomical Society, 37, 1459
- Filippenko et al. (1999) Filippenko, A. V., Leonard, D. C., & Riess, A. G. 1999a, IAU Circ., 7091
- Filippenko et al. (1999) Filippenko, A. V., Leonard, D. C., & Riess, A. G. 1999b, IAU Circ., 7092
- Filippenko (1982) Filippenko, A. V., 1982, PASP, 94, 715
- Filippenko (1988) Filippenko, A. V., 1988, AJ, 96, 1941
- Filippenko (1997) Filippenko, A. V., 1997, ARAA, 35, 309
- Filippenko (2005a) Filippenko, A. V., 2005a, in The Fate of the Most Massive Stars, ed. R. Humphreys & K. Stanek (San Francisco: ASP), 33
- Filippenko (2005b) Filippenko, A. V., 2005b, in White Dwarfs as Cosmological and Galactic Probes, ed. E. M. Sion, S. Vennes, & H. L. Shipman (Dordrecht: Springer), 97
- Filippenko & Li (2008) Filippenko, A. V., & Li, W. 2008, in prep.
- Filippenko, Matheson, & Ho (1993) Filippenko, A. V., Matheson, T., & Ho, L. C. 1993, ApJ, 415, L103
- Filippenko et al. (1992a) Filippenko, A. V., et al. 1992a, ApJ, 394, L15
- Filippenko et al. (1992b) Filippenko, A. V., et al. 1992b, AJ, 104, 1543
- Filippenko et al. (2001) Filippenko, A. V., Barth, A. J., & Leonard, D. C. 2001, IAU Circ., 7607
- Filippenko et al. (2001) Filippenko, A. V., Li, W. D., Treffers, R. R., & Modjaz, M. 2001, in Small Telescope Astronomy on Global Scales, ed. W. P. Chen, C. Lemme, and B. Paczyński (San Francisco, ASP Conf. Ser. 246), 121
- Gal-Yam (2003) Gal-Yam, A., 2003, Ph.D. Thesis, Tel Aviv University
- Gal-Yam (2005) Gal-Yam, A. 2005, The Astronomer’s Telegram, 586
- Gal-Yam et al. (2006b) Gal-Yam, A., Cenko, S. B., Fox, D. B., Leonard, D. C., Moon, D.-S., Sand, D. J., & Soderberg, A. M. 2006b, ArXiv Astrophysics e-prints, arXiv:astro-ph/0611919
- Gal-Yam & Maoz (1998a) Gal-Yam, A., & Maoz, D. 1998a, IAU Circ., 6917
- Gal-Yam & Maoz (1998b) Gal-Yam, A., & Maoz, D. 1998b, IAU Circ., 7055
- Gal-Yam & Maoz (1999a) Gal-Yam, A., & Maoz, D. 1999a, IAU Circ., 7082
- Gal-Yam & Maoz (1999b) Gal-Yam, A., & Maoz, D. 1999b, IAU Circ., 7088
- Gal-Yam & Maoz (1999c) Gal-Yam, A., & Maoz, D., 1999c, IAU Circ., 7181
- Gal-Yam & Maoz (1999d) Gal-Yam, A., & Maoz, D., 1999d, IAU Circ., 7210
- Gal-Yam & Maoz (1999e) Gal-Yam, A., & Maoz, D. 1999e, IAU Circ., 7093
- Gal-Yam & Maoz (2000a) Gal-Yam, A., & Maoz, D. 2000a, in Large Scale Structure in the X-ray Universe, ed. M. Plionis & I. Georgantopoulos (Atlantisciences, Paris, France), 359
- Gal-Yam & Maoz (2000b) Gal-Yam, A., & Maoz, D. 2000b, American Institute of Physics Conference Series, 522, 107
- Gal-Yam & Maoz (2000c) Gal-Yam, A. & Maoz, D., 2000c, IAU Circ., 7357
- Gal-Yam & Maoz (2001) Gal-Yam, A., & Maoz, D. 2001, IAU Circ., 7607
- Gal-Yam, Maoz, & Guhathakurta (1999) Gal-Yam, A., Maoz, D., & Guhathakurta, P. 1999, IAU Circ., 7198
- Gal-Yam, Maoz, & Guhathakurta (2000) Gal-Yam, A., Maoz, D., & Guhathakurta, P. 2000, IAU Circ., 7356
- Gal-Yam et al. (2003a) Gal-Yam, A., Maoz, D., Guhathakurta, P., & Filippenko, A. V. 2003a, AJ, 125, 1087
- Gal-Yam, Maoz, & Pogge (1999) Gal-Yam, A., Maoz, D., & Pogge, R. 1999, IAU Circ., 7199
- Gal-Yam et al. (1999) Gal-Yam, A., et al. 1999, IAU Circ., 7130
- Gal-Yam, Maoz, & Sharon (2002) Gal-Yam, A., Maoz, D., & Sharon, K. 2002, MNRAS, 332, 37
- Gal-Yam et al. (2002) Gal-Yam, A., Ofek, E. O., Filippenko, A. V., Chornock, R., & Li, W. 2002, PASP, 114, 587
- Gal-Yam et al. (2003b) Gal-Yam, A., Maoz, D., Prada, F., Guhathakurta, P., Filippenko, A. V., Chornock, R., & Smith, G. 2003b, IAU Circ., 8169
- Gal-Yam et al. (2003c) Gal-Yam, A., Maoz, D., Chornock, R., & Filippenko, A. V. 2003c, IAU Circ., 8171
- Gal-Yam et al. (2003d) Gal-Yam, A., et al. 2003d, IAU Circ., 8212
- Gal-Yam et al. (2004) Gal-Yam, A., et al. 2004, ApJ, 609, L59
- Gal-Yam et al. (2005) Gal-Yam, A., Maoz, D., Sharon, K., Prada, F., Guhathakurta, P., & Filippenko, A. V. 2005, in Cosmic Explosions, ed. J. M. Marcaide & K. W. Weiler (Berlin: Springer-Verlag), 367
- Gal-Yam et al. (2006a) Gal-Yam, A., et al. 2006a, Nature, 444, 1053
- Gal-Yam et al. (2007) Gal-Yam, A., et al. 2007, ApJ, 656, 372
- Germany et al. (2004) Germany, L. M., Reiss, D. J., Schmidt, B. P., Stubbs, C. W., & Suntzeff, N. B. 2004, A&A, 415, 863
- Giveon (2000) Giveon, U. 2000, M.Sc. Thesis, Tel Aviv University
- Hawkins & Veron (1993) Hawkins, M. R. S., & Veron, P. 1993, MNRAS, 260, 202
- Howell et al. (2005) Howell, D. A., et al. 2005, ApJ, 634, 1190
- Hubble & Humason (1931) Hubble, E., & Humason, M. L. 1931, ApJ, 74, 43
- Knop et al. (2003) Knop, R. A., et al. 2003, ApJ, 598, 102
- Kowalski et al. (2004) Kowalski, M., et al. 2004, Bulletin of the American Astronomical Society, 36, 1466
- Leir & van den Bergh (1977) Leir, A. A., & van den Bergh, S. 1977, ApJS, 34, 381
- Lucey (1983) Lucey, J. R. 1983, MNRAS, 204, 33
- Mannucci (2007) Mannucci, F., et al. 2007, MNRAS, Submitted
- Manulis (2002) Manulis, I. 2002, ESA SP-500h Asteroids, Comets, and Meteors: ACM 2002, 805
- Matheson et al. (1999) Matheson, T., Modjaz, M., & Filippenko, A. V. 1999, IAU Circ., 7228
- Modjaz (2007) Modjaz, M. 2007, Ph.D. Thesis, Harvard University
- Monet (1998) Monet, D. G., et al. 1998, USNO-A2.0 (Washington: US Nav. Obs.)
- Norgaard-Nielsen et al. (1989) Norgaard-Nielsen, H. U., Hansen, L., Jorgensen, H. E., Aragon Salamanca, A., & Ellis, R. S. 1989, Nature, 339, 523
- Ofek (2000) Ofek, E. O. 2000, M.Sc. Thesis, Tel Aviv University
- Oke et al. (1995) Oke, J. B., et al. 1995, PASP, 107, 375
- Patat & Turatto (1998) Patat, F., & Turatto, M. 1998, IAU Circ., 6925
- Perlmutter et al. (1990) Perlmutter, S., Goldhaber, G., Marvin, H. J., Muller, R. A., Pennypacker, C. R., Couch, W. J., & Boyle, B. J. 1990, Bulletin of the American Astronomical Society, 22, 1332
- Perlmutter et al. (1995) Perlmutter, S., et al. 1995, ApJ, 440, L41
- Perlmutter et al. (1997) Perlmutter, S., et al. 1997, ApJ, 483, 565
- Perlmutter et al. (1999) Perlmutter, S., et al. 1999, ApJ, 517, 565
- Poznanski et al. (2002) Poznanski, D., Gal-Yam, A., Maoz, D., Filippenko, A. V., Leonard, D. C., & Matheson, T. 2002, PASP, 114, 833
- Poznanski et al. (2007) Poznanski, D., et al. 2007, ArXiv e-prints, 707, arXiv:0707.0393
- Reiss et al. (1998) Reiss, D. J., Germany, L. M., Schmidt, B. P., & Stubbs, C. W. 1998, AJ, 115, 26
- Regnault et al. (2001) Regnault, N., et al. 2001, Bulletin of the American Astronomical Society, 33, 1427
- Richardson et al. (2006) Richardson, D., Branch, D., & Baron, E. 2006, AJ, 131, 2233
- Richmond et al. (1994) Richmond, M. W., Treffers, R. R., Filippenko, A. V., Paik, Y., Leibundgut, B., Schulman, E., & Cox, C. V. 1994, AJ, 107, 1022
- Riess et al. (1998) Riess, A. G., et al. 1998, AJ, 116, 1009
- Riess et al. (2004) Riess, A. G., et al. 2004, ApJ, 607, 665
- Riess et al. (2007) Riess, A. G., et al. 2007, ApJ, 659, 98
- Sand et al. (2007) Sand, D. J., Zaritsky, D., Herbert-Fort, S., Sivanandam, S., & Clowe, D. 2007, ArXiv e-prints, 709, arXiv:0709.2519
- Sarajedini et al. (2006) Sarajedini, V. L., et al. 2006, ApJS, 166, 69
- Schlegel et al. (1998) Schlegel, D. J., Finkbeiner, D. P., & Davis, M. 1998, ApJ, 500, 525
- Schmidt et al. (1998) Schmidt, B. P., et al. 1998, ApJ, 507, 46
- Sharon et al. (2006) Sharon, K., Gal-Yam, A., & Maoz, D. 2006, The Astronomer’s Telegram, 723
- Sharon et al. (2007) Sharon, K., Gal-Yam, A., Maoz, D., Filippenko, A. V., & Guhathakurta, P. 2007, ApJ, 660, 1165
- Sharon et al. (2006) Sharon, K., et al. 2006, ArXiv Astrophysics e-prints, arXiv:astro-ph/0611920
- Strolger et al. (2002) Strolger, L.-G., et al. 2002, AJ, 124, 2905
- Struble & Rood (1991) Struble, M. F., & Rood, H. J. 1991, ApJS, 77, 363
- Tonry et al. (2003) Tonry, J. L., et al. 2003, ApJ, 594, 1
- van Paradijs et al. (1997) van Paradijs, J., et al. 1997, Nature, 386, 686
- Weaver et al. (2006) Weaver, B. A., et al. 2006, American Astronomical Society Meeting Abstracts, 209, #150.16
- Wood-Vasey et al. (2007) Wood-Vasey, W. M., et al. 2007, ApJ, 666, 694
- Zwicky et al. (1960) Zwicky, F., Humason, M. L., & Gates, H. S. 1960, AJ, 65, 504
Appendix A: The CPM Image-Subtraction Algorithm
Proper image subtraction requires matching the point-spread functions (PSFs) of two images. The PSF varies significantly between images due to variable atmospheric, dome, and telescope seeing, as well as tracking errors and atmospheric dispersion (Filippenko 1982) when observing far from the zenith. One can describe the combination of these effects as a convolution of the undistorted source image with a distorting kernel whose shape varies from image to image. If we denote images obtained at various epochs by , then for each epoch ,
| (1) |
where denotes a convolution. In Fourier space, we can use the convolution theorem and replace convolutions with products. If we denote the Fourier transform of by , we can define the kernel
| (2) |
which, when applied to image , will match its PSF to that of image in the following manner:
| (3) |
Note that to calculate we can replace the ratio of the spatial transforms of the images whose calculation is computationally prohibitive for large images, by the ratio of the PSFs , with each PSF measured from small subsections of the images centered on one or more isolated, bright stars. This Fourier division method enables one to degrade the PSF of the better image to that of the one of poorer quality (broader PSF). ISIS finds an optimal convolution kernel directly in real space assuming the kernel to be composed of a set of basis kernels, with the coeeficients comupted through least-square analysis (see Lupton & Alard 1998 and Alard 2000 for further details).
Our algorithm is based on a simple approach. For each image we determine the PSF by inspecting several bright, isolated stars. While the algorithms described above (psfmatch and ISIS) try to find the optimal kernel which will degrade the PSF of the better image to match that of the poorer image, our algorithm convolves each image with the PSF of the second image, in analogy to the arithmetic “common denominator.” Since the following simple equation holds,
| (4) |
we get, in principle, two perfectly matched images. The drawback of the method is that, as both images are degraded, the final PSF is even broader than the PSF of the worse image. This is equivalent to a seeing degradation of up to in the PSF width, if both PSFs are of similar breadth.
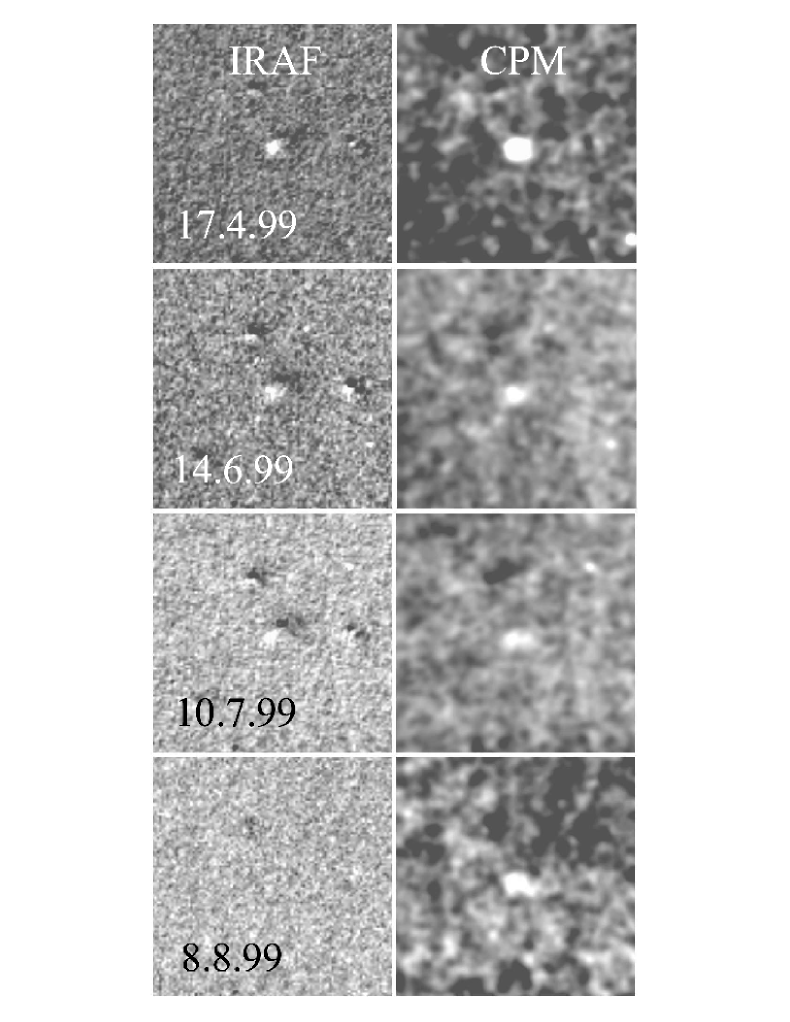
In principle, this loss limits the detection of faint variable sources, since the signal is smeared over more pixels. However, we find that CPM significantly reduces subtraction residuals originating from the Fourier division performed by psfmatch. For the WOOTS survey, the reduction in subtraction residuals more than compensates for the seeing degradation. An example is shown in Figure 13. We have also compared the performance of CPM with ISIS. Here the results are less conclusive, but usually we find that CPM works better. In addition, the fact that the user is in full control of the operation of the software (e.g., the selection of PSF stars) makes CPM more tractable.
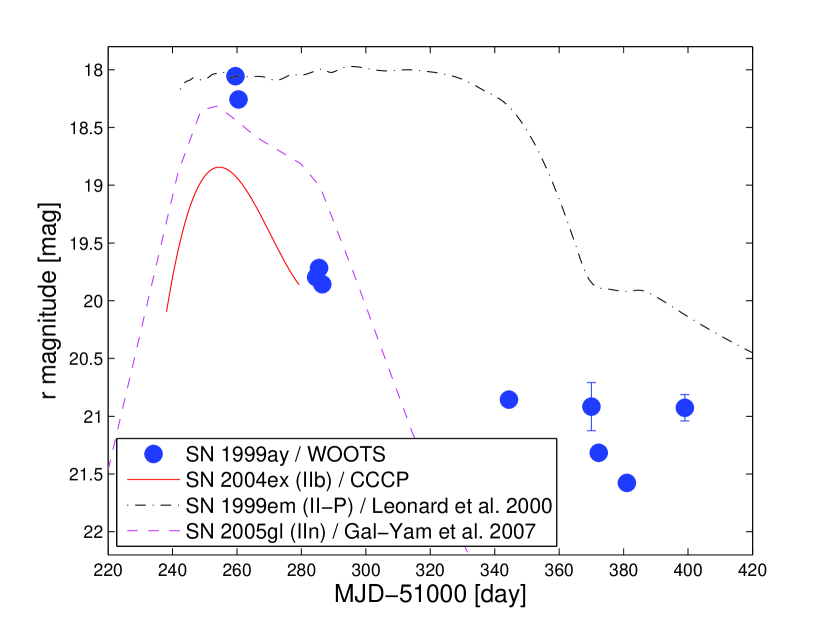
This method has, since its development, been applied in cases where accurate host-galaxy subtraction proved critical (see, e.g., Gal-Yam et al. 2004; 2006a). In the context of the present work, it allows us to measure the light curve of SN 1999ay (Fig. 14).
The similar shape of the light curve to that of other SNe IIb (such as SN 2004ex, Fig. 14) supports its spectroscopic identification. Having discovered this event probably a few days after peak magnitude, our observations imply a lower limit on the absolute peak magnitude of mag. We do not correct for host-galaxy extinction, which the spectroscopy indicates is significantly below that of SN 1993J, for which Richmond et al. (1994) estimate mag. Galactic extinction in this direction is negligible, and we have assumed the SDSS redshift for the host. The implied absolute magnitude is in the upper range of the distribution for SNe IIb (Richardson et al. 2006; Modjaz et al. 2007).
Appendix B: SNe in Random Galaxies from LOSS
In order to investigate the fraction of SNe Ia observed in a non-targeted, relatively shallow SN survey, we have examined all the SNe discovered by the LOSS/KAIT program (Filippenko et al. 2001; Filippenko & Li 2008; see also http://astro.berkeley.edu/bait/kait.html) during the years 1999–2006. We have found 32 events (listed in Table 6 below) that occurred in random galaxies projected near LOSS target galaxies. Of these, 30/32 were spectroscopically classified (Table 6), making this among the largest and best-studied sets of SNe discovered by a non-targeted (“blind”) SN survey (with a typical limiting magnitude of mag), obtained as a byproduct of the main (targeted) LOSS program. Of the 30 events with spectroscopic types, 21 () are of Type Ia, consistent with our WOOTS result () based on a smaller number of events from a somewhat deeper survey.
| Supernova | Type | Supernova | Type |
|---|---|---|---|
| SN 1999ce | Ia | SN 1999co | II |
| SN 2000Q | Ia | SN 2000dd | Ia |
| SN 2001bp | Ia | SN 2001ei | Ia |
| SN 2001es | ? | SN 2002cc | Ia |
| SN 2002ct | ? | SN 2002eu | Ia |
| SN 2002ey | Ia | SN 2002hi | IIn |
| SN 2003ah | Ia | SN 2003ev | Ic |
| SN 2003go | IIn | SN 2003hw | Ia |
| SN 2003im | Ia | SN 2004U | II |
| SN 2004V | II | SN 2004X | II |
| SN 2004Y | Ia | SN 2004dz | Ia |
| SN 2005X | Ia | SN 2005ac | Ia |
| SN 2005ag | Ia | SN 2005eu | Ia |
| SN 2005kf | Ic | SN 2006bw | Ia |
| SN 2006dw | Ia | SN 2006is | Ia |
| SN 2006iu | II | SN 2006lu | Ia |