Results from multi-frequency observations of PSR B082634
Abstract
We report new results obtained from multi-frequency observations of PSR B082634 with the Giant Metrewave Radio Telescope (GMRT). (1) We find no evidence of weak emission during the typical long null state of this pulsar, simultaneously at 303 and 610 MHz, as well as individually at 157, 325, 610 and 1060 MHz at separate epochs. Our limit of non-detection is at 1% or better of the peak of the active state profile, and corresponds to 2 mJy at 610 MHz. (2) Significant correlation in the total intensity of the individual pulses between 303 and 610 MHz is reported from the simultaneous dual frequency observations, which is indicative of the broadband nature of the emission. We also report correlation between total energy in the main pulse and inter-pulse region from the high sensitivity single frequency observations at 610 and 1060 MHz. (3) Though we find the drift pattern to be very similar in the simultaneous 303 and 610 MHz data, we observe that the drift band separation () evolves significantly between these two frequencies, and in a manner opposite to the average profile evolution. In addition, we confirm the dependence of on pulse longitude at 303 MHz and find indications for the same at 610 MHz. We also present results for subpulse width () at different frequencies, and as well as a function of pulse longitude. (4) As a natural out-come of the simultaneous dual frequency observations, we obtain an accurate DM value, equal to 52.2(6) , for this pulsar.
keywords:
Stars: neutron – stars: pulsars: general – stars: pulsar: individual: B0826341 Introduction
The phenomenon of subpulse drifting (first reported by Drake and Craft (1968)), is manifested as an organised subpulse behaviour subpulses appear at progressively changing longitude in the pulse window following some particular path. The path followed by the subpulses is specific to the individual pulsar concerned and is known as drift band. It has been recently shown that subpulse drifting may be fairly common among pulsars (Weltevrede et al., 2006, 2007). Wide profile pulsars showing this phenomenon can be especially useful tools to understand the distribution of the radio emission regions above the neutron star’s polar cap and the physics of the pulsar emission mechanism. Since the wide profiles are usually interpreted as emission from one magnetic pole of a highly aligned pulsar (i.e. magnetic axis almost parallel to rotation axis), our line of sight samples a large part of the polar cap. This leads to enhanced possibility of seeing multiple drift bands in such pulsars, which can provide valuable insights into the pulsar magnetospheres, as exemplified by some of the new and substantive results for PSR B082634 (Gupta et al., 2004; Esamdin et al., 2005), PSR B081509 (Qiao et al., 2004) and PSR B081841 (Bhattacharyya et al., 2007).
PSR B082634 is a pulsar with one of the widest known pulse profiles. The earlier studies of this pulsar (Durdin et al., 1979; Biggs et al., 1985; Gupta et al., 2004) have brought out some unique properties strong evolution of the average profile with frequency, apparent nulling for 70% of time and a remarkable subpulse drift property multiple, curved drift bands with frequent changes and sign reversals of drift rate.
Multi-frequency observations, especially when done simultaneously at the different frequencies, are very useful for the study of various aspects of the frequency dependence of pulsar radiation (Taylor, Manchester and Huguenin, 1975; Bartel and Sieber, 1978; Bartel, 1981; Bhat et al., 1999). Dispersion measure (DM) of pulsars can also be measured from single epoch simultaneous dual frequency observations (Ahuja et al., 2005). Simultaneous, multi-frequency observations of PSR B082634 can be useful on a variety of counts: (i) Determination of accurate DM, as the values reported and used in the literature span a fairly wide range, from 47 to 65 . (ii) Study of the pulsar in the null state: Esamdin et al. (2005) claim the presence of weak emission, at 1374 MHz, during the long duration nulls of this pulsar. They identify these null states as some weak mode of emission where the pulse intensity is 2% of that of the regular, strong mode, with a pulse profile that is similar to the strong mode at lower frequencies. Sensitive, multi-frequency observations at the lower frequencies should provide useful information about the behaviour in the null state. (iii) Study of simultaneous subpulses: Correlated behaviour of subpulses at different frequencies (Taylor, Manchester and Huguenin, 1975; Bartel and Sieber, 1978; Bartel, 1981; Karastergiou et al., 2003; Kramer et al., 2003) is useful to probe the broadband nature of the emission mechanism. For pulsars with drifting subpulses, evolution of (longitude separation between adjacent drift bands) with frequency can also be significant (Izvekova et al., 1991; Rankin et al., 2005; Smits et al., 2007) and a comparison of this with the frequency evolution of other profile parameters can be useful. Earlier study of drift properties of PSR B082634 (Biggs et al., 1985; Gupta et al., 2004; Esamdin et al., 2005) report different values at various individual frequencies which do not follow the trend predicted by profile evolution with frequency. In addition, for PSR B082634, the intricate nature of the multiple drift bands itself deserves a broadband study.
We observed PSR B082634 using the GMRT, simultaneously at 303 and 610 MHz, and individually at 157, 325, 610 and 1060 MHz in total intensity mode. In this paper we concentrate on the results from the simultaneous dual frequency observations, and supplement these, where necessary, with the results from the single frequencies observations. In Sect.2 we cover the observations, where a new technique for simultaneous dual frequency pulsar observations with the GMRT is presented. Different sub-sections of Sect.3 describe the data analysis and results for (1) determination of DM value from simultaneous dual frequency observations, (2) study of the pulsar in its null state and (3) subpulse studies. In Sect.4 we discuss the implications of our findings.
2 Observations
2.1 Simultaneous dual frequency observations
The GMRT consists of an array of 30 antennas, each of 45 m diameter, spread over a region of 25 km diameter, operating at 6 different wave bands between 150 and 1450 MHz (Swarup et al., 1997). Though designed to function primarily as a aperture synthesis telescope, the GMRT can be used in an array mode by adding the signals from individual dishes, either coherently or incoherently. Furthermore, sub-sets of the 30 antennas can be configured completely independently in what is referred to as the sub-array mode, to effectively provide more than one “single dish”, thereby enabling pulsars to be observed simultaneously at multiple frequencies. The signals from different antennas and observing frequency bands are eventually converted to a baseband signal of 16 MHz band width, which is then sampled at Nyquist rate. The observing bandwidth of 16 MHz is divided into 256 spectral channels in the FX correlator. These dual polarisation signals from all the antennas are then brought to the GMRT Array Combiner (GAC), where they are added coherently to get the phased array outputs for each polarisation (Gupta et al., 2000). The GAC has the facility of assigning different values of gains to each spectral channel of each polarisation of each antenna, in a completely independent manner, before the addition.
In the simultaneous multi-frequency sub-array mode of pulsar observations, the baseband signals from antennas in different sub-arrays (operating at different radio frequencies) can be added together in the same GAC, and the data can be recorded as a single stream of multi-channel data, after integration by the desired amount. The dedispersed data streams for the different frequencies are then extracted from this single data stream during off-line processing. Such a technique was employed by Ahuja et al. (2005), who carried out simultaneous dual frequency observations using the incoherent array mode of operation of the GMRT. They utilised the fact that, while traversing the interstellar medium, different frequency signals suffer different amount of dispersion delay and as a result the pulses arrive at different times (and hence at different positions in pulsar rotational phase) at different frequencies. Hence the on-pulse data from different frequencies can be recovered from appropriate phase windows in the pulse period, during the off-line analysis. This scheme provides naturally synchronised data from all the sub-arrays, without the need for separate, synchronised receivers for each sub-array. However, as Ahuja et al. (2005) have pointed out, this technique works well only for cases where the dispersion curves for different radio frequencies, when mapped to the 16 MHz baseband, do not overlap with each other for all phases of the on-pulse signal. This criterion becomes difficult to meet for pulsars with large duty cycle pulses and for large DMs. Specifically, in the case of wide profile pulsars like PSR B082634, this scheme will definitely fail due to the fact that the pulses at both frequencies will overlap in the band and it will be impossible to extract the stream of single pulse separately at different frequencies. For such pulsars, we have devised a new scheme to carry out simultaneous multi-frequency observations.
As mentioned earlier, the GAC has the facility of assigning to each spectral channel, a different value of gain including zero gain. This allows selectable parts of the band to be processed, while blocking the rest of the band, for each antenna. The setting can be done independently for each antenna. This “band masking” technique allows simultaneous multi-frequency observations of all types of pulsars, independent of the combination of values of period, pulse width and DM, without having the need for separate, synchronised pulsar receiver chain for each sub array. The trick is to split the available baseband bandwidth into non-overlapping sub-bands, each of these parts being assigned to the antennas of one particular sub array, using appropriate band mask settings for each antenna. For the antennas of a given sub array, we apply nominal gain value for the typical GMRT pulsar observations in the chosen part of the band and the rest of the band is masked by applying a zero gain value. During simultaneous dual frequency observations, the available band is divided into two parts, each part being alloted to one of the observing frequencies.
Using this technique, we observed PSR B082634 simultaneously at 303 and 610 MHz with the GMRT, on October 26, 2003. We used two sub arrays, one with 5 antennas (sub array#1), operating at 303 MHz, and the other with 10 antennas (sub array#2), operating at 610 MHz. We put more antennas at 610 MHz to get desired sensitivity, because of the fact that the pulsar is weaker at 610 than at 303 MHz. The signals coming from the antennas of each sub array were added coherently in the GAC. The total bandwidth used for the observations was 16 MHz, which was divided equally between the two frequency bands by masking 816 MHz of the band for the antennas in sub array#1 and 08 MHz of the band for the antennas in sub array#2. Before observing the pulsar, both the sub-arrays were individually “phased-up” by estimating the phases with respect to a reference antenna in each sub-array (from the correlator visibilities recorded on a point source calibrator) and applying the corrections for these back into the correlator hardware. The voltage outputs from the GAC were passed to the phased array pulsar receiver where the data were converted to intensity values and intensities from the two polarisations added to obtain the total intensity for each of 256 spectral channels, containing information from the two sub-arrays. These data were further integrated in time and finally recorded to disk at a sampling rate of 1.024 ms. During the off-line analysis we further integrated these data to a final time resolution of 4.096 ms, as this was adequate to study this wide profile pulsar. The duration of the pulsar observation was about 1 hr, in which we recorded a data stretch of 2123 pulses from PSR B082634, simultaneously at 303 and 610 MHz. In the first 750 of these pulses, the pulsar was in the active state and for the remaining time it was in one of its long duration null states.
2.2 Single frequency observations
We observed PSR B082634 using a large number of GMRT antennas in phased array mode at 157, 325, 610 and 1060 MHz individually at separate epochs. These observations have significantly higher sensitivity (by a factor of 2 or more) compared to the corresponding observations from the dual frequency effort, and were carried out primarily to supplement and improve the conclusions obtained from the simultaneous dual frequency data set. In addition, some of these observations were accompanied with flux calibration observations using known point sources, which allows for absolute calibration of the pulsar’s flux. A summary of the main parameters of each observing session is given in Table. 1.
| Frequency | State | No of pulses | No of | rms∙ | Flux of peak | Non-detection | Mean Flux | |||
| (MHz) | (Active/Null) | analysed | antennas | limit⋄ | ||||||
| used | (mJy) | (mJy) | (mJy) | (mJy) | ||||||
| MP | OP | FP | MP⊙ | IP⊙ | ||||||
| 303† | Active | 750 | 5 | 371 | 28 | 1687∗ | - | 443∗ | 754 ∗ | 99∗ |
| Null | 750 | 5 | 28 | 28 | - | 31∗ | ||||
| 610† | Active | 750 | 10 | 57 | 5 | 250∗ | - | 119∗ | 178∗ | 123∗ |
| Null | 750 | 10 | 4 | 4 | - | 5∗ | ||||
| 157‡ | Active | 970 | 16 | 427 | 13 | 1780∗ | - | 370∗ | 656∗ | 42∗ |
| Null | 970 | 16 | 13 | 13 | - | 23∗ | ||||
| 325§ | Active | 940 | 21 | 304 | 5 | 1330∗ | - | 393∗ | 763∗ | 62∗ |
| Null | 487 | 17 | 5 | 5 | - | 7∗∘ | ||||
| 610‡ | Active | 705 | 17 | 85 | 2 | 410∗∘ | - | 156∗∘ | 248∗∘ | 166∗∘ |
| Null | 705 | 17 | 2 | 2 | - | 2∗∘ | ||||
| 1060‡ | Active | 2900 | 21 | 120 | 10 | 1310∗ | - | 479∗ | 485∗ | 989∗ |
| Null | 2900 | 21 | 10 | 10 | - | 15∗ | ||||
: Active and null state data recorded from same simultaneous dual frequency observing session
: Active and null state data recorded from same single frequency observing session
: Active and null data recorded from single frequency observations from different days
: Value quoted for profile data with time resolution of 4.096 ms
: 3-sigma Non-detection limit for the null state, for profile data with time resolution of 20.048 ms
: Flux estimated using standard GMRT system parameters using relative calibration procedure
: Flux estimated using absolute calibration with a flux calibrator source
: Mean flux is calculated up to 50% intensity lavel for MP and IP

3 Data Analysis and Results
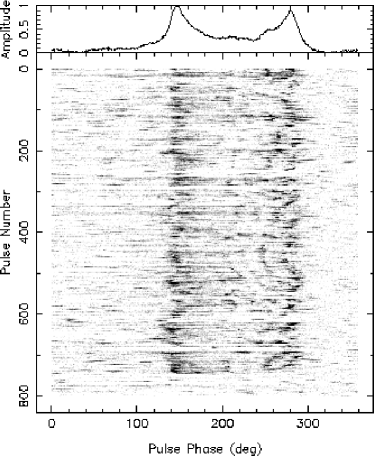
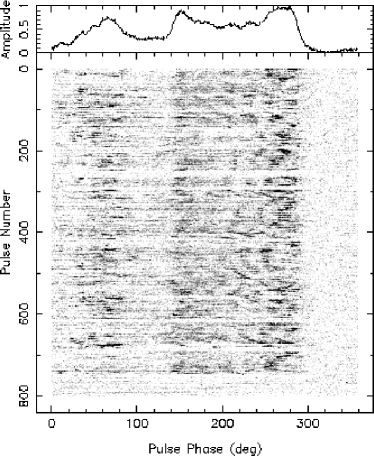
The simultaneous dual frequency data for PSR B082634 were dedispersed separately for 303 and 610 MHz, using only the respective non-masked parts of the baseband signal. The DM value used was 52.0, which is close to the final DM value determined by us (see Sect.3.1). The worst kind of radio frequency interference that this data is suffering from, is power line related (50 Hz and its harmonics). To remove that, the dedispersed data were put through a radio frequency interference filtering routine which detected most (but probably not all) of the power line interferences and replaced them by appropriate random noise. The resulting time series of first 750 pulses (for which the pulsar was in active state) were then synchronously folded with the topocentric pulsar period to generate the average pulse profiles at the two radio frequency bands, which are shown in the top two panels of Fig.1. At both frequencies, the emission from the pulsar is present over a wide longitude range, as expected. We identify two emission regions of the pulse profiles, labeled as main pulse (MP) roughly from 120°to 300°pulse longitude, and inter-pulse (IP) roughly form 10°to 90°, as marked in the panels of Fig.1. In addition, we identify an off pulse region (OP) roughly from 310°to 350°pulse longitude. The MP consists of two distinct peaks, denoted by MP1 and MP2. The component separation between these two peaks is 132°and 116°at 303 and 610 MHz respectively, which is in the same ballpark as reported by earlier studies of this pulsar (Biggs et al., 1985; Gupta et al., 2004).
3.1 Determination of accurate DM
In order to compute the dispersion delay between the profiles at the two frequencies, we need to establish a fiducial point that is expected to remain intrinsically fixed at a pulse longitude, even as the pulse profile evolves with frequency. For PSR B082634, we choose the mid-point of the two peaks of the MP of the average profile as the fiducial point. The measured time delay can be expressed as,
| (1) |
The topocentric pulsar period is 1.84881 s.
is the integer number of pulsar period delay. Using the observing frequencies,
the pulsar period and a first guess DM value we estimate is equal to 1.
is the delay with in a pulse period.
is estimated from the position difference of the fiducial point between 303 and
610 MHz pulse profiles. To determine the position of the fiducial points at either of the two
frequencies, we first estimate the position of the two peaks of the MP, by fitting second
order polynomial functions. Here, the errors in the estimation of the location of the
peaks, are smaller at 303 MHz, as compared to the 610 MHz, because of more complex
structure of the profile peaks at 610 MHz (Fig.1). Using the inferred location
of the fiducial points at the two frequencies, is estimated as 161.1 ms. The error
in depends on the error in the estimation of the fiducial point, which follows from
the error associated with the estimation of the position of MP1 and MP2 at the individual
frequencies.
Using Eqn. 1 and the well known formula that relates the difference in travel
time at the two radio frequencies (Backer, 1993), we obtain a value of 52.2
for the DM of this pulsar, with an error of 0.6 . The comparison of this result
with the DM values in the literature is discussed in Sect. 4.1.
3.2 Study of the pulsar in null state
Both short ( few pulses) and long duration ( few hundred pulses or more) nulls are present in our simultaneous dual frequency data. Fig.2 shows the subpulse patterns at 303 and 610 MHz. For the initial 750 pulses, the pulsar was mostly in an active state except for a few short duration nulls which appear to be simultaneous at the two frequencies (e.g. pulse # 250 to pulse # 260, pulse # 414 to pulse # 421, pulse # 613 to pulse # 621 and pulse # 683 to pulse # 691, in Fig.2).


After the first 750 pulses, the pulsar goes into a long, apparently null state, and this happens simultaneously at both the frequencies. The pulsar remains in this state for the rest of the observations (about 1373 pulses). We obtain the average profile of the active state by integrating the first 750 pulses. Similarly, an average profile of the apparent null state of comparable duration is obtained from the next 750 pulses (see Fig.3). We see that during the null state, there is no evidence of any emission that matches with the active state average profile for the MP or IP regions, at either of the two frequencies. The mean power level in the null state profiles is comparable to the mean level of the OP region of the corresponding active state profiles. The fluctuations of the signal level in the null state profiles, though not completely Gaussian noise-like (probably due to low-level unexcised interference and other sources of “red” noise), show no correspondence with the features in the active state profiles. Furthermore, these features in the null state profiles have no resemblance or correlation between the simultaneous data at 303 and 610 MHz, indicating that these are not genuine profile features. In order to further check for any short duration bursts of strong emission in the null state, we divide the data (the first 1500 pulses in the observation) into 20 blocks and compared the average profiles from these blocks. For the first 10 blocks, during which the pulsar is in the active state, we see the characteristic pulse profile at either of the frequencies. For the next 10 blocks, during which the pulsar is in the null state, we do not see any systematic signature of emission, at either of the two frequencies, in any one of the 10 blocks.
For a more thorough investigation of the null state, we compare the rms values for the MP, OP and full pulse (FP) windows of the integrated pulse profiles (see Table. 1). The rms during the pulsar null state is similar for all the windows (MP, OP and FP) and is also similar to the rms of the OP region of the pulsar active state. These rms values are much smaller than the rms of the MP window of the active state, and their ratios to the corresponding mean values are, to first order, consistent with thermal noise statistics. This behaviour is consistent for both the frequencies, indicating that the null state signal is similar to the OP region of the pulsar’s active state, and contains no detectable level of emission from the pulsar. To further constrain the above conclusion, we integrated the profile data to a time resolution of 20.048 ms, which is a reasonable compromise between integrating all of the pulsar’s signal into a few bins and retaining enough time resolution to detect any large scale emission structure. Comparing the peak deflection in the active state profiles with three times rms of the fluctuations in the null state profiles, we conclude that there is no emission in the null state down to a level of 2% of the peak in the active state, for either frequency.
The dual frequency observations used a limited number of antennas at each frequency and are not very sensitive. In order to achieve better sensitivity, we use the results from the single frequency observations carried out with larger number of antennas in phased array mode. Fig. 4 and Fig. 5 show the active and null state profiles from these observations. Whereas the active and null state profiles for the 325 MHz observations are from different days, those for the 157, 610 and 1060 MHz observations are cases where the pulsar transited from the active to null state during the same observing session.
As can be seen, there is no evidence for systematic emission from the pulsar in the null state at any of the frequencies. Non-random features in the null state profiles, where seen, have no correspondence between different frequencies, or even for the same frequency at different epochs.
Comparing the peak deflection in the active state profile with three times the rms of the fluctuations in the null state average profile at a time resolution of 20.048 ms, we conclude that at 610 MHz there is no emission in the null state down to a level of 0.5 % of the peak in the active state. At 1060 MHz no signature of emission is seen in the null state profile down to 1.2% of the peak in the active state. Similarly, at 157 MHz the limit is 1.3%.
From the absolute flux calibration available, we determine the flux of the peak for 610 MHz active state to be 410 mJy, and the 3-sigma non-detection limit in the null state corresponds to about 2 mJy. Similarly, from the absolute flux calibration available for the null state observations at 325 MHz, we find the 3-sigma non-detection limit at this frequency to be 7 mJy. For the cases where we do not have any flux calibrator source observed, we follow a relative calibration procedure, using the knowledge of the observing parameters and the background sky temperature near the source. As a crosscheck we find that, for the single frequency 610 MHz observations, the flux values estimated with absolute and relative calibration are similar.
Though the scintillation properties of PSR B082634 is not studied, still we try to understand the effect of scintillation on the observed flux, by comparing with two nearby pulsars for which the scintillation properties are known. The mean flux densities for two nearby pulsars, PSR B0823+26 and PSR B0834+06, are observed to change by 35% between the observing epochs (Bhat et al., 1999). Between the two observing sessions of PSR B082634 at 610 MHz, we observe, 27% change of the mean flux of the FP. The mean flux at 610 MHz is close to the mean flux estimated by Biggs et al. (1985) at 645 MHz. Estimated mean flux changes by 12% between two observing sessions at 303 and 325 MHz. So, the flux variation observed by us are well within the 3 limit of what is reported for the nearby pulsars. Hence, it is likely that the estimated mean flux values of PSR B082634 are affected by the scintillation to a moderate extent.
In Table.1 we list the flux at the peak and the mean flux of PSR B082634 for FP, MP and IP regions at different frequencies. Fig. 6 illustrates the frequency evolution of the mean flux density of the FP, MP and IP regions. At lower frequencies like 157 MHz, the IP is almost absent and the MP is the dominant component. With increasing frequency the mean flux density of the IP increases. At 610 MHz, the mean flux density of the MP and the IP are almost equal and at 1060 MHz, the IP flux density dominates the MP. For the simultaneous dual frequency observations, we see that the FP and MP has quite steep spectral index, -1.9 and -2.1 ,whereas the IP has flatter spectral index, 0.3 (where is defined by ). These are similar to the results reported by Biggs et al. (1985) between 408 and 645 MHz. From single frequency observations at 610 and 1060 MHz, the calculated spectral indexes are, 2, 1.2 and 3.2. Hence, the spectral index for this pulsar is different for different profile components and also evolves with frequency. This can be understood by considering that the IP emission is coming from a second ring of emission which is missed by our line of sight at the lower frequencies and is visible at the higher frequencies, as proposed by Gupta et al. (2004).

To summarize, our results show similar limits ( 1% of peak of active state profile, or better) of non-detection of emission in the null state, at frequencies of 157, 303, 325, 610 and 1060 MHz. These results are in apparent disagreement with those obtained at 1374 MHz by Esamdin et al. (2005), who report presence of weak emission in the apparent null state. We discuss the implications of this in Sect.4.2.
3.3 Study of subpulse emission
We align the 303 and 610 MHz data from the simultaneous dual frequency observations, by removing the initial 2009 ms of data (corresponding to the dispersion delay) from the 303 MHz data. This allows us to directly compare the corresponding single pulses from these two frequencies.

3.3.1 Pulse energy correlation
To study the correlation of pulse energy fluctuations as a function of frequency and pulse lag, we compute the correlation of the total energy under the MP (hereafter TEmp), for different pulse lags, individually at 303 and 610 MHz, as well as between these two frequencies. For a train of single pulses with pulse number , , the correlation function is given by (Bartel, 1981),
| (2) |
where , denote the concerned frequencies (303 or 610 MHz); and are the TEmp of the th pulse for frequencies and , respectively; , are the mean energies, and , are the variances for TEmp over pulses. A similar procedure is adopted for the IP, where applicable.
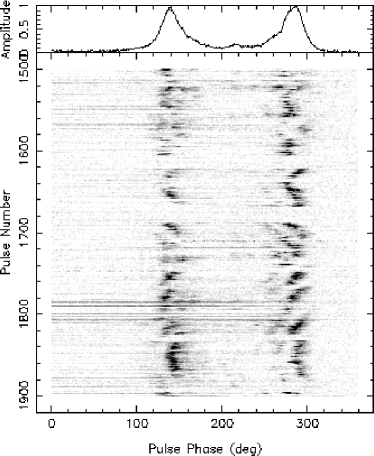
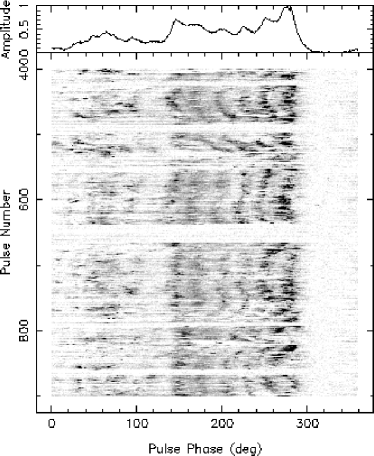
Fig.7 shows the correlation function (for pulse number 1 to 750), for autocorrelation of TEmp at 303 and 610 MHz, autocorrelation of TEip at 610 MHz and crosscorrelation of TEmp between 303 and 610 MHz, as a function of increasing pulse lag. The TEmp for the active state (pulse number 1 to 750), with zero pulse lag (i.e. ), is 47% correlated between 303 and 610 MHz. Moreover, this level is very similar to the correlation at each of the two frequencies. All these three curves (as well as that for the autocorrelation of the IP at 610 MHz), follow very similar shapes with pulse lag, and show positive correlations out to fairly large lags: about 11 periods. Similar results are obtained from correlation studies of the higher sensitivity single frequency data. Furthermore, from the single frequency data, we find a crosscorrelation between TEmp and TEip of about 22% at 610 MHz and 17% at 1060 MHz. In the autocorrelation function for 303 MHz (Fig. 7), and also in the autocorrelation of the 610 MHz data from the single frequency observations (not shown in Fig. 7) a secondary maximum is present at pulse lag , which is not consistently seen in all correlation functions. These different aspects of the correlation results, including comparison with existing results for other pulsars, are covered in Sect.4.3.
3.3.2 Study of subpulse drifting
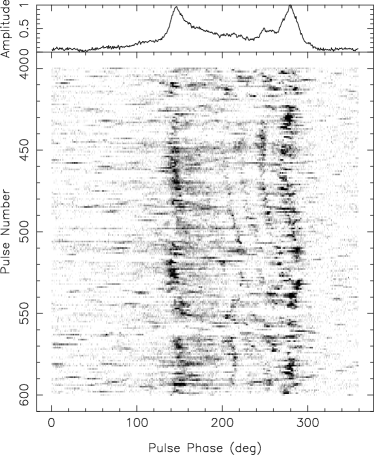
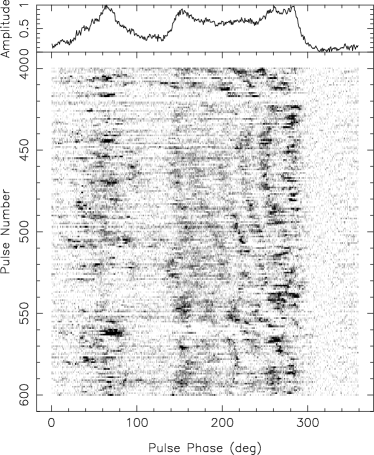
Drifting subpulses observed simultaneously at 303 and 610 MHz (e.g. Fig.2), broadly reproduce the features reported by earlier studies at various individual frequencies (Biggs et al., 1985; Gupta et al., 2004; Esamdin et al., 2005). For a closer investigation of the simultaneous subpulse behaviour, we zoom into a sequence of 200 pulses (pulse # 400 to pulse # 600) as shown in Fig.8. At any given time, the simultaneous multiple subpulses present in the main pulse window follow the same drift rate and sign, at both the frequencies. The pulse regions showing different drift rates of opposite signs are always connected by a region showing smooth transition of drift rate, as reported by Gupta et al. (2004). Such transitions, seen in pulse numbers 440 to 460, 500 to 520, 540 to 560 and 570 to 590, also occur simultaneously at 303 and 610 MHz. The gray scale plot of the single pulses from the higher sensitivity 610 MHz single frequency observations (Fig. 9) show coherent drifting in the MP and IP regions, with approximately 6 drift bands in the MP and 4 drift bands in the IP. Subpulse drifting is observed under the two peaks of the MP at 157 MHz (Fig. 9).

Though the drifting subpulses show very similar structure in our simultaneous dual frequency observations, there are subtle differences such as changes in the separations and widths of the subpulse as a function of frequency. To investigate the change of drift band separation, we compute from the autocorrelation function of the single pulses, averaged over the 750 pulses in the active state. In order to clearly see the secondary maximum in the correlation function (which will give us the value), we correlate adjacent pulses with different longitude lags, rather than the same pulse (which is the traditionally correct procedure). This one pulse offset method suppresses a large amount of the correlation within the same subpulse, and as a consequence the secondary peak becomes stronger and easily detectable. This can be seen by comparing Fig.4 of Gupta et al. (2004) with our Fig.10. We find = 22.60.8°at 303 MHz and 27.90.8°at 610 MHz. Thus, the value of evolves with frequency. Any doubt about epoch dependent variations of manifesting as variation of with frequency can clearly be ruled out with these simultaneous dual frequency results. Further frequency evolution of is obtained from our single frequency observations at different frequencies, the results from which are summarised in Table. 4. In addition, we find 20°for the IP region, from 610 and 1060 MHz single frequency observations.


| Reference | DM value quoted |
|---|---|
| () | |
| Durdin et al. (1979) | 52† |
| EPN database | 47† |
| Gould and Lyne (1998) & D’Amico et al. (1998) | |
| Taylor, Manchester and Lyne (1993) | 474‡ |
| Gupta et al. (2004) | 47† |
| Hobbs et al. (2004) | 52.90.6‡ |
| Esamdin et al. (2005) | 65.6† |
| This paper | 52.20.6§ |
: DM determination method not described
: DM determined using timing analysis
: DM determined using Simultaneous dual frequency observations
To study the longitude evolution of , we repeat the correlation analysis over few chosen windows ( 32°wide) of pulse longitude which are shifted systematically over a selected portion of main pulse window, in steps of 8°. Fig.11 is a sample plot of correlation functions for 7 different pulse windows at 303 MHz and 610 MHz. For 303 MHz we observe a smooth trend for variation of across the pulse window, with a minimum of 20.4°to a maximum of about 25°, which is compatible with the mean of 22.6°we obtained from the full main pulse. increases from the centre towards the edge of the MP, similar to the variation reported by Gupta et al. (2004) at 318 MHz. For 610 MHz, the variation is from a minimum of 26.3°to a maximum of 30.3°, again with a tendency to be lower in the middle of the MP, though the results are not as clear as for 303 MHz.
To study the variation of subpulse width, , with frequency, we compute the autocorrelation function (without any pulse offset) and find the full width at half maximum (FWHM). Average value for is found to be 17.4°at 303 MHz, and 14.2°at 610 MHz, again confirming a frequency evolution. We collect values of at different frequencies, from our observations as well as from literature, in Table. 5. We observe longitude evolution of : for region I (from 118°to 197°pulse longitude) is significantly more than that for region II (from 197°to 276°pulse longitude) for all the frequencies. For a more detailed study of the longitude evolution of within the MP, we followed a window scheme, similar to that employed for the variation study. We find, varies smoothly over the pulse window, in a manner that is somewhat similar to that of variation with longitude, lower values in the middle part of the MP and higher values towards the edges ( values near MP1 being more than those near MP2).
| Pulsar | Frequency range | Correlation Coefficient | Pulse Lag up to which | Reference |
| MHz | correlation is positive | |||
| B003107 | 275 | 70% | - | Taylor, Manchester and Huguenin (1975) |
| 415 | ||||
| B003107 | 102 | 50% | 10† | Izvekova et al. (1991) |
| 406 | ||||
| B032954 | 327 | 75% | 2† | Bartel and Sieber (1978) |
| 2695 | ||||
| B032954 | 102 | 5030% | 4† | Bartel (1981) |
| 1720 | ||||
| B032954‡ | 238 | 673% | - | Kramer et al. (2003) |
| 626 | ||||
| B080974 | 275 | 70% | - | Taylor, Manchester and Huguenin (1975) |
| 415 | ||||
| B080974 | 102 | 3010% | 4† | Bartel (1981) |
| 1720 | ||||
| B082634 | 303 | 47% | 11 | This paper |
| 610 | ||||
| B083406 | 275 | 70% | - | Taylor, Manchester and Huguenin (1975) |
| 415 | ||||
| B113316 | 275 | 78% | - | Taylor, Manchester and Huguenin (1975) |
| 415 | ||||
| B113316 | 327 | 75% | 2† | Bartel and Sieber (1978) |
| 2695 | ||||
| B113316§ | 341 | 724% | - | Kramer et al. (2003) |
| 626 | ||||
| B150855 | 102 | 3020% | 1† | Bartel (1981) |
| 1720 |
- : indicate that value for the corresponding parameter is not known
: values obtained from visual inspection of plots for crosscorrelation coefficients vs pulse lag from respective references
: Table 4 of Kramer et al. (2003) list the crosscorrelation coefficients between various other frequencies for B032954.
Karastergiou et al. (2003) reported similar values of crosscorrelation coefficients
: Table 5 of Kramer et al. (2003) list the crosscorrelation coefficients between various other frequencies for B113316
4 Discussions and Summary
4.1 Determination of accurate DM value
Table. 2 compares our result for the DM value of PSR B082634 with other available values from the literature these cover a wide range, with the two most recent papers (Gupta et al., 2004; Esamdin et al., 2005) using values of 47 and 65.6 . It is clear that, unlike most normal pulsars, DM determination for this pulsar is a difficult and trick exercise, mainly because the profile is quite complex, very wide and strongly evolving with frequency. Given our more accurate method of determining the DM, we believe that the either of the extreme values above are unlikely to be correct. We note that our DM result is closest to value obtained by Hobbs et al. (2004), using multi epoch timing. The accuracy of both these methods depends on the choice of fiducial point. The advantage of our method of DM determination is that, the observations at a single epoch are self sufficient for obtaining the DM value at that epoch, without requiring any absolute timing information. This method can facilitate the DM determination of other complex and wide profile pulsars.
4.2 Study of the pulsar in null state
We see short duration nulls of a few pulses, which appear to be simultaneous over the frequency range of 303 to 610 MHz. In addition, this pulsar exhibits long durations of what is apparently a null state, which also appears to be broad band over this frequency range. However, we find no evidence for any weak emission in these long, apparently null states of the pulsar. Non-detection of any correlated emission structure in the null state profiles from the simultaneous dual frequency observations (at 303 and 610 MHz) are a clear proof of this. For frequencies above (up to 1060 MHz) and below (down to 157 MHz) also, we see no evidence for any weak emission. Our best limits on this non-detection are comparable to, or a few times better, than the level of detection (2%) that Esamdin et al. (2005) report for the null state of this pulsar, at 1374 MHz. These comparisons are all with respect to the peak of the emission profile in the active state. We have also obtained absolute flux limits for the non-detection at various frequencies, which should be a useful comparison standard for any more sensitive studies in the future.
What could be the reason for the difference between our results and those of Esamdin et al. (2005)? It could be a case of frequency dependent nulling, as reported by Bhat et al. (1999) for PSR B113316 where the pulsar exhibits cases of short duration nulls at lower frequencies like 325, 610 and 1400 MHz, while there is visible emission at 4850 MHz. However we believe that this explanation is difficult, given that we see no evidence for emission till the frequency of 1060 MHz, coupled with the fact that the emission properties of this pulsar appear to be significantly correlated over an octave range in frequency. Hence, we are unable to reconcile our results with the results of Esamdin et al. (2005).
4.3 Study of subpulse emission
| Pulsar | Frequency | Profile width | Comments | Reference | |
| MHz | (°) | (°) | |||
| B003107 | 60 | 75 | 20.6 | Izvekova et al. (1991) | |
| 102 | 65 | 19.8 | |||
| 406 | 40 | 18.7 | |||
| B003107 | 157 | 445 | 18.91.2 | evolution | Smits et al. (2007) |
| A-mode | 243 | 39.51.5 | 244 | does not follow | |
| 325 | 39.40.3 | 19.81.0 | definite trend | ||
| 607 | 324 | 213 | |||
| 840 | 32.20.8 | 103 | |||
| 1167 | 256 | 145 | |||
| 4850 | 23.60.6 | 142 | |||
| B003107 | 157 | 46.31.4 | 19.20.7 | decreases | Smits et al. (2007) |
| B-mode | 243 | 42.30.6 | 18.71.6 | or remains unchanged | |
| 325 | 40.30.12 | 18.70.6 | with increasing | ||
| 607 | 39.30.9 | 18.70.6 | frequency | ||
| 840 | 430.9 | 141.6 | |||
| 1167 | 385 | 123 | |||
| B032039 | 102 | 11 | 3.8 | Izvekova et al. (1991) | |
| 406 | 8.5 | 3.1 | |||
| B080974 | 102 | 34.8 | 14.7 | see Sect.4.3 | Davies et al. (1984) |
| 406 | 26.0 | 10.8 | |||
| 1412 | 29.8 | 8.6 | |||
| 1720 | 27.2b | 8.1 | Bartel (1981) | ||
| B082634 | 157 | 1404† | 23 0.8 | This Paper | |
| 303 | 1324† | 22.60.8 | This paper | ||
| 318 | 1344† | 24.90.8 | increases with | Gupta et al. (2004) | |
| 610 | 1164† | 27.90.8 | increasing frequency from | This paper | |
| 645 | 1124† | 292.0 | 303 to 645 MHz | Biggs et al. (1985) | |
| 1060 | 1174† | 28.70.8 | This Paper | ||
| 1374 | - | 27.5 | Esamdin et al. (2005) | ||
| B123725 | 430 | 16a | 10.62 | Wolszczan et al. (1981) | |
| 1700 | 14.5b | 9.11.5 | |||
| B201628 | 102 | 20 | 8.5 | Izvekova et al. (1991) | |
| 406 | 15 | 6.2 | |||
| 1412 | 15 | 5.5 | |||
| B202028 | 430 | 17a | 28.34 | increases with | Wolszczan et al. (1981) |
| 1700 | 16.2b | 51.47 | frequency |
: Profile width at 10% intensity level
a : average profile width at 400 MHz from Gould and Lyne (1998)
b : average profile width at 1600 MHz from Gould and Lyne (1998)
I,II : left and right part of MP respectively, see Fig.1 of Biggs et al. (1985)
: separation between two components of main pulse
(i) Pulse energy correlations : Our result that the fluctuations of the main pulse energies at 303 and 610 MHz are correlated up to 47% level, indicates that the emission process generating the single pulses has a high degree of correlation over a this octave bandwidth. What is equally noteworthy is that this level of correlation is pretty much the same as that at each of these individual frequencies, indicating that there is practically no loss of correlation over this range of frequency. Table.3 lists the correlation coefficient of pulse energies for different pulsars between two different observing frequencies, reported in the literature. All the pulsars listed there show significantly high correlation, supporting the case for the broad band nature of pulsar radio emission. At the same time, the significantly lower correlation between the main pulse and inter-pulse energies at 610 and 1060 MHz, implies that the physical processes responsible for the MP and IP emission may be much more unrelated to each other.
The result that the intensity correlations are positive for large lags implies that there is some kind of memory in the underlying subpulse structure. That this memory is the longest for PSR B082634 (amongst all known cases), is quantified in column 4 of Table.3. This is likely to be related to the large number of subpulses (or drift bands) that each main pulse energy estimate encompasses. The memory could then correspond to the time taken for the emission from a given subpulse spark column to drift through the main pulse window.
The other memory that the main pulse intensity variations exhibit is the intriguing feature of the peak at lag 13 seen in some of the correlation results. This could be an indication of the total time for rotation, around the magnetic axis, of the pattern of drifting subpulses the carousel rotation time. For example, in the 14 spark model presented by Gupta et al. (2004), the drift rate is such that one subpulse drifts to a location close to that of the adjacent subpulse in one pulsar rotation, leading to a carousel rotation time of . However, if we believe that there are 13 sparks, as indicated in the model given by Esamdin et al. (2005), with the same drift rate condition as proposed by Gupta et al. (2004), then we would have , matching with the secondary peak feature seen in our data.
(ii) Study of subpulse drifting: PSR B082634 exhibits substantial variations of at different frequencies, usually reported at different observing epochs (Table.4). The different values of determined from the simultaneous data at 303 and 610 MHz strongly supports the claim that these are genuine variations with frequency, and not due to some time dependent phenomenon. The collected results in Table.4 are consistent with a scenario where increases with frequency from 157 to 645 MHz, but then appears to saturate or even turn over at the higher frequencies like 1060 and 1374 MHz. For the low frequency range, we find that this frequency evolution () is of opposite sense to that for the profile width, as measured by the separation between two components of the MP (). Only two other pulsars in Table.4 show such an abnormal behaviour : PSR B202028 shows a clear opposite sense (though only 2 frequency points are available) and PSR B003107 in the A-mode shows erratic increases and decreases of with increasing frequency.
For most pulsars, though both and the average profile width decrease with increasing frequency, the evolution of these two quantities with frequency does not exactly match (see Table.4). Izvekova et al. (1991) showed in detail that is, in general, less dependent on frequency, as compared to the profile width this is reflected in our Table.4 as well. This has been explained (Gil and Krawczyk, 1996; Gil et al., 2002) to be a natural consequence of the conal model of pulsar beams (Rankin et al., 1993) the subpulse enhancement follows a narrow bundle of dipole field lines, while the mean enhancement corresponding to the peaks of mean profile components, is distributed over a cone (or a number of nested cones) of dipole field lines. Thus, the frequency dependence of subpulses and pulse widths should in general be different. However, these models do not appear to explain the opposite sense that we see in PSR B082634.
Another pulsar with anomalous frequency variations of profile width and is PSR B080974. being 1:8 times greater at 102.5 MHz than at 1720 MHz, for this pulsar, is explained by Edwards et al. (2003) as an artifact of the phase step, which is only present at high frequencies. Whereas Rankin et al. (2005) analysed the variations between 40 to 1400 MHz for this pulsar, and showed that they arise from incoherent superposition of two orthogonal modes of polarisation. It will be interesting to see if detailed polarisation studies of PSR B082634 can throw some light on the variations with frequency.
The other interesting result is the variation of with pulse longitude, where we confirm the behaviour first reported by Gupta et al. (2004) at 318 MHz (a variation from 21.5°to 27°within the MP), and also find some signs for a similar effect at 610 MHz. Similarly, Esamdin et al. (2005) reported that at 1374 MHz, varies from 26.8°to 28°within the MP. Gupta et al. (2004) have provided an explanation of this in terms of the geometrical effect of the way our line-of-sight traverses the polar cap.
determined in this work is compared to the result quoted by (Biggs et al., 1985; Esamdin et al., 2005) at 645 and 1374 MHz respectively in Table. 5. is observed to be frequency dependent, average at 303 MHz is more than 610 MHz value (see Sect.3.3). In addition, is observed to be longitude dependent: in region I is more than region II (Table. 5). Similar longitude evolution of within the MP is reported by Biggs et al. (1985) and Esamdin et al. (2005).
To summarise, using results from high sensitivity single pulse observations simultaneously at 303 and 610 MHz, and individually at 157, 325, 610 and 1060 MHz, we have investigated different aspects of PSR B082634: (1) precise value of DM (2) emission properties of the long duration null states and (3) simultaneous subpulses and details of the drifting behaviour.
| Frequency | Reference | ||||
|---|---|---|---|---|---|
| (MHz) | (°) | ||||
| MP | I | II | IP | ||
| 157‡ | 15.8§ | 22.1§ | 10.2§ | - | This paper |
| 303† | 17.4§ | 28.4§ | 12.6§ | - | This paper |
| 610† | 14.2§ | 22§ | 12.6§ | 12.6§ | This paper |
| 610‡ | 14.2§ | 22.9§ | 12.6§ | 12.6§ | This paper |
| 645 | - | 14∗ | 5.9∗ | 4 ∗ | Biggs et al. (1985) |
| 1060‡ | 14.2§ | 20.5§ | 12.6§ | 17.4§ | This paper |
| 1374 | 13.11.9 | - | - | 193.5 | Esamdin et al. (2005) |
: From simultaneous dual frequency observing session
: From single frequency observing session
I : 118°to 197°pulse longitude
II : 197°to 276°pulse longitude
: Lag corresponding to half width at half maximum (HWHM) values
: Error associated in determination of is 1.6°
5 Acknowledgments
We thank the stuff of the GMRT for help with the observations. The GMRT is run by the National Centre for Radio Astrophysics of the Tata Institute of Fundamental Research. JG acknowledges the partial support of Polish Grant N N203 2738 33.
References
- Ahuja et al. (2005) Ahuja, A. L., Gupta, Y., Mitra, D., and Kembhavi, A. K., 2005, MNRAS, 357, 1013
- Bhattacharyya et al. (2007) Bhattacharyya, B., Gupta, Y., Gil, J. and Sendyk, M., 2007, MNRAS, 377, L10
- Backer (1993) Backer, D. C., Hama, S., Hook, S. V. and Foster, R. S., 1993, ApJ, 404, 636
- Bartel (1981) Bartel, N., Sieber, W.; Wielebinski, R.; Kardashev, N. S.; Nikolaev, N. Ia.; Popov, M. V.; Soglasnov, V. A.; Kuzmin, A. D.; Smirnova, T. V., 1981, A&A, 93, 85
- Bartel (1981) Bartel, N., 1981, A&A, 97, 384
- Bartel and Sieber (1978) Bartel, N. and Sieber, W., 1978, A&A, 70, 307
- Bartel and Sieber (1978) Bartel, N. and Sieber, W., 1978, A&A, 68, 361
- Bhat et al. (2007) Bhat, N. D. R.; Gupta, Y.; Kramer, M.; Karastergiou, A.; Lyne, A. G.; Johnston, S., 2007, A&A, 462, 257B
- Bhat et al. (1999) Bhat, N. D. R.; A. P. Rao; Gupta, Y.; 1999, ApJ, 121, 483
- Biggs et al. (1985) Biggs, J. D, McCulloch, P. M., Hamilton, P. A., Manchester, R. N. and Lyne A. G., 1985, MNRAS 215, 281
- D’Amico et al. (1998) D’Amico, N., Stappers, B. W., Bailes, M., Martin, C. E., Bell, J. F., Lyne, A. G. and Manchester, R. N., 1998, MNRAS, 297 28
- Drake and Craft (1968) Drake, F. D. and Craft, H. D., 1968, Nature, 220, 231
- Davies et al. (1984) Davies, J. G., Lyne, A. G., Smith, F. G., Izvekova, V. A., Kuzmin, A. D. and Shitov, Yu. P., 1984, MNRAS, 211, 57
- Durdin et al. (1979) Durdin, J. M., Large, M. I., Little, A. G., Manchester, R. N., Lyne, A. G., Taylor, J. H., 1979, MNRAS 186, 39
- Esamdin et al. (2005) Esamdin, A., Lyne, A. G, Graham-Smith, F., Kramer, M. and Manchester, R. N., Wu, X., 2005 MNRAS 356, 59
- Edwards et al. (2003) Edwards, R. T., Stappers, B. W., 2003, A&A 410, 961
- Gil and Krawczyk (1996) Gil, J., and Krawczyk, A., 1996, MNRAS, 280, 143
- Gil et al. (2002) Gil, J., Gupta, Y., Gothoskar, P. B. and Kijak, J., 2002, ApJ, 565, 500
- Gil and Sendyk (2000) Gil, J. and Sendyk, M., 2000, ApJ, 541, 351
- Gould and Lyne (1998) Gould, D. M. and Lyne, A. G., 1998, MNRAS, 301, 235
- Gupta et al. (2004) Gupta, Y., Gil, J., Kijak, J. and Sendyk, M., 2004, A&A, 426, 229
- Gupta et al. (2000) Gupta, Y., Gothoskar, P. B., Joshi, B. C., Vivekanand, M., Swain, R., Sirothia, S., and Bhat, N.D.R., 2000, in IAU Colloq. 177, Pulsar Astronomy, ed. M. Kramer, N. Wex, And R. Wielebinski (ASP Conf. Ser. 202; San Francisco: ASP), 277
- Kijak et al. (2003) Kijak, J., Gil, J., 2003, A&A, 397, 969
- Kramer et al. (2003) Kramer, M.; Karastergiou, A.; Gupta, Y.; Johnston, S.; Bhat, N. D. R.; Lyne, A. G. 2003, A&A, 407, 655
- Karastergiou et al. (2003) Karastergiou, A.; Johnston, S.; Kramer, M., 2003, A&A, 404, 325
- Izvekova et al. (1991) Izvekova, V. A., Kuzmin, A. D., Lyne, A. G., Shitov, Y. P. and Graham-Smith, F., 1993, MNRAS, 261, 865
- Hobbs et al. (2004) Hobbs, G., Lyne, A. G., Kramer, M., Martin, C. E. and Jordan, C. A., 2004, MNRAS, 353, 1311
- Rankin et al. (1993) Rankin, J. M., 1993, ApJS, 85, 145
- Rankin et al. (2005) Rankin, J. M., Ramachandran, R. and Sulymanova, S. A. 2005, A&A, 999, 1006
- Smits et al. (2007) Smits, J. M.; Mitra, D.; Stappers, B. W.; Kuijpers, J.; Weltevrede, P.; Jessner, A.; Gupta, Y., A&A, 465, 575
- Swarup et al. (1997) Swarup, G., Ananthakrishnan, S., Subrahmanya, C. R., Rao, A. P., Kulkarni, V. K. Kapahi, V. K., 1997, in High Sensitivity Radio Astronomy, ed. N. Jackson and R. J. Davis (Cambridge: Cambridge University Press)
- Taylor, Manchester and Huguenin (1975) Taylor, J. H., Manchester, R. N. and Huguenin, G. R., 1975, ApJ, 195, 513
- Taylor, Manchester and Lyne (1993) Taylor, J. H., Manchester, R. N. and Lyne, A. G., 1993, ApJS, 88, 529
- Turner et al (1980) Tuner P., 1980, University of Tasmania
- Qiao et al. (2004) Qiao G., Lee, K. J., Zang, B., Xu, R. X. and Wang, H. G., 2004, ApJ, 616, L127
- Weltevrede et al. (2006) Weltevrede P., Edwards R.I., Stappers B.W., 2006, A&A, 445, 243
- Weltevrede et al. (2007) Weltevrede P., Edwards R.I., Stappers B.W., 2007, A&A, 469, 607
- Wolszczan et al. (1981) Wolszczan, M. A., Bartel, N. and Sieber, W., 1981, A&A, 100 91