The Origin and Evolution of the Interstellar Medium in Early-type Galaxies
Chapter IV -
Chandra Observations of Early-type Galaxies
Abstract
We have performed uniform analysis of a sample of 54 nearby, early-type galaxies observed with Chandra. In this work we present the spectral results for both the diffuse Interstellar Medium, ISM, and low-mass X-ray binaries, LMXBs. We determine the metallicity of the hot ISM in the 22 brightest galaxies and find a narrow range of abundance ratios relative to iron. The average iron metallicity of these bright galaxies is relative to solar. By assuming these enrichment patterns continue to fainter galaxies, we are able to extend accurate ISM modeling down to the faintest galaxies in the sample. The sample of galaxies span 4.5 orders of magnitude in X-ray luminosity starting at and the average gas temperature in the sample is . We present the X-ray properties of these galaxies scaled to one effective radius as well as radial variations of gas and stellar binary luminosities, and radial variations of gas temperature, metallicity, mass, entropy and density.
1 Introduction
Ever since the discovery that most early-type galaxies host hot, X-ray emitting gas halos (Forman et al., 1979), attempts have been made to understand the origin and evolutionary fate of this gas and how this relates to the formation history of the galaxy itself. This gas provides a probe of the gravitational potential, and signatures of recent tidal or cluster interactions can be detected by examining the mass and temperature of the gas. Although great progress has been made, after Einstein, ROSAT, and ASCA, and the first years of Chandra and XMM, questions remain and the discord between the properties of the interstellar medium (ISM) detected in X-rays and the predicted characteristics from other waveband data has not been adequately resolved. For example, the metallicity of the ISM is expected to be at least solar since the stars shedding their envelopes into the ISM have optically measured metallicities near solar (e.g. Trager et al. (2000a, b); Terlevich & Forbes (2002)), but ASCA data were unable to discriminate between extremely sub-solar metallicity (Mushotzky et al., 1994), solar metallicity (Matsushita et al., 1997) or even two plasmas with different temperatures and higher metallicities (Buote, 1999; Buote & Fabian, 1998). Irrefutable metallicity determinations from XMM’s Reflection Grating Spectrometer (RGS) have shown the metallicity of several, nearby and bright galaxies to be near solar metallicity, and with non-solar metal-to-metal ratios (Xu et al., 2002; Tamura et al., 2003), but these results have not yet been reproduced from the Chandra imaging data, which does a better job of isolating the diffuse gas than XMM’s slitless RGS. It is also not clear if the two galaxies examined are representative of all nearby early-type galaxies.
The greatest disparity between the inferred properties of the gas from X-ray observations and other waveband observables concerns cooling flows. While there is some debate about the metallicity of the gas, the density of the gas is well determined, typically in the center of an early-type galaxy. It is a straightforward observation to determine the density as the emission measure varies as , although, this implies a cooling time of which is at odds with the observed equilibrium of the gas and a wealth of other waveband observations (e.g. the lack of star formation seen in normal early-type galaxies). Recently, the FUSE observatory has been used to detect cooling gas (Bregman et al., 2001), but at much lower rates than implied by the densities observed in the X-rays. Many of these galaxies have been surveyed for [O II] emission (e.g. Macchetto et al. (1996)) and FIR emission (e.g. Goudfrooij et al. (1994a)) in efforts attempting to detect hidden star formation, but there are no strong detections. This non-detection of cooling likely means an additional heating source, but all the likely candidates (SNe and/or AGN) have inconsistent rates, energetics, spatial, or spectral distributions from the needed missing heat source.
Observations of individual galaxies provide important contributions to the field, especially when new satellites are launched, however, the baseline of knowledge of the hot gas in early-type galaxies is derived from large (sample size 25) studies (See Table 1 for large X-ray studies of early-type galaxies). In fact, it was through the large studies that the existence of the hot gas was first discovered as a universal phenomenon in early-type galaxies (Forman et al., 1985). These large X-ray studies seek to address one or more of the following goals: 1) infer the physical source(s) of the X-ray emission, 2) calculate accurate global plasma temperatures, densities and metallicities and measure radial variations of these quantities, 3) characterize the morphology of the hot gas via surface brightness profiles, 4) determine the scaling relations between global galaxy properties: X-ray luminosity, temperature, stellar velocity dispersion and optical stellar luminosity, 5) detect any influences the environment may have on the X-ray properties. Depending on the technical capabilities of the X-ray mission employed, the large surveys had differing levels of success in addressing each of these goals. O’Sullivan et al. (2001) notes that an order of magnitude disparity exists in the methods for statistically removing the point source contribution and isolating the diffuse emission from the low-mass, X-ray binaries, LMXBs. The spatial resolution of Chandra allows for the isolation of the point sources from the diffuse emission which has been the major source of uncertainty in previous studies of the hot ISM in fainter galaxies.
A large study with the Chandra satellite provides significant advances in addressing the large study goals due to its superb spatial resolution and moderate spectral resolution. As of 2003, no large study of nearby, early-type galaxies have been published with Chandra or XMM-Newton observatories despite the maturity of the archives. Although XMM has a larger collecting area, it is the fine spatial resolution of Chandra that will provide the next critical step in understanding X-ray emission from early-type galaxy as the majority of the “containmenating” stellar binary component can finally be removed from gas studies.
Motivated by the scientific returns of a large study of early-type galaxies with Chandra and the availability of over five dozen galaxies in the public archive, we conducted an extensive program investigating all components of the X-ray emission in early-type galaxies. In Section 2 the sample is defined and limitations of a Chandra archival study are discussed. In Section 3 the data reduction process is described, including efforts taken to correct the known calibration issues. Section 4 discusses the spectral analysis method and the success of its application to the data. Section 5.1 presents the results of the spectral fitting of the data and, where sufficient counts are available, radial variations of the physical parameters fitted in the models. In Section 5.2 global X-ray properties of the sample are presented. We compared the luminosities and temperatures derived with Chandra to ROSAT in Section 6.
2 Galaxy Sample
The sample selection criteria is simply defined as any nearby early-type galaxy observed by Chandra and in the archive. Since our methodology depends on the low-energy response of the backside illuminated chips of the ACIS array, we restrict our study to ACIS-S3 observations. In Table 2 the 54 galaxies in the archive that meet this selection criteria along with their distances, blue magnitudes, X-ray fluxes determined with ROSAT and effective radii are listed. All the galaxies are relatively nearby, with distances between 10 and 110 Mpc, and bright, with , and most have been studied in one of the previous large studies (Table 1). Also listed in Table 2 is any peculiar property of the galaxy; included in the sample are a number of dwarf, starburst, merging, isolated, interacting and brightest group galaxies which, for various reasons, may fall outside the realm of normal early-type galaxy characterization.
The relatively small field of view of the Chandra ACIS-S3 chip (), presents a limitation to accurately determining global properties for large nearby galaxies which have halos detected with ROSAT out to tens of arcminutes. But since the X-ray emission is sharply peaked, this correction is small and if needed, can be extrapolated from ROSAT or XMM data. We note that the three of the four brightest galaxies are also the most distant, preserving a general on-chip size scale for the sample as a whole (i.e. even the largest galaxies can be observed out to one effective radius without vignetting).
3 Data Reduction
The data were processed in a uniform manner following the Chandra “scientific threads”111http://cxc.harvard.edu/ciao/threads employing CIAO 3.2 coupled with CALDB 3.0. All of the data were reprocessed with the most recent standard gain maps provided. The 5x5 array telemetered for each event in the “Very Faint” observing mode allowed for improved screening of cosmic rays and decreases the background by about a factor of 1.25 for S3 observations.222http://cxc.harvard.edu/cal/Links/Acis/acis/Cal_prods/vfbkgrnd/index.html Otherwise the standard cosmic ray rejection method was used. ASCA grades of 0,2,3,4 and 6 were selected for all subsequent processing and analysis. Bad pixel maps, specific for each observation, were applied from the standard calibration library. In galaxies with strong AGN activity, pile-up becomes a concern, so the central regions in these galaxies are excluded from the diffuse and point source analysis. The data were corrected for the charge-transfer inefficiency that degrades the spectral resolution of the imaging devices with the standard processing techniques for the -120 temperature data.
We checked for background particle flares via a temporal background rate light-curve from the S1 chip if the S1 chip was read out with the S3 chip following the data cleaning procedures described in Markevitch (2002). In about half of the observations, the S1 chip was not read out (only six of the ten ACIS chips can be read out for any given observation and these six are chosen by the observer). For these observations the temporal light-curve was constructed from the outer regions of the S3 chip. The energy sampling was restricted from 2.5-7.0 keV to increase sensitivity to the most common type of flares detected (Markevitch, 2002). For the temporal filtering, a mean background rate was determined by isolating a quiescent period and a 2.5 deviation was determined from this non-active period. This quiescently defined mean and clipping sigma were applied to the data. The aggressive, 2.5 filtering was applied since the soft counts included from the flares can influence the spectral fitting of low count, spatially extended, soft energy emission of the diffuse gas. When working with the point sources a 3.5 rejection was applied since the hard and spatially isolated spectrum of the point sources is less affected by the flares.
We applied a correction to adjust for the gain changes related to charge transfer inefficiencies that produce a drift in the PI channels, or effectively a drift in energy or wavelength. Starting with CALDB 2.26, the spectral response-table also corrects for the low-energy absorption, thought to be occurring from the out-gassing of unknown materials in the spacecraft and the subsequent condensation on the blocking filters (e.g. Markevitch et al. (2003)). Previously, this low energy degradation was corrected with the ACISABS model333http://cxc.harvard.edu/contsoft/software/ACISABS.1.1.html and our tests confirm that both these corrections produce similar and acceptable results for low energy work.
In order to have an independent gauge of the background, the calibration
team’s blank sky observations (acis7sD1999-09-16bkgrndN0001.fits for
-110 data and
acis7sD2000-12-01bkgrndN0002.fits for -120 data) were
employed. For greater consistency, these observations were reprocessed
with calibrations consistent with the processing described above.
In each of the galaxy observations, the peak energy distribution
of the diffuse gas was determined and used to generate a mono-energetic
exposure map.
Sources were detected using the “Mexican-Hat” wavelet detection routine Wavdetect in a 0.3-6.0 keV bandpass, chosen to minimize the background. The threshold was set to give approximately one false detection per image and PSF scales were run from in 8 steps, allowing for a range of extended sources to be detected. All of the sources were extracted from the image with annular background regions of a few pixels around each source, creating a local background and eliminating any underlying diffuse count contamination. Count weighted response matrices were calculated for the sources as a group. The combined source spectrum was adaptively rebinned to contain a minimum of 25 counts per bin for reduced statistical errors in subsequent analysis. Both the central source in the galaxies, frequently an AGN, and the likely background AGN () (Irwin, Bregman, & Athey, 2004), were separated from the rest of the sources, leaving a spectrum dominated by LMXBs.
4 Spectral Analysis
The spectral analysis is performed with the goal of obtaining maximum comparative information between the galaxies. The challenge is to extract the maximum amount of information from the photon-rich, bright galaxies where total counts can be as high as in an exposure while at the same time obtaining comparative results from the photon-starved, faint galaxies where the diffuse gas counts can be less than 500. The developed analysis procedure constructs a framework of common methods where the quality of the data determine both the amount of information extracted and the aggressiveness of the removal of higher-order undesired signal. In this manner we create a sample as uniform as possible given the large dynamic range presented in the data.
4.1 Backgrounds and Region Definitions
With the sources identified, the diffuse counts can be isolated and extracted from the image into annular bins. Three different background determinations were employed: 1) An outer region on the chip where the diffuse counts visually appeared to fall into the background, 2) Equal region descriptions in the source chip and the blank sky observations, and 3) A local background subtraction, described below.
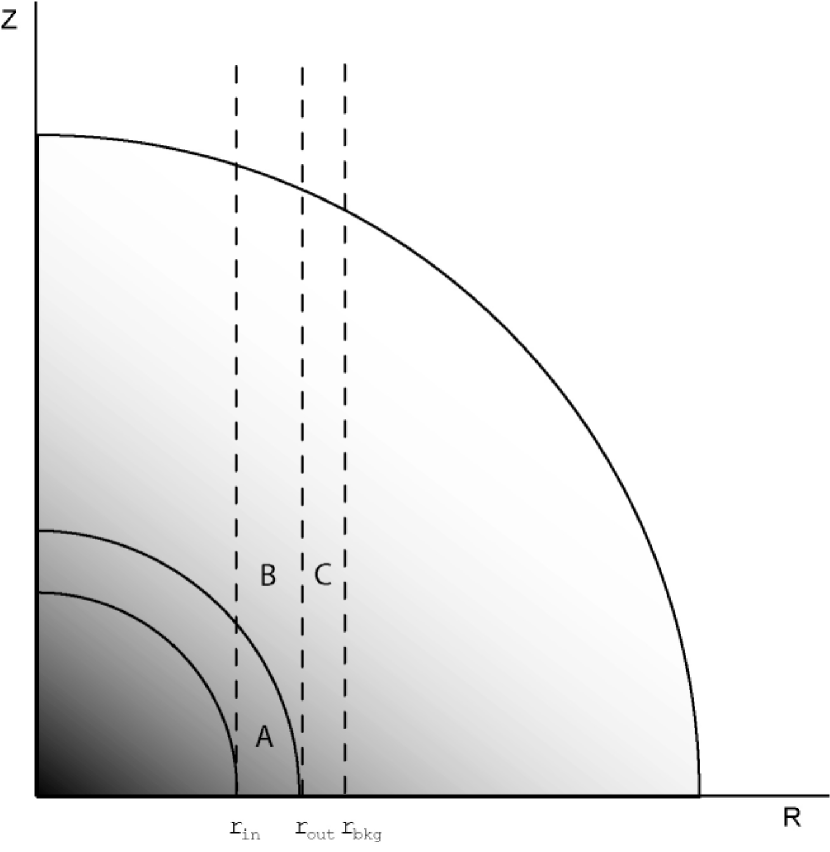
The local background subtraction method is designed to be a simple background subtraction that attempts to recover more of the true 3-dimensional radial properties than the traditional 2-dimensional column probing, while avoiding some of the complications of 3-dimensional deprojection methods. A schematic picture of this method is pictured in Figure 1. In an annular column probe through a galaxy, emission is seen from both the thin annular shell of interest and emission from regions outside of that shell. If the emission is spherically symmetric and changes predictably with radius, it is possible to subtract an adjacent column of emission that approximates the excess emission observed in the source region.
In practice, we fit a -model to the surface brightness profile, SB, of the galaxy,
| (1) |
and use this determination for a description of the emission measure, EM,
| (2) |
where is the core radius and characterizes the power-law decay (cf. Sarazin & Bahcall (1977)). Once we have a parametrization of the emission measure, we solve for the background radius, , by equating the two area integrals depicted in Figure 1:
| (3) |
and area C,
| (4) |
where is the extent of the galaxy emission, the annular area of interest is from to with a background from to .
With the background methods defined, a set of annuli were extracted for each galaxy. We choose to bin the data radially into roughly equal signal-to-noise bins after background subtraction, allowing for a fair comparison of the statistics in each bin. Because of the demanding number of parameters in the spectral fitting, we determined five thousand count bins to provide the best balance between radial sampling and statistical population of the relevant energies for temperature profiles. For metallicity determinations, we require ten thousand count bins. In observations with fewer than five thousand counts, we took a single annular bin with a size based upon a visual inspection of the extent of the emission.
Once the regions were defined, the pulse invariant spectra were extracted from the specified regions with the point sources removed. The response and effective area matrices were created for each bin using the extended emission tools mkrmf and mkarf within CIAO. Each of the source spectra were adaptively regrouped to have a minimum of 25 counts per channel for improved statistics.
4.2 Plasma Model and Spectral Fitting Technique
For the spectral modeling, which historically produces inconsistent results when not considered carefully, we build upon our previous work with Chandra, taking extensive measures defining the models and fitting routines, and perform multiple cross-checks and calibrations to confirm our methodology. The spectral models were defined and analyses performed with the goal of obtaining comparative metallicity and temperature information between the individual galaxies.
Since the hard, unresolved LMXB component acts as an underlying background to the high energy lines of sulfur, silicon, and magnesium, an accurate determination of the power-law spectral slope is critical for reliable metallicity measurements. In a subset of fifteen galaxies of this sample, we have shown that there appears to be a universal nature to the spectral properties of early-type galaxy LMXBs that spans three orders of magnitude in X-ray luminosity (Irwin, Athey, & Bregman, 2003). The errors of the determined power-law slope of represents an order of magnitude reduction in the uncertainties from previous studies and allows the underlying, unresolved LMXB component in our composite spectral modeling to be fit with a high degree of confidence.
It has been discovered that the lower energies, below 1.0 keV, are undergoing a continually increasing absorption, generally agreed to be caused from out-gassing of unknown materials in the Chandra spacecraft and subsequent condensation on the blocking filters (e.g. Markevitch et al. (2003)). Of particular interest to this study is the oxygen abundance, obtained through the [O VII] and [O VIII] lines at 0.57 keV and 0.7 keV. Although there is a standard correction for this absorption included in CIAO, the effectiveness of this correction has yet to be fully evaluated.
In order to determine the effectiveness of the absorption correction, we examined the results of this model when performed on the point sources in galaxies that contained more than 75 detected sources in an observation. Using the sources has the advantage that the data are contained within the same dataset as the diffuse emission and have a much simpler spectral signature of a power-law, with excellent constraints placed on the slope, as discussed above. In addition to providing information on the corrected quantum efficiency degradation, this also allowed us to investigate the well calibrated range of Chandra and the agreement with the literature reported galactic column density (Dickey & Lockman, 1990). As previously mentioned, we removed likely background AGN, sources with , and the central source, which can be an AGN with different spectral characteristics. From 0.35 keV to 1.0 keV, residuals less than the Poisson noise were observed (typically with errors less than 15% about the model fit). From 0.284 keV to the carbon edge at 0.35 keV, the residuals are noticeably large and systematic.
The Galactic absorption is somewhat degenerate with the blocking filter absorption as both act to suppress low energy counts. In addition, the Galactic absorption has influence on the oxygen abundance determination as this line is well-blended with the iron-L complex and an increase in the Galactic column density can effectively swamp any signal from the oxygen lines while leaving the iron abundance unchanged. In order to minimize the susceptibility of this parameter on oxygen abundances (note that this parameter has very little impact on the abundances of the other metals), we decided to fix the Galactic absorption in all radial bins. By employing this constraint, the plasma modeling of the hot gas will preserve relative differences, while leaving open the possibility of an absolute correction. We determined this correction to be at most a 30% correction in oxygen abundance from a 50% uncertainty in galactic hydrogen density. For two galaxies, NGC 720 and NGC 1316, there were large systematic residuals in the low energy when the standard Galactic column density was applied and we refit the Galactic column density to values and , respectively, with successful results.
Based on the point source observations, in addition to tests with the diffuse gas, we determine the energies from 0.35 keV to 8.0 keV to be well calibrated. This energy range is employed in all subsequent spectral analyses. By extending the spectral fitting down to 0.35 keV, we find that the temperature-iron metallicity degeneracy is somewhat relieved and the plasma models can discriminate between subtle changes in iron abundances for a fixed temperature.
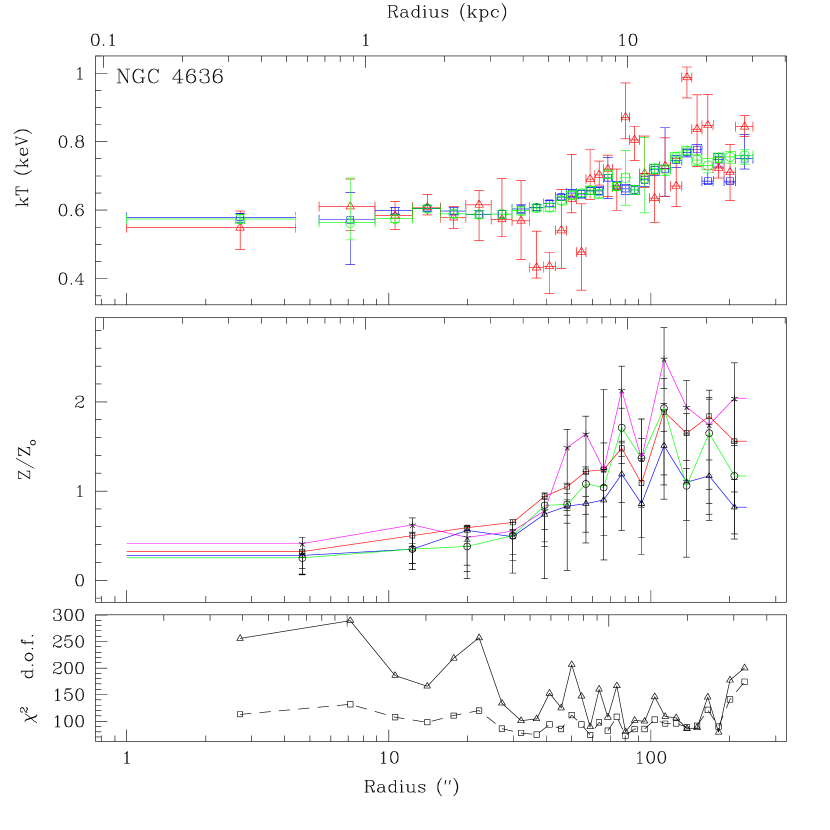
There is substantial evidence indicating that solar metallicity ratios are not physically representative in early-type galaxies. In addition to statistically unacceptable fits with common scaling of solar ratios for all metals, the XMM-Newton RGS spectra of the central region of NGC 4636 and NGC 5044 indisputably reveal different metallicities for oxygen, iron, magnesium, neon and nitrogen relative to solar (Xu et al., 2002; Tamura et al., 2003). Also important to the study of elliptical galaxies, there is no evidence for multiple temperatures within the central few arcminutes in these RGS spectra.
Motivated by these high quality spectral observations, the diffuse gas was modeled as plasma represented by the APEC model (Smith et al., 2001) in which each of the individual elements is allowed to vary (“vapec” in XSpec). (We note that the MEKAL model produced similar results.) Of particular concern was fixing as many of the quantities in the models as can be scientifically justified, to constrain the solution, where abundances can behave unpredictably and non-physically when too many parameters are allowed to vary. The bright galaxies were examined and each of the metals in the plasma code were probed to determine which had negligible impact upon the solution. If changing a metal content from 0.1 to five times solar changed the merit of the fit insignificantly, then the metal’s abundance was fixed to the iron abundance, the best determined abundance in low temperature plasmas. Some of the metals, such as nickel, neon, and sulfur, had an impact upon the fitting, but did not return realistic and consistent physical values as judged by the consistency seen in the radial variations of these quantities. The sulfur line is weak and there is insufficient spectral resolution to isolate the nickel and neon lines from the iron-L complex. These metals are allowed to vary in the modeling, but we do not report the results.
It is not possible to fit the faint galaxies with a variable abundance model. For galaxies with less than gas counts, we employ the observed consistent metal ratios in the bright galaxies (see Section 5.1) to extend the metallicity determinations to the faint galaxies. The average metal ratios relative to solar are locked from the median of the bright galaxies creating a single parameter abundance for fitting.
To allow for gain shifts, we permitted the redshift to vary for all the radial bins in a preliminary fit, and a common, average redshift was frozen for all subsequent modeling. This offset in the recessional velocity significantly improves the residuals around the relatively well isolated Si and Mg lines. The reason for selecting a common gain shift for all the radial bin, instead of allowing this parameter to be fit in each bin, is that the relative consistency of the fitting from bin to bin is improved with a common value.
5 Spectral Results
A division is made between the data presentation (this Section) and a discussion of their implications (forthcoming publications), due to the extensive nature of spatial and spectral fitting of 54 galaxies in multiple radial bins. All subsequent errors reported are one-sigma (68%) unless otherwise stated. A Hubble Constant of is used throughout (Freedman et al., 2001; Bennett et al., 2003). Note that this choice of Hubble constant is consistent with the employed distance determinations from surface brightness fluctuations (Table 2; Tonry et al. (2001)). In the reporting of the metallicities, we conform to the X-ray standard of using the solar abundances taken from the photospheric measurements reported in Anders & Grevesse (1989). These numbers are immediately comparable to output from the defaults set in X-ray spectral fitting programs, XSpec and Sherpa.
5.1 Radial Spectral Properties
The results from the spectral fitting of the radial bins are presented in Tables 4 - 6. Many of the faint galaxies only have one radial bin. Table 4 is based on the nominally 5000 counts per bin regions while the galaxy mass and luminosity information, in Tables 5, and 6, as well as metallicity information presented in Table 7 and 8, are based on 10,000 counts per bin regions.
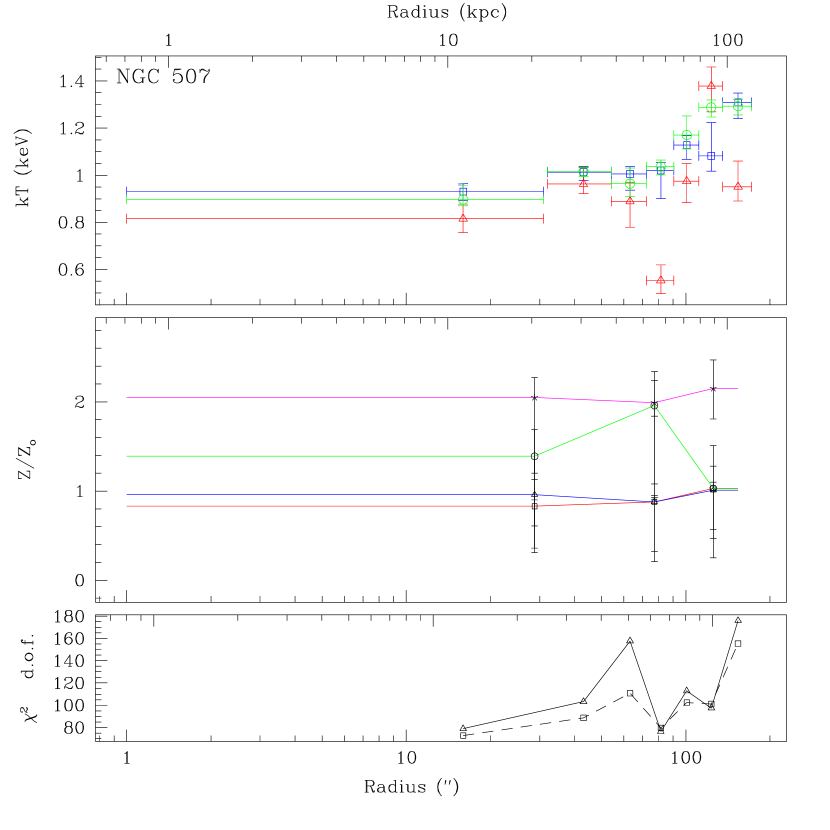
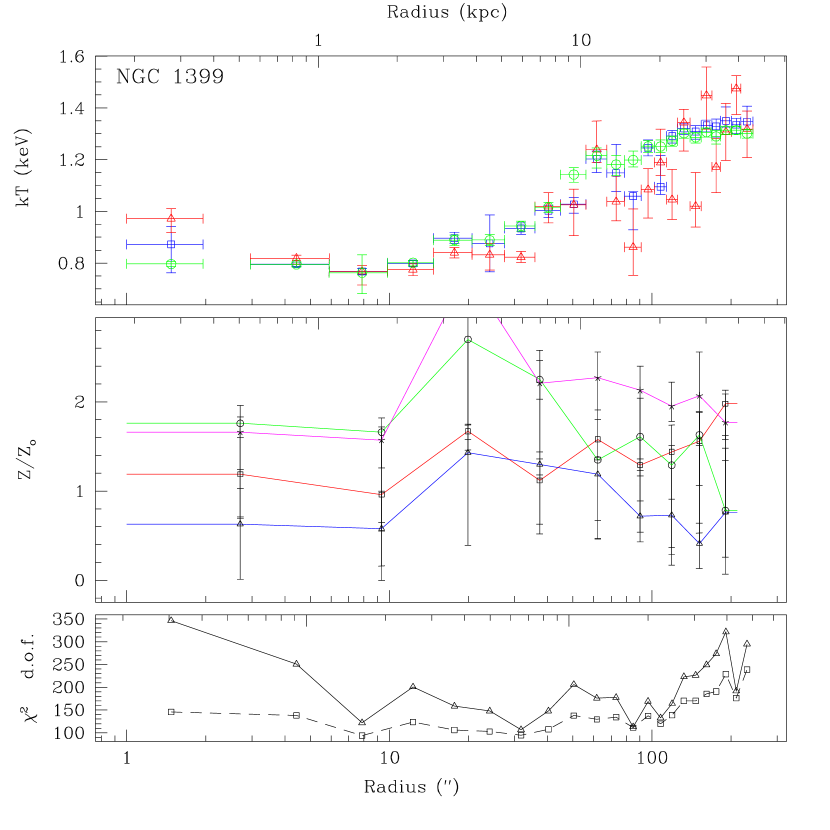
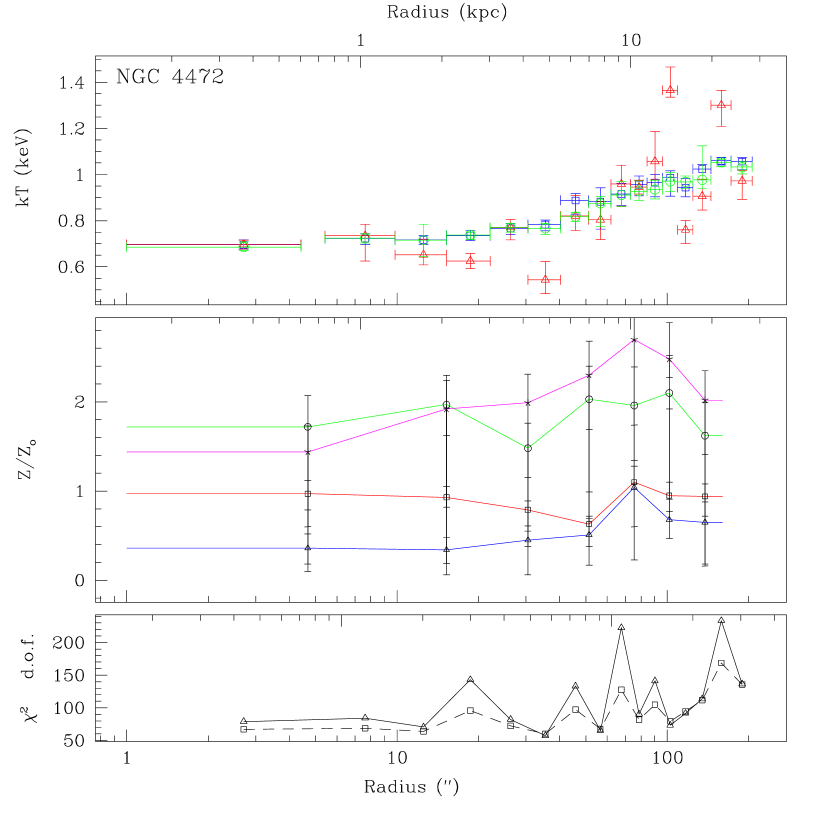
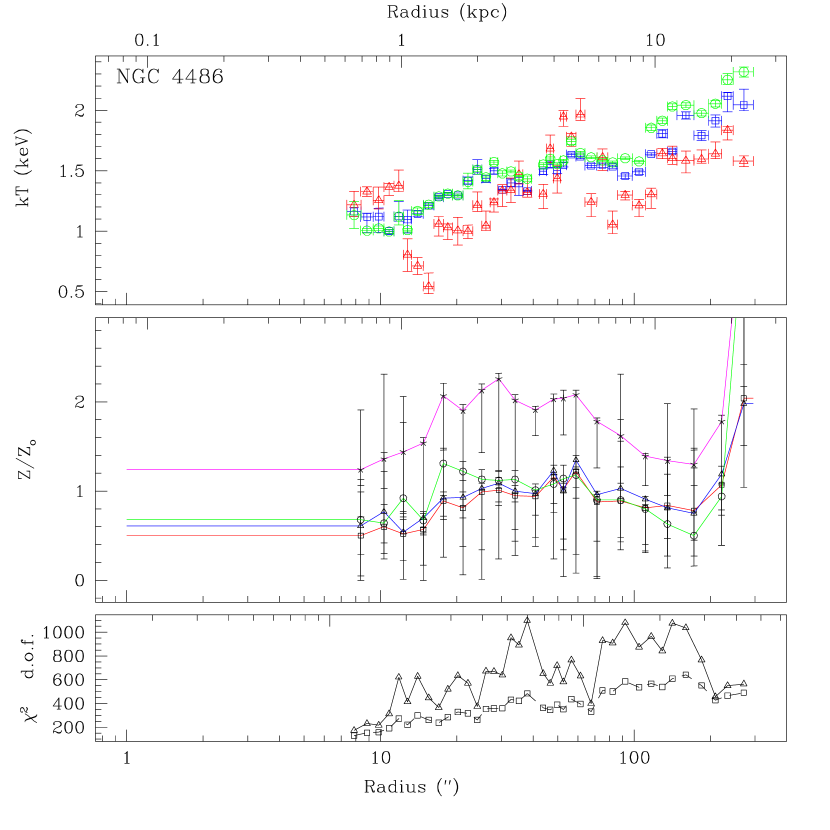
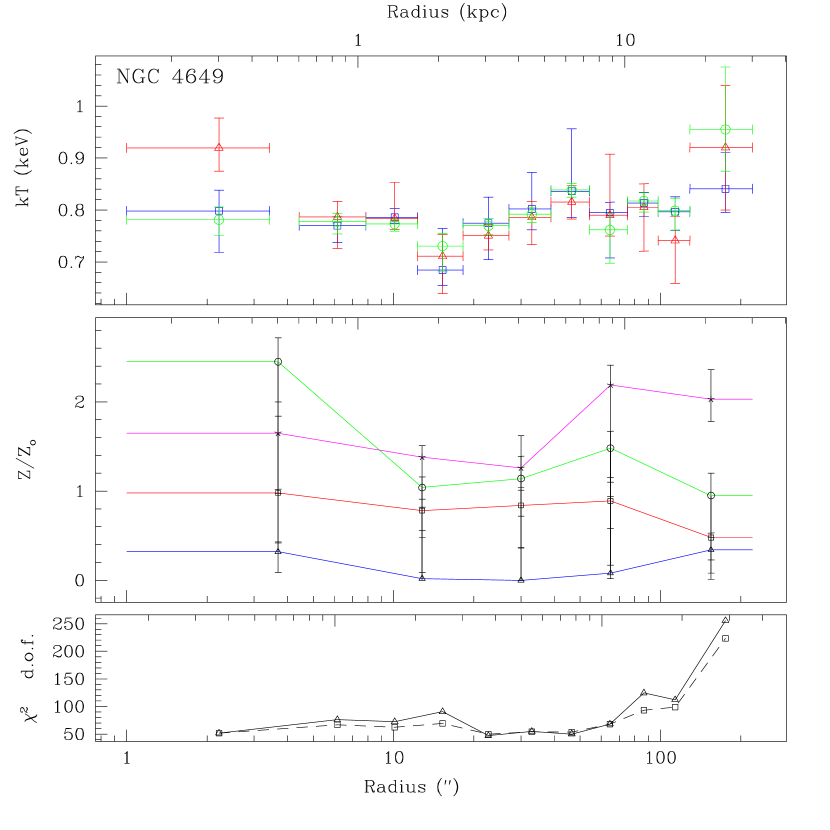
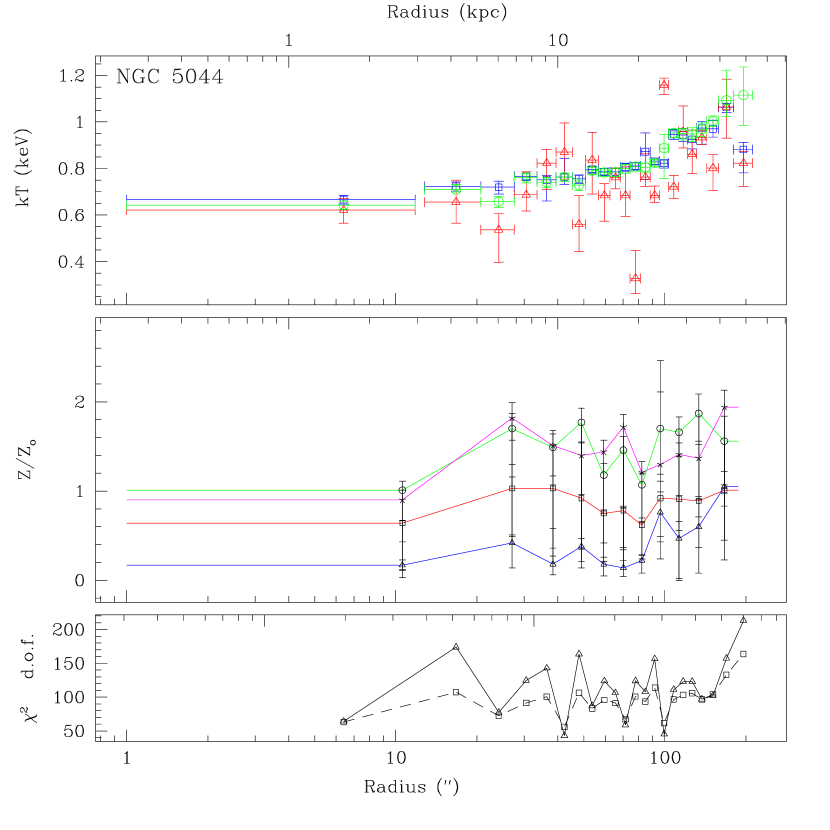
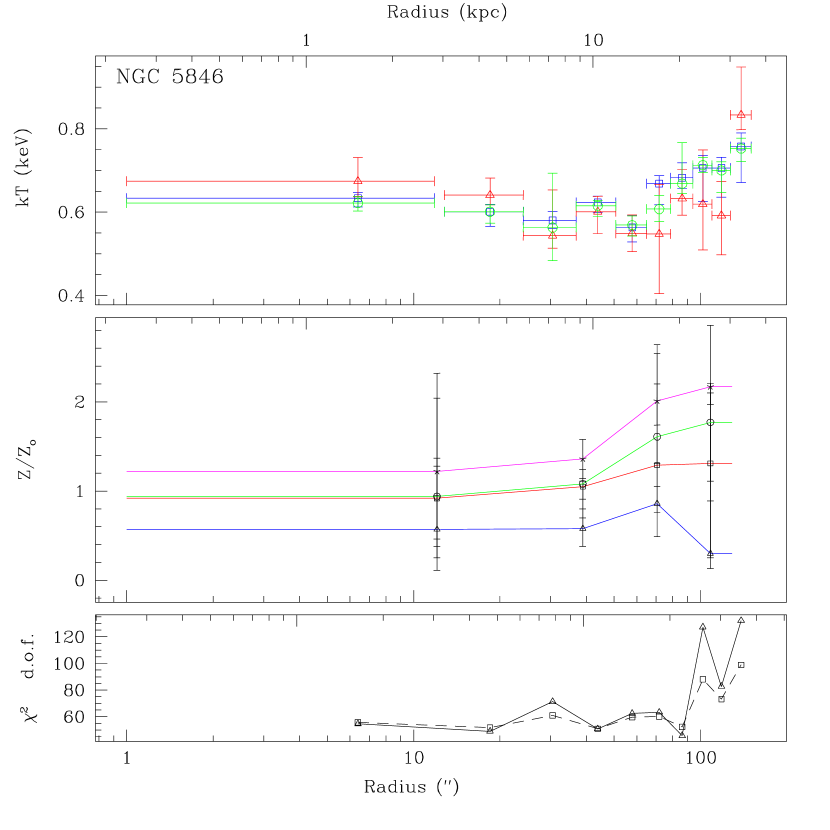
Table 4 presents radial temperature determinations and 1 errors for each of the three backgrounds defined in Section 4.1. Galaxies with three or more radial bins are also presented graphically in Figures 6 - 13.
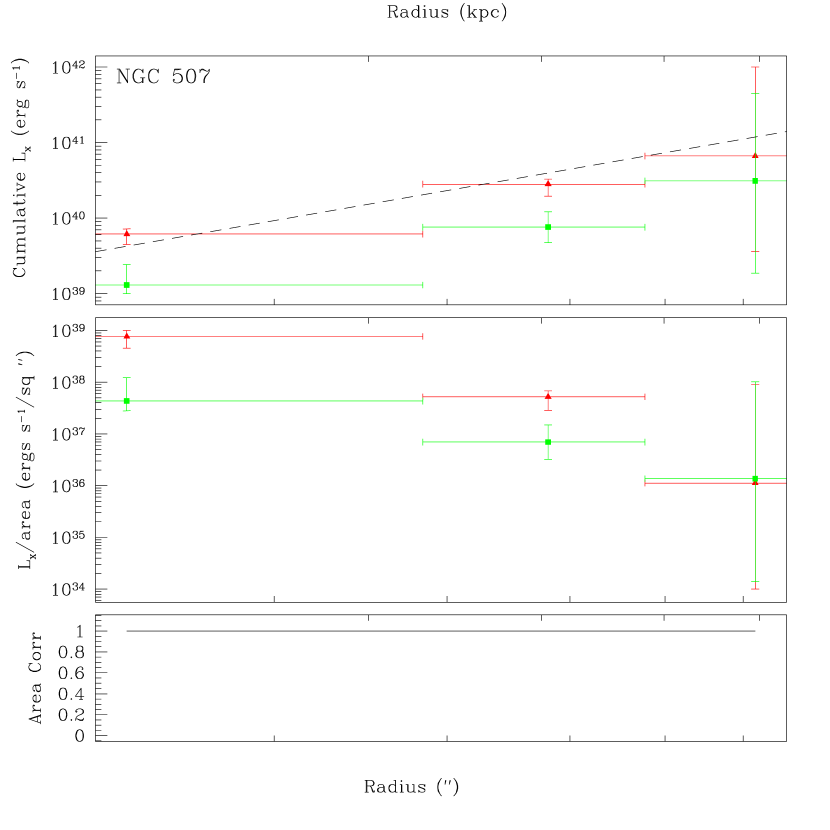
Table 5 presents radial density, entropy, cumulative mass and the fraction of area sampled by the S3 chip for the prescribed annular bin. The data in this table are from spectral fitting with an outer sky background. Using a blank background region produced similar results. Galaxies with three or more radial bins are also presented graphically in Figures 14 - 21.
Table 7 presents individual elemental abundances for oxygen, iron, silicon and magnesium in radial bins for bright galaxies. Galaxies with three or more temperature radial bins are also presented graphically in the middle panel of Figures 6 - 13.
Histograms of the metal content in the high signal-to-noise galaxy observations are shown in Figures 2 and 3. Although there is a fairly large range of iron abundances observed, the ratios of iron to the other independently determined elements of silicon, oxygen and magnesium are narrowly distributed. This observation indicates that early-type galaxies have common enrichment histories, and, further, the non-unity values of these ratios reveals that this ISM enrichment process is different than that which contributed to production of the solar metal content. These ratios can be understood as a gas that has had its enrichment dominated by SN Ia’s.
Employing these results, we fit the low signal-to-noise early-type galaxy observations with a single abundance, but requiring abundance ratios of , , , and all other elements equal in abundance to iron. The results from the metallicity fitting of the low signal-to-noise subsample are presented in Table 8 as an iron abundance when the metals are tied together as prescribed above.
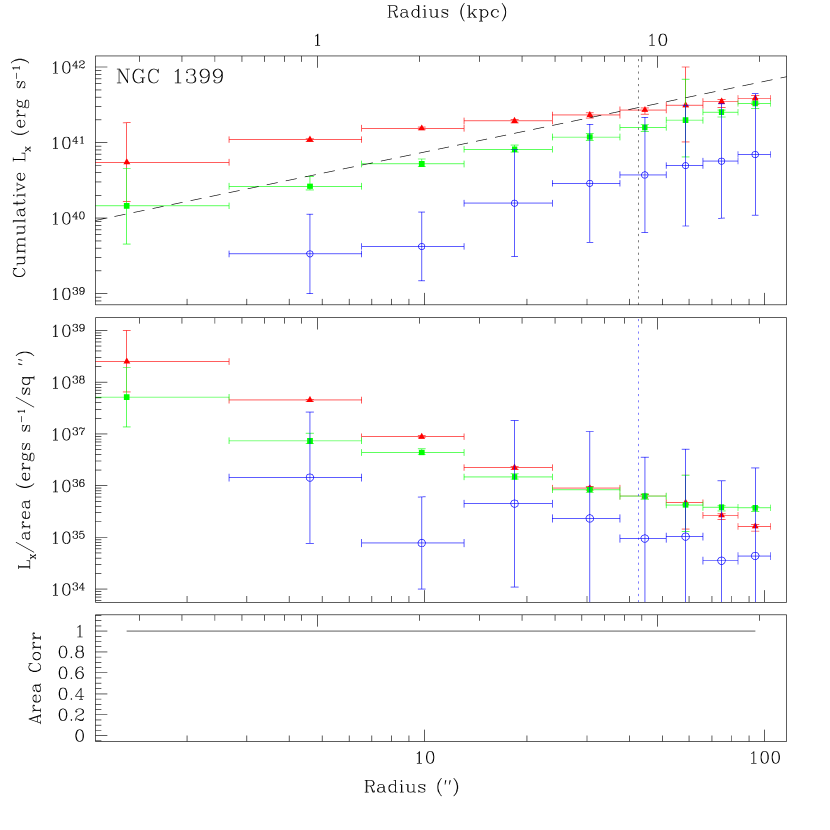
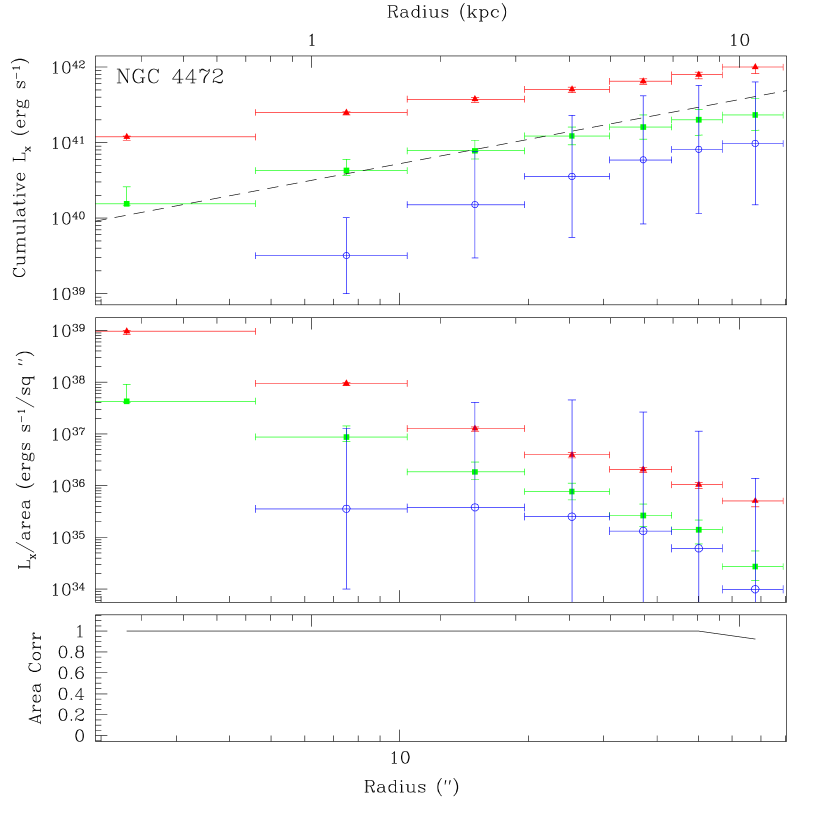
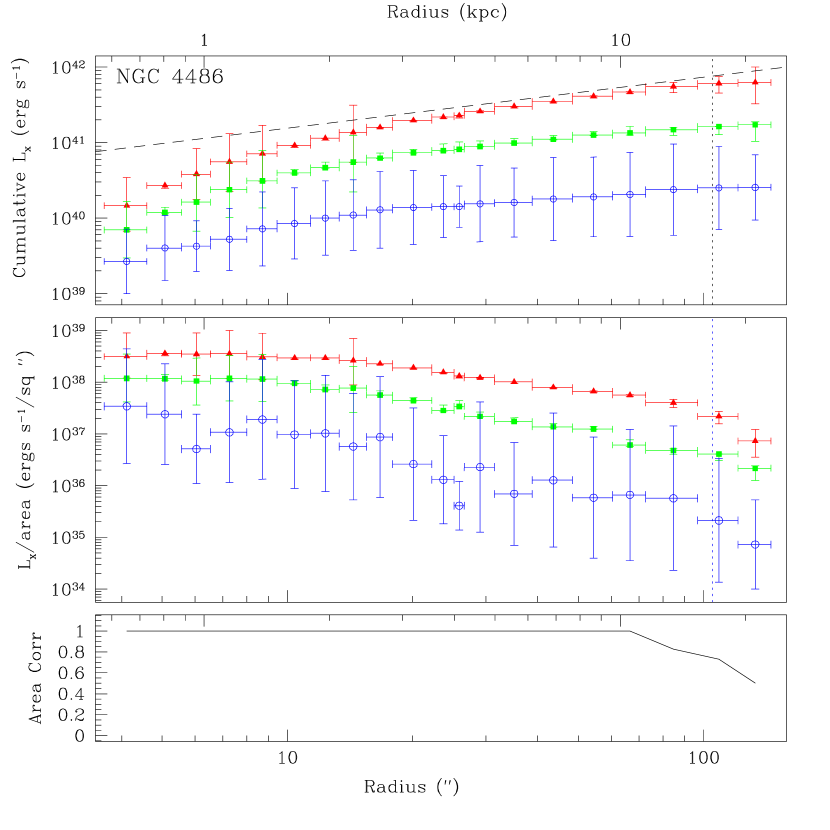
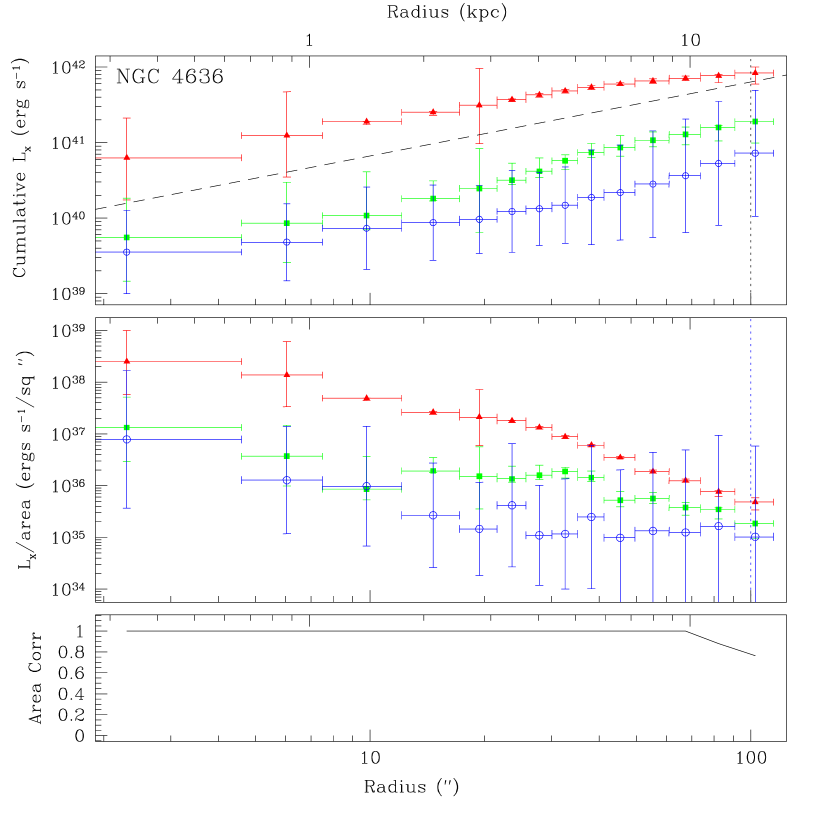
The unresolved binary component, compensates for different background levels and thus significant differences are observed in this component between the blank sky subtractions and outer region background. The gas and resolved source luminosities are largely unaffected. It is not entirely clear which background is more representative for a given galaxy and will depend on physical conditions of the local galaxy environment and location in the sky. It is likely that in NGC 1399, when the blank sky subtraction is used the component is tracing not only the unresolved LMXBs but also the underlying hot ICM can be seen in the outer bins. However, subtracting an outer region from a galaxy that fills the S3 chip, such as NGC 4472, over estimates the background since the background region is contaminated with galaxy emission. Further complicating matters, Markevitch et al. (2003), in study of the sky positional dependence of the soft X-ray background, find significantly different emission levels for the background in addition to differences in the spectra shapes of the background. These observations suggest that the background should be taken locally if possible.
The background choice for bright galaxies defines the selection of the physical components analyzed in the spectral analysis; With a blank sky background the ICM, ISM and unresolved LMXB components are selected while an outer region background selects the ISM and and unresolved LMXB with perhaps a slight over estimation of the background. Since the galactic emission is our primary interest, we use an outer region background for the global property studies (Section 5.2). We report the luminosity determinations for an outer region subtraction, but caution on the accuracy of the unresolved component for bright galaxies. For faint galaxies, the outer region background is heavily preferred to the blank sky subtracted results since the background region is observed through the same Galactic column density.
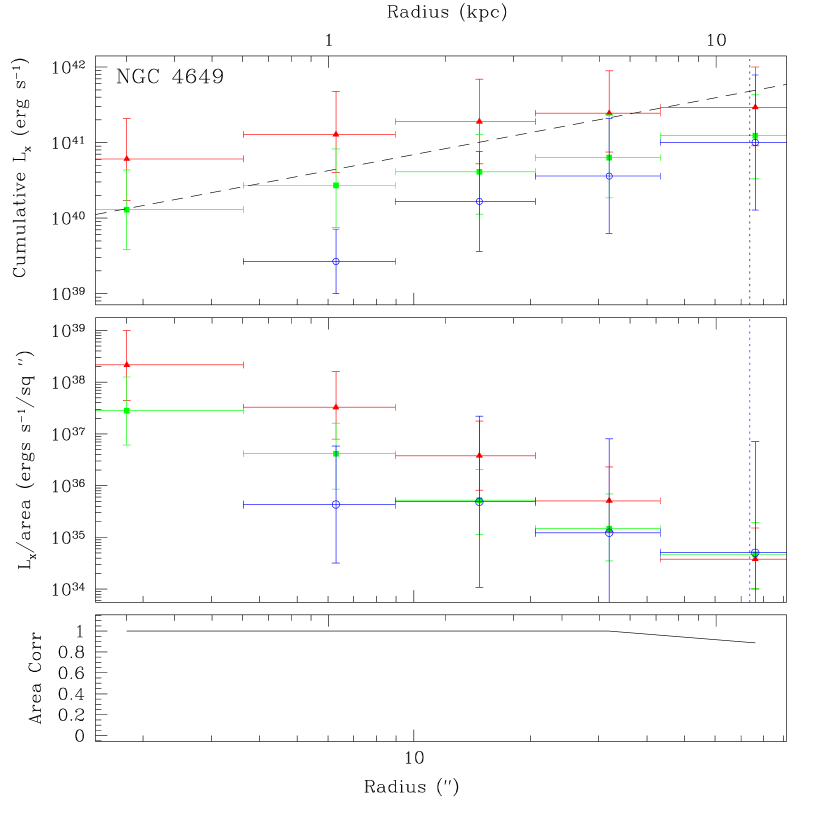
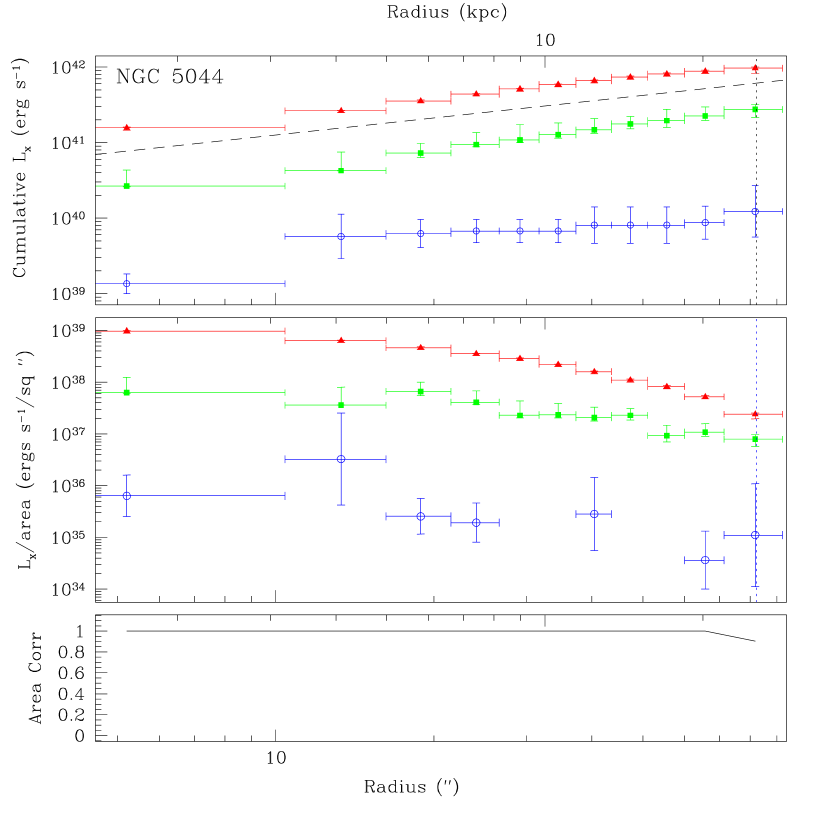
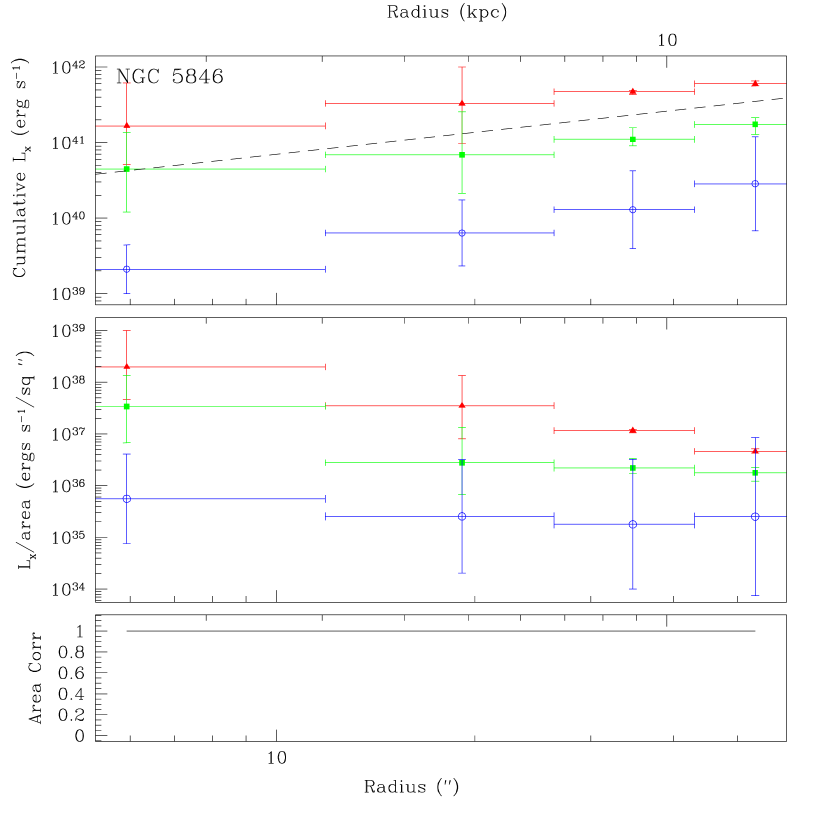
Cumulative gas luminosities as well as luminosities per area are presented in Table 6. Also presented are the unresolved LMXB and resolved LMXB components. In this table an outer, on-chip region is used as a background.
5.2 Cumulative Galaxy Properties
6 Comparison with ROSAT
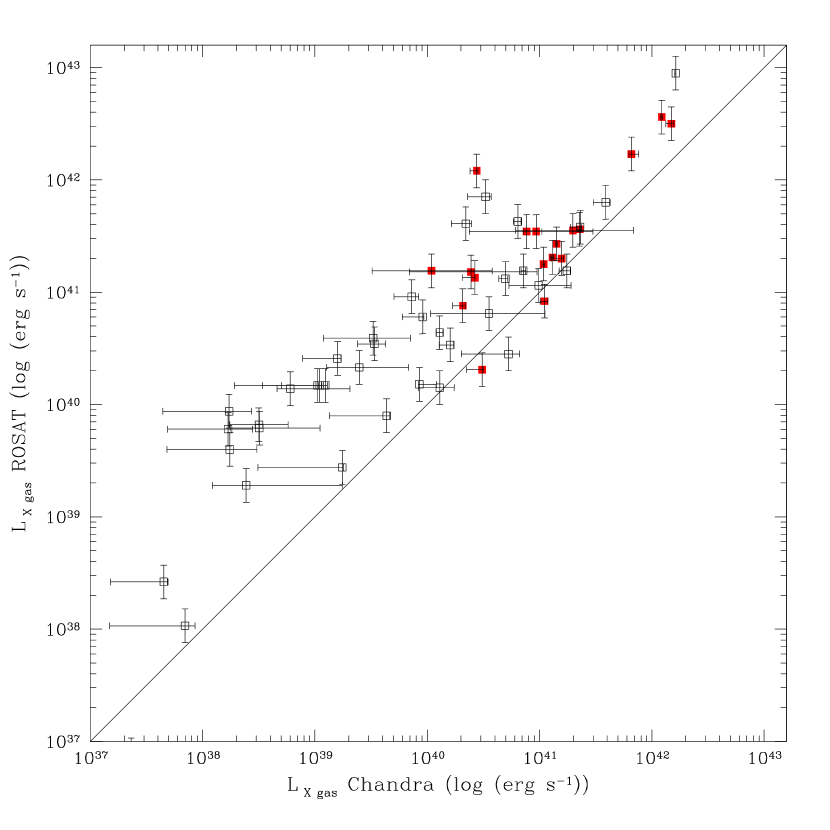
The gas luminosities detected with Chandra are compared to luminosities determined with ROSAT in order to check calibrations and to look for systematic residuals. We expect X-ray bright galaxies to be systematically fainter with Chandra ACIS-S3 observations as the limited field of view precludes total luminosities from being measured. For X-ray faint galaxies, the Chandra data will better isolate the LMXB contribution and it is expected that the Chandra gas luminosities will be lower than the ROSAT ones.
In Figure 4, ROSAT gas luminosities are plotted against the one effective radius gas luminosities reported in Table 9. The Chandra luminosities are systematically under-luminous due to different scaling radii (typically, ROSAT luminosities are scaled to ). The effect of these different scaling radii produce a vertical offset. Once this offset is applied, the agreement is reasonable as can be seen by the solid line representing a 1:1 relationship. At the X-ray faint end, the ROSAT luminosities are systematically brighter than Chandra luminosities due to the under-subtraction of LMXBs. Some of the scatter in this plot is caused by different distances being employed; although we have corrected for differences in Hubble constants, the majority of our distances are derived from surface brightness fluctuations while the majority of ROSAT luminosities were derived distances from radial velocity measurements. Finally, the ROSAT luminosities are not a truly uniform sample as they have been taken from different authors employing different processing techniques, spectral modeling and distance determinations. Given all these factors, the level of scatter in this comparison is acceptable and, further, we conclude that our data analysis and the current state of Chandra calibrations satisfactorily produce luminosities consistent with previous X-ray missions.
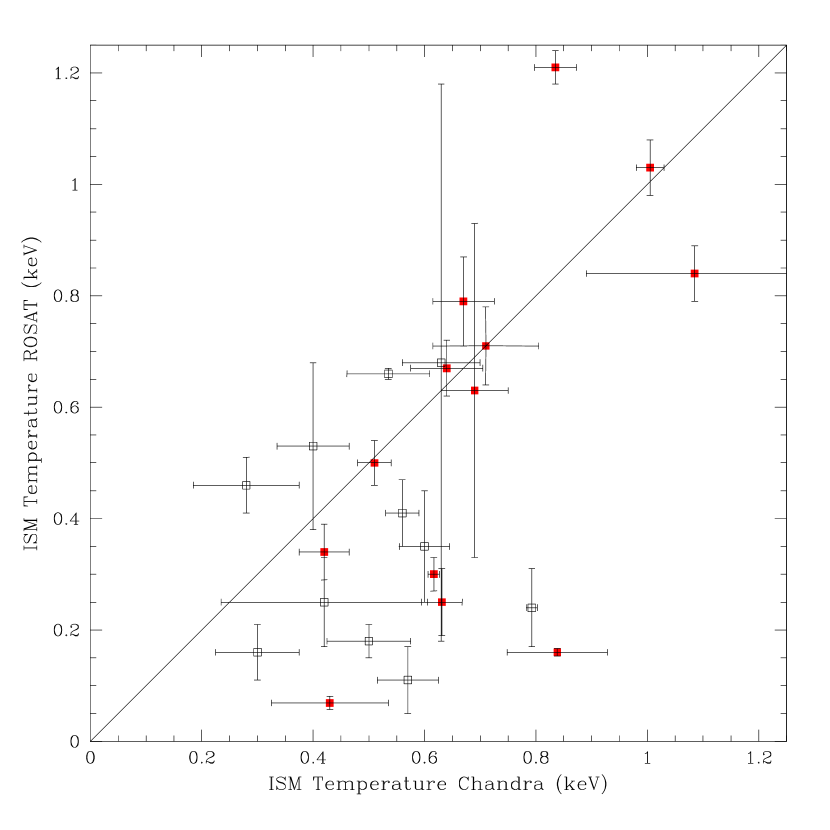
ROSAT gas temperatures are plotted against the Chandra temperatures (Figure 5). Not surprisingly, the agreement between the two measurements is poor. This illustrates the difficulty in determining accurate plasma temperatures when the LMXBs and central AGN cannot be removed. If the brightest group galaxies are selected (the filled symbols) a linear relation can determined, although it is not one-to-one. These brightest group galaxies typically have much more hot gas than LMXBs and thus the contaminations from point-sources is minimized in the ROSAT determinations.
7 Summary
We present spectral results from uniformly processed and analyzed Chandra ACIS-S3 observations of 54 nearby galaxies. This sample paves the way for complete sample studies and provides a solid basis for planning future early-type galaxy observations. In the forthcoming papers we will explore some of the implications of this archival study.
References
- Anders & Grevesse (1989) Anders, E. & Grevesse, N. 1989, Geochim. Cosmochim. Acta, 53, 197
- Bennett et al. (2003) Bennett, C. L., Halpern, M., Hinshaw, G., Jarosik, N., Kogut, A., Limon, M., Meyer, S. S., Page, L., Spergel, D. N., Tucker, G. S., Wollack, E., Wright, E. L., Barnes, C., Greason, M. R., Hill, R. S., Komatsu, E., Nolta, M. R., Odegard, N., Peiris, H. V., Verde, L., & Weiland, J. L. 2003, ApJS, 148, 1
- Beuing et al. (1999) Beuing, J., Dobereiner, S., Bohringer, H., & Bender, R. 1999, MNRAS, 302, 209
- Bregman et al. (1995) Bregman, J. N., Hogg, D. E., & Roberts, M. S. 1995, ApJ, 441, 561
- Bregman et al. (2001) Bregman, J. N., Miller, E. D., & Irwin, J. A. 2001, ApJ, 553, L125
- Brown & Bregman (1998) Brown, B. A. & Bregman, J. N. 1998, ApJ, 495, L75
- Buote (1999) Buote, D. A. 1999, MNRAS, 309, 685
- Buote & Fabian (1998) Buote, D. A. & Fabian, A. C. 1998, MNRAS, 296, 977
- Burstein et al. (1987) Burstein, D., Davies, R. L., Dressler, A., Faber, S. M., Stone, R. P. S., Lynden-Bell, D., Terlevich, R. J., & Wegner, G. 1987, ApJS, 64, 601
- Canizares et al. (1987) Canizares, C. R., Fabbiano, G., & Trinchieri, G. 1987, ApJ, 312, 503
- Capaccioli et al. (1987) Capaccioli, M., Held, E. V., & Nieto, J. 1987, AJ, 94, 1519
- Colbert et al. (2001) Colbert, J. W., Mulchaey, J. S., & Zabludoff, A. I. 2001, AJ, 121, 808
- Davis & White (1996) Davis, D. S. & White, R. E. 1996, ApJ, 470, L35
- de Vaucouleurs et al. (1991) de Vaucouleurs, G., de Vaucouleurs, A., Corwin, H. G., Buta, R. J., Paturel, G., & Fouque, P. 1991, Third Reference Catalogue of Bright Galaxies (Volume 1-3, XII, 2069 pp. 7 figs.. Springer-Verlag Berlin Heidelberg New York)
- Dickey & Lockman (1990) Dickey, J. M. & Lockman, F. J. 1990, ARA&A, 28, 215
- Faber et al. (1989) Faber, S. M., Wegner, G., Burstein, D., Davies, R. L., Dressler, A., Lynden-Bell, D., & Terlevich, R. J. 1989, ApJS, 69, 763
- Forman et al. (1985) Forman, W., Jones, C., & Tucker, W. 1985, ApJ, 293, 102
- Forman et al. (1979) Forman, W., Schwarz, J., Jones, C., Liller, W., & Fabian, A. C. 1979, ApJ, 234, L27
- Franx et al. (1989) Franx, M., Illingworth, G., & Heckman, T. 1989, AJ, 98, 538
- Freedman et al. (2001) Freedman, W. L., Madore, B. F., Gibson, B. K., Ferrarese, L., Kelson, D. D., Sakai, S., Mould, J. R., Kennicutt, R. C., Ford, H. C., Graham, J. A., Huchra, J. P., Hughes, S. M. G., Illingworth, G. D., Macri, L. M., & Stetson, P. B. 2001, ApJ, 553, 47
- Gibson et al. (2000) Gibson, B. K., Stetson, P. B., Freedman, W. L., Mould, J. R., Kennicutt, R. C., Huchra, J. P., Sakai, S., Graham, J. A., Fassett, C. I., Kelson, D. D., Ferrarese, L., Hughes, S. M. G., Illingworth, G. D., Macri, L. M., Madore, B. F., Sebo, K. M., & Silbermann, N. A. 2000, ApJ, 529, 723
- Goudfrooij et al. (1994a) Goudfrooij, P., Hansen, L., Jorgensen, H. E., & Norgaard-Nielsen, H. U. 1994a, A&AS, 105, 341
- Goudfrooij et al. (1994b) Goudfrooij, P., Hansen, L., Jorgensen, H. E., Norgaard-Nielsen, H. U., de Jong, T., & van den Hoek, L. B. 1994b, A&AS, 104, 179
- Helsdon et al. (2001) Helsdon, S. F., Ponman, T. J., O’Sullivan, E., & Forbes, D. A. 2001, MNRAS, 325, 693
- Irwin et al. (2003) Irwin, J. A., Athey, A. E., & Bregman, J. N. 2003, ApJ, 587, 356
- Irwin et al. (2004) Irwin, J. A., Bregman, J. N., & Athey, A. E. 2004, ApJ, 601, L143
- Irwin & Sarazin (1998) Irwin, J. A. & Sarazin, C. L. 1998, ApJ, 499, 650
- Jorgensen et al. (1995) Jorgensen, I., Franx, M., & Kjaergaard, P. 1995, MNRAS, 273, 1097
- Macchetto et al. (1996) Macchetto, F., Pastoriza, M., Caon, N., Sparks, W. B., Giavalisco, M., Bender, R., & Capaccioli, M. 1996, A&AS, 120, 463
- Markevitch (2002) Markevitch, M. 2002, astro-ph/0205333
- Markevitch et al. (2003) Markevitch, M., Bautz, M. W., Biller, B., Butt, Y., Edgar, R., Gaetz, T., Garmire, G., Grant, C. E., Green, P., Juda, M., Plucinsky, P. P., Schwartz, D., Smith, R., Vikhlinin, A., Virani, S., Wargelin, B. J., & Wolk, S. 2003, ApJ, 583, 70
- Matsushita (2001) Matsushita, K. 2001, ApJ, 547, 693
- Matsushita et al. (1997) Matsushita, K., Makishima, K., Rokutanda, E., Yamasaki, N. Y., & Ohashi, T. 1997, ApJ, 488, L125
- Matsushita et al. (2000) Matsushita, K., Ohashi, T., & Makishima, K. 2000, PASJ, 52, 685
- Mei et al. (2000) Mei, S., Silva, D., & Quinn, P. J. 2000, A&A, 361, 68
- Mulchaey & Zabludoff (1999) Mulchaey, J. S. & Zabludoff, A. I. 1999, ApJ, 514, 133
- Mushotzky et al. (1994) Mushotzky, R. F., Loewenstein, M., Awaki, H., Makishima, K., Matsushita, K., & Matsumoto, H. 1994, ApJ, 436, L79
- O’Sullivan et al. (2001) O’Sullivan, E., Forbes, D. A., & Ponman, T. J. 2001, MNRAS, 328, 461
- O’Sullivan et al. (2003) O’Sullivan, E., Ponman, T. J., & Collins, R. S. 2003, MNRAS, 340, 1375
- Peletier et al. (1990) Peletier, R. F., Davies, R. L., Illingworth, G. D., Davis, L. E., & Cawson, M. 1990, AJ, 100, 1091
- Ryden et al. (2001) Ryden, B. S., Forbes, D. A., & Terlevich, A. I. 2001, MNRAS, 326, 1141
- Sarazin & Bahcall (1977) Sarazin, C. L. & Bahcall, J. N. 1977, ApJS, 34, 451
- Smith et al. (2001) Smith, R. K., Brickhouse, N. S., Liedahl, D. A., & Raymond, J. C. 2001, ApJ, 556, L91
- Tamura et al. (2003) Tamura, T., Kaastra, J. S., Makishima, K., & Takahashi, I. 2003, A&A, 399, 497
- Terlevich & Forbes (2002) Terlevich, A. I. & Forbes, D. A. 2002, MNRAS, 330, 547
- Tonry et al. (2001) Tonry, J. L., Dressler, A., Blakeslee, J. P., Ajhar, E. A., Fletcher, A. B., Luppino, G. A., Metzger, M. R., & Moore, C. B. 2001, ApJ, 546, 681
- Toomre (1977) Toomre, A. 1977, ARA&A, 15, 437
- Trager et al. (2000a) Trager, S. C., Faber, S. M., Worthey, G., & González, J. J. 2000a, AJ, 120, 165
- Trager et al. (2000b) —. 2000b, AJ, 119, 1645
- Xu et al. (2002) Xu, H., Kahn, S. M., Peterson, J. R., Behar, E., Paerels, F. B. S., Mushotzky, R. F., Jernigan, J. G., Brinkman, A. C., & Makishima, K. 2002, ApJ, 579, 600


| Survey | Telescope & Instrument | |
|---|---|---|
| Forman et al. (1985) | 55 (42) | Einstein IPC & HRI |
| Canizares et al. (1987) | 81 (55) | Einstein IPC & HRI |
| Davis & White (1996) | 30 (30) | ROSAT PSPC & Einstein IPC |
| Brown & Bregman (1998) | 34 (34) | ROSAT PSPC & HRI |
| Irwin & Sarazin (1998) | 61 (55) | ROSAT PSPC |
| Beuing et al. (1999) | 293 (101) | ROSAT All-Sky Survey |
| Matsushita et al. (2000) | 27 (27) | ASCA GIS & SIS |
| Matsushita (2001) | 52 (41) | ROSAT PSPC |
| O’Sullivan et al. (2001) | 401 (183) | ROSAT PSPC, HRI, All-Sky Survey |
| O’Sullivan et al. (2003) | 39 (39) | ROSAT PSPC |
| Galaxy | RAaa Values taken from NED (NASA/IPAC Extragalactic Database). | Decaa Values taken from NED (NASA/IPAC Extragalactic Database). | Distancebb Tonry et al. (2001) unless otherwise noted. | cc Faber et al. (1989) unless otherwise noted. | Sourcedd Literature source of ROSAT X-ray Luminosity of hot ISM gas. In order of preference with the additional criteria of selecting detections in favor of upper limits: IS = Irwin & Sarazin (1998), OPC = O’Sullivan et al. (2003), OFP = O’Sullivan et al. (2001), BB = Brown & Bregman (1998), B = Beuing et al. (1999), MZ = Mulchaey & Zabludoff (1999), and BHR = Bregman et al. (1995). Note that direct comparisions between the galaxies will lead to errors as each author employs different reduction and analysis methods. The luminosities have been scaled to a common Hubble constant of . | e,fe,ffootnotemark: | Sourcegg Souce of optical effective radius; P90 = Peletier et al. (1990), B87 = Burstein et al. (1987), G94 = Goudfrooij et al. (1994b), RC3 = de Vaucouleurs et al. (1991), POSS = Determined from fitting to Palomar Observatory Digital Sky Survey, J95 = Jorgensen et al. (1995), C87 = Capaccioli et al. (1987), R01 = Ryden et al. (2001), F89 = Franx et al. (1989). | NoteshhNote Abbreviations: BGG = Brightest galaxy in a group (these objects have been shown to follow different scaling laws than field and group member galaxies; cf. Helsdon et al. (2001)), D = Dwarf galaxy within the Local Group, SB = Galaxy known to have recent starburst activity, AGN = Galaxy is known to host a strong active galactic nuclei, EnvI = optical observations of the galaxy reveals signs of interaction with its environment, either minor mergers or satellite galaxy accretion, and Merger = Galaxy know to be undergoing a major merger. | |
|---|---|---|---|---|---|---|---|---|---|
| (J2000.00) | (J2000.00) | (Mpc) | (mag) | log () | () | ||||
| NGC 315 | 00 57 48.9 | +30 21 09 | 62.2011 O’Sullivan et al. (2001). | 11.53 | 41.68 | OFP | 66.82 | P90 | AGN |
| NGC 404 | 01 09 26.9 | +35 43 03 | 3.26 | 9.94 | B | 99.34 | B87 | D | |
| NGC 507 | 01 23 40.0 | +33 15 20 | 81.3922 Faber et al. (1989). | 11.63 | 41.95 | IS | 77.11 | B87 | BGG |
| NGC 533 | 01 25 31.3 | +01 45 33 | 71.1122 Faber et al. (1989). | 12.26 | 41.71 | IS | 47.55 | B87 | BGG |
| NGC 720 | 01 53 00.4 | -13 44 18 | 27.67 | 11.16 | 40.32 | IS | 39.87 | G94 | BGG |
| NGC 741 | 01 56 21.0 | +05 37 44 | 74.7622 Faber et al. (1989). | 12.05 | 41.00 | OPC | 57.08 | P90 | BGG |
| NGC 821 | 02 08 21.1 | +10 59 42 | 32.2322 Faber et al. (1989). | 11.57 | B | 54.10 | P90 | ||
| NGC 1132 | 02 52 51.7 | -01 16 30 | 101.0033 Colbert et al. (2001). | 13.01ff RC3 (de Vaucouleurs et al., 1991). | 41.25 | MZ | 33.66 | RC3 | |
| NGC 1265 | 03 18 15.8 | +41 51 28 | 108.2211 O’Sullivan et al. (2001). | 12.30ff RC3 (de Vaucouleurs et al., 1991). | OFP | 11.61 | POSS | ||
| NGC 1291 | 03 17 18.3 | -41 06 28 | 8.90 | 9.32ff RC3 (de Vaucouleurs et al., 1991). | 39.62 | BHR | 54.59 | RC3 | |
| NGC 1316 | 03 22 41.7 | -37 12 30 | 21.48 | 9.40ff RC3 (de Vaucouleurs et al., 1991). | 40.52 | IS | 80.80 | B87 | |
| NGC 1332 | 03 26 17.3 | -21 20 07 | 22.91 | 10.2711 O’Sullivan et al. (2001). | 40.45 | IS | 54.60 | RC3 | |
| NGC 1399 | 03 38 29.3 | -35 27 01 | 20.99 | 10.55 | 40.70 | IS | 42.55 | G94 | BGG |
| NGC 1404 | 03 38 51.9 | -35 35 40 | 20.99 | 10.89 | 40.62 | IS | 26.64 | G94 | |
| NGC 1407 | 03 40 11.8 | -18 34 48 | 28.84 | 10.57 | 40.32 | IS | 71.30 | G94 | BGG |
| NGC 1549 | 04 15 44.0 | -55 35 30 | 19.98 | 10.58 | 40.04 | IS | 47.75 | G94 | |
| NGC 1553 | 04 16 10.3 | -55 46 51 | 18.54 | 10.26ff RC3 (de Vaucouleurs et al., 1991). | 40.41 | IS | 63.07 | J95 | AGN |
| NGC 1600 | 04 31 39.8 | -05 05 10 | 56.6122 Faber et al. (1989). | 11.79 | 41.64 | B | 54.31 | P90 | BGG |
| NGC 2434 | 07 34 51.1 | -69 17 03 | 21.58 | 11.43 | 40.00 | B | 31.41 | RC3 | |
| NGC 2865 | 09 23 30.1 | -23 09 43 | 37.84 | 12.29 | B | 11.67 | P90 | ||
| NGC 3115 | 10 05 13.9 | -07 43 07 | 9.68 | 9.95 | 39.27 | IS | 57.05 | C87 | |
| NGC 3377 | 10 47 42.4 | +13 59 08 | 11.22 | 9.7211 O’Sullivan et al. (2001). | B | 34.63 | P90 | ||
| NGC 3379 | 10 47 49.6 | +12 34 55 | 10.57 | 10.43 | 39.23 | BB | 33.29 | G94 | |
| NGC 3585 | 11 13 17.1 | -26 45 18 | 20.04 | 10.53 | 38.89 | OFP | 39.60 | R01 | |
| NGC 3923 | 11 51 01.8 | -28 48 22 | 22.91 | 10.52 | 39.76 | OPC | 53.35 | B87 | BGG |
| NGC 4125 | 12 08 05.8 | +65 10 27 | 23.88 | 10.58 | 40.58 | IS | 57.73 | G94 | BGG,EnvI |
| NGC 4261 | 12 19 23.2 | +05 49 31 | 31.62 | 11.32 | 40.63 | IS | 39.66 | G94 | BGG,AGN |
| NGC 4365 | 12 24 28.2 | +07 19 03 | 20.42 | 10.64 | 39.99 | IS | 57.50 | G94 | |
| NGC 4374 | 12 25 03.7 | +12 53 13 | 18.37 | 10.13 | 40.26 | IS | 50.70 | G94 | |
| NGC 4382 | 12 25 24.0 | +18 11 26 | 18.45 | 9.99ff RC3 (de Vaucouleurs et al., 1991). | 40.23 | IS | 71.38 | RC3 | EnvI |
| NGC 4406 | 12 26 11.7 | +12 56 46 | 17.14 | 9.87 | 41.08 | IS | 89.64 | P90 | |
| NGC 4459 | 12 29 00.0 | +13 58 43 | 17.10 | 11.21ff RC3 (de Vaucouleurs et al., 1991). | 40.27 | OFP | 16.11 | POSS | |
| NGC 4472 | 12 29 46.8 | +08 00 02 | 16.29 | 9.32 | 39.76 | IS | 104.40 | P90 | BGG |
| NGC 4486 | 12 30 49.4 | +12 23 28 | 16.07 | 9.52 | 43.05 | B | 105.16 | G94 | BGG, AGN |
| NGC 4494 | 12 31 24.1 | +25 46 28 | 17.06 | 10.69 | 38.73 | BB | 45.61 | G94 | |
| NGC 4552 | 12 35 39.8 | +12 33 23 | 15.35 | 10.84 | 40.09 | IS | 48.89 | RC3 | |
| NGC 4555 | 12 35 41.1 | +26 31 23 | 95.4211 O’Sullivan et al. (2001). | 12.99ff RC3 (de Vaucouleurs et al., 1991). | 41.95 | OFP | 11.31 | POSS | |
| NGC 4621 | 12 42 02.4 | +11 38 48 | 18.28 | 10.65 | 39.24 | BB | 35.47 | G94 | |
| NGC 4636 | 12 42 50.0 | +02 41 17 | 14.65 | 10.20 | 40.88 | IS | 100.08 | P90 | BGG |
| NGC 4649 | 12 43 39.6 | +11 33 09 | 16.83 | 9.77 | 40.46 | IS | 73.73 | P90 | EnvI |
| NGC 4697 | 12 48 35.9 | -05 48 02 | 11.75 | 10.03 | 39.86 | IS | 76.53 | G94 | |
| NGC 4782 | 12 54 35.7 | -12 34 07 | 66.9611 O’Sullivan et al. (2001). | 12.56ff RC3 (de Vaucouleurs et al., 1991). | 41.71 | OFP | 18.00 | POSS | EnvI |
| NGC 5018 | 13 13 01.0 | -19 31 05 | 42.0022 Faber et al. (1989). | 12.29 | OFP | 28.71 | G94 | EnvI | |
| NGC 5044 | 13 15 23.9 | -16 23 08 | 31.19 | 11.25 | 42.01 | IS | 82.23 | G94 | BGG |
| NGC 5102 | 13 21 57.6 | -36 37 49 | 6.60 | 10.57 | 38.64 | IS | 26.13 | B87 | |
| NGC 5253 | 13 39 55.9 | -31 38 24 | 3.3344 Gibson et al. (2000). | 10.47ff RC3 (de Vaucouleurs et al., 1991). | OFP | 22.76 | RC3 | D,SB | |
| IC 4296 | 13 36 39.4 | -33 58 00 | 48.7555 Mei et al. (2000). | 11.42 | 40.86 | IS | 41.41 | RC3 | BGG,AGN |
| NGC 5845 | 15 06 00.8 | +01 38 02 | 25.94 | 13.35 | OFP | 4.48 | B87 | ||
| NGC 5846 | 15 06 29.2 | +01 36 21 | 25.94 | 10.67 | 41.01 | IS | 82.98 | F89 | BGG |
| NGC 6482 | 17 51 48.8 | +23 04 19 | 57.77 | 11.90 | 42.18 | OFP | 9.08 | G94 | |
| NGC 7252 | 22 20 44.8 | -24 40 43 | 68.0066 Toomre (1977). | 12.47ff RC3 (de Vaucouleurs et al., 1991). | 39.59 | OFP | 14.93 | RC3 | Merger |
| IC 1459 | 22 57 10.6 | -36 27 44 | 29.24 | 10.88 | 40.62 | BB | 38.61 | G94 | BGG,AGN |
| NGC 7618 | 23 19 47.2 | +42 51 10 | 75.0022 Faber et al. (1989). | 13.34ff RC3 (de Vaucouleurs et al., 1991). | - | - | 11.97 | POSS |
| Galaxy | Obs IDaaChandra Observation Identification Number. | Exp. TimebbTotal livetime. | Cleaned Exp. TimeccEffective exposure time after cleaning of the data for high particle background flares. (See Section 3.) | FP TempddFocal plane temperature of the ACIS array. Note that different calibrations must be employed for the different temperatures. | Data Modeee Effective, blue half-light radius, . |
|---|---|---|---|---|---|
| (KSec) | (KSec) | (C) | |||
| NGC 315 | 4156 | 55.13 | 52.93 | -120 | Very Faint |
| NGC 404 | 870 | 27.74 | 23.74 | -110 | Faint |
| NGC 507 | 317 | 28.17 | 18.79 | -120 | Faint |
| NGC 533 | 2880 | 41.56 | 37.42 | -120 | Very Faint |
| NGC 720 | 492 | 41.56 | 39.42 | -120 | Faint |
| NGC 741 | 2223 | 31.44 | 29.28 | -120 | Faint |
| NGC 821 | 4006/4408 | 14.13/24.65 | 13.25/16.85 | -120/-120 | Very Faint |
| NGC 1132 | 801 | 16.33 | 13.36 | -110 | Faint |
| NGC 1265 | 3237 | 93.90 | 84.03 | -120 | Very Faint |
| NGC 1291 | 795/2059 | 40.46/37.41 | 37.41/23.02 | -120/-120 | Faint |
| NGC 1316 | 2022 | 31.48 | 28.36 | -120 | Faint |
| NGC 1332 | 4372 | 56.54 | 47.21 | -120 | Faint |
| NGC 1399 | 319 | 57.38 | 55.66 | -110 | Faint |
| NGC 1404 | 2942 | 29.25 | 29.10 | -120 | Faint |
| NGC 1407 | 791 | 50.34 | 44.44 | -120 | Very Faint |
| NGC 1549 | 2077 | 10.78 | 3.88 | -120 | Faint |
| NGC 1553 | 783 | 41.32 | 18.05 | -110 | Very Faint |
| NGC 1600 | 4283/4371 | 26.86/26.76 | 22.36/26.62 | -120 | Very Faint |
| NGC 2434 | 2923 | 47.25 | 29.42 | -120 | Very Faint |
| NGC 2865 | 2020 | 31.71 | 25.81 | -120 | Faint |
| NGC 3115 | 2040 | 38.72 | 35.50 | -120 | Faint |
| NGC 3377 | 2934 | 39.67 | 39.44 | -120 | Very Faint |
| NGC 3379 | 1587 | 33.74 | 31.36 | -120 | Faint |
| NGC 3585 | 2078 | 37.01 | 35.12 | -120 | Faint |
| NGC 3923 | 1563 | 22.44 | 19.31 | -120 | Faint |
| NGC 4125 | 2071 | 64.24 | 63.91 | -120 | Very Faint |
| NGC 4261 | 834 | 36.38 | 33.54 | -120 | Very Faint |
| NGC 4365 | 2015 | 42.33 | 40.23 | -120 | Faint |
| NGC 4374 | 803 | 30.61 | 28.33 | -120 | Very Faint |
| NGC 4382 | 2016 | 40.84 | 39.55 | -120 | Faint |
| NGC 4406 | 318 | 16.51 | 12.36 | -120 | Faint |
| NGC 4459 | 2927 | 9.84 | 9.79 | -120 | Faint |
| NGC 4472 | 321 | 41.63 | 32.66 | -120 | Very Faint |
| NGC 4486 | 2707 | 98.67 | 96.2 | -120 | Faint |
| NGC 4494 | 2079 | 24.85 | 19.25 | -120 | Faint |
| NGC 4552 | 2072 | 56.84 | 54.15 | -120 | Faint |
| NGC 4555 | 2884 | 29.97 | 28.92 | -120 | Faint |
| NGC 4621 | 2068 | 25.11 | 24.71 | -120 | Faint |
| NGC 4636 | 323 | 54.94 | 46.88 | -110 | Faint |
| NGC 4649 | 785 | 39.61 | 25.74 | -120 | Very Faint |
| NGC 4697 | 784 | 41.41 | 39.06 | -110 | Faint |
| NGC 4782 | 3220 | 49.33 | 49.08 | -120 | Very Faint |
| NGC 5018 | 2070 | 32.65 | 28.58 | -120 | Faint |
| NGC 5044 | 798 | 22.25 | 20.36 | -120 | Faint |
| NGC 5102 | 2949 | 34.22 | 34.04 | -120 | Very Faint |
| NGC 5253 | 2032 | 58.33 | 56.35 | -120 | Faint |
| IC 4296 | 3394 | 24.85 | 24.71 | -120 | Faint |
| NGC 5845 | 4009 | 29.97 | 29.82 | -120 | Very Faint |
| NGC 5846 | 788 | 31.34 | 24.34 | -120 | Faint |
| NGC 6482 | 3218 | 19.36 | 19.35 | -120 | Very Faint |
| NGC 7252 | 2980 | 29.48 | 20.87 | -120 | Faint |
| IC 1459 | 2196 | 59.38 | 53.83 | -120 | Faint 1/2ffFaint 1/2 indicates that a subraster of the image was used for observations. |
| NGC 7618 | 802 | 20.23 | 14.56 | -110 | Faint |
| Outer Region Background | Blank Sky Background | Local Background | ||||
|---|---|---|---|---|---|---|
| Annular Bin | kT | kT | kt | |||
| () | (keV) | (keV) | (keV) | |||
| NGC 315 | ||||||
| NGC 404 | ||||||
| NGC 507 | ||||||
| NGC 533 | ||||||
| NGC 720 | ||||||
| NGC 741 | ||||||
| NGC 821 | ||||||
| NGC 1132 | ||||||
| NGC 1265 | ||||||
| NGC 1291 | ||||||
| NGC 1291 | ||||||
| NGC 1316 | ||||||
| NGC 1332 | ||||||
| NGC 1399 | ||||||
| NGC 1404 | ||||||
| NGC 1407 | ||||||
| NGC 1549 | ||||||
| NGC 1553 | ||||||
| NGC 1600 | ||||||
| NGC 1600 | ||||||
| NGC 2434 | ||||||
| NGC 2865 | ||||||
| NGC 3115 | ||||||
| NGC 3377 | ||||||
| NGC 3379 | ||||||
| NGC 3585 | ||||||
| NGC 3923 | ||||||
| NGC 4125 | ||||||
| NGC 4261 | ||||||
| NGC 4365 | ||||||
| NGC 4374 | ||||||
| NGC 4382 | ||||||
| NGC 4406 | ||||||
| NGC 4459 | ||||||
| NGC 4472 | ||||||
| NGC 4486 | ||||||
| NGC 4494 | ||||||
| NGC 4552 | ||||||
| NGC 4555 | ||||||
| NGC 4621 | ||||||
| NGC 4636 | ||||||
| NGC 4649 | ||||||
| NGC 4697 | ||||||
| NGC 4782 | ||||||
| NGC 5018 | ||||||
| NGC 5044 | ||||||
| NGC 5102 | ||||||
| NGC 5253 | ||||||
| IC 4296 | ||||||
| NGC 5845 | ||||||
| NGC 5846 | ||||||
| NGC 6482 | ||||||
| NGC 7252 | ||||||
| IC 1459 | ||||||
| NGC 7618 | ||||||
| Annular Bin | Annular Bin | Temperature | Density | Entropy | Cumulative Mass | Area |
|---|---|---|---|---|---|---|
| ) | (%) | |||||
| NGC 315 | ||||||
| NGC 404 | ||||||
| NGC 507 | ||||||
| NGC 533 | ||||||
| NGC 720 | ||||||
| NGC 741 | ||||||
| NGC 821 | ||||||
| NGC 1132 | ||||||
| NGC 1265 | ||||||
| NGC 1291 | ||||||
| NGC 1291 | ||||||
| NGC 1316 | ||||||
| NGC 1332 | ||||||
| NGC 1399 | ||||||
| NGC 1404 | ||||||
| NGC 1407 | ||||||
| NGC 1549 | ||||||
| NGC 1553 | ||||||
| NGC 1600 | ||||||
| NGC 1600 | ||||||
| NGC 2434 | ||||||
| NGC 2865 | ||||||
| NGC 3115 | ||||||
| NGC 3377 | ||||||
| NGC 3379 | ||||||
| NGC 3585 | ||||||
| NGC 3923 | ||||||
| NGC 4125 | ||||||
| NGC 4261 | ||||||
| NGC 4365 | ||||||
| NGC 4374 | ||||||
| NGC 4382 | ||||||
| NGC 4406 | ||||||
| NGC 4459 | ||||||
| NGC 4472 | ||||||
| NGC 4486 | ||||||
| NGC 4494 | ||||||
| NGC 4552 | ||||||
| NGC 4555 | ||||||
| NGC 4621 | ||||||
| NGC 4636 | ||||||
| NGC 4649 | ||||||
| NGC 4697 | ||||||
| NGC 4782 | ||||||
| NGC 5018 | ||||||
| NGC 5044 | ||||||
| NGC 5102 | ||||||
| NGC 5253 | ||||||
| IC 4296 | ||||||
| NGC 5845 | ||||||
| NGC 5846 | ||||||
| NGC 6482 | ||||||
| NGC 7252 | ||||||
| IC 1459 | ||||||
| NGC 7618 | ||||||
| Per Bin Properties | Cumulative Properties | ||||||
|---|---|---|---|---|---|---|---|
| Annular Bin | Annular Bin | ||||||
| NGC 315 | |||||||
| NGC 404 | |||||||
| NGC 507 | |||||||
| NGC 533 | |||||||
| NGC 720 | |||||||
| NGC 741 | |||||||
| NGC 821 | |||||||
| NGC 1132 | |||||||
| NGC 1265 | |||||||
| NGC 1291 | |||||||
| NGC 1291 | |||||||
| NGC 1316 | |||||||
| NGC 1332 | |||||||
| NGC 1399 | |||||||
| NGC 1404 | |||||||
| NGC 1407 | |||||||
| NGC 1549 | |||||||
| NGC 1553 | |||||||
| NGC 1600 | |||||||
| NGC 1600 | |||||||
| NGC 2434 | |||||||
| NGC 2865 | |||||||
| NGC 3115 | |||||||
| NGC 3377 | |||||||
| NGC 3379 | |||||||
| NGC 3585 | |||||||
| NGC 3923 | |||||||
| NGC 4125 | |||||||
| NGC 4261 | |||||||
| NGC 4365 | |||||||
| NGC 4374 | |||||||
| NGC 4382 | |||||||
| NGC 4406 | |||||||
| NGC 4459 | |||||||
| NGC 4472 | |||||||
| NGC 4486 | |||||||
| NGC 4494 | |||||||
| NGC 4552 | |||||||
| NGC 4555 | |||||||
| NGC 4621 | |||||||
| NGC 4636 | |||||||
| NGC 4649 | |||||||
| NGC 4697 | |||||||
| NGC 4782 | |||||||
| NGC 5018 | |||||||
| NGC 5044 | |||||||
| NGC 5102 | |||||||
| NGC 5253 | |||||||
| IC 4296 | |||||||
| NGC 5845 | |||||||
| NGC 5846 | |||||||
| NGC 6482 | |||||||
| NGC 7252 | |||||||
| IC 1459 | |||||||
| NGC 7618 | |||||||
| Annular Bin | Annular Bin | Oxygen | Iron | Magnesium | Silicon |
|---|---|---|---|---|---|
| (Relative to Photospherice Solar Abundance) | |||||
| NGC 507 | |||||
| NGC 533 | |||||
| NGC 741 | |||||
| NGC 1132 | |||||
| NGC 1399 | |||||
| NGC 1404 | |||||
| NGC 1407 | |||||
| NGC 1600 | |||||
| NGC 4261 | |||||
| NGC 4374 | |||||
| NGC 4406 | |||||
| NGC 4472 | |||||
| NGC 4486 | |||||
| NGC 4552 | |||||
| NGC 4555 | |||||
| NGC 4636 | |||||
| NGC 4649 | |||||
| NGC 5044 | |||||
| NGC 5846 | |||||
| NGC 6482 | |||||
| IC 1459 | |||||
| NGC 7618 | |||||
| Annular Bin | Annular Bin | Abundance |
|---|---|---|
| () | ||
| NGC 315 | ||
| NGC 404 | ||
| NGC 720 | ||
| NGC 821 | ||
| NGC 1265 | ||
| NGC 1291 | ||
| NGC 1291 | ||
| NGC 1316 | ||
| NGC 1332 | ||
| NGC 1549 | ||
| NGC 1553 | ||
| NGC 1600 | ||
| NGC 2434 | ||
| NGC 2865 | ||
| NGC 3115 | ||
| NGC 3377 | ||
| NGC 3379 | ||
| NGC 3585 | ||
| NGC 3923 | ||
| NGC 4125 | ||
| NGC 4365 | ||
| NGC 4382 | ||
| NGC 4459 | ||
| NGC 4494 | ||
| NGC 4621 | ||
| NGC 4697 | ||
| NGC 4782 | ||
| NGC 5018 | ||
| NGC 5102 | ||
| NGC 5253 | ||
| IC 4296 | ||
| NGC 5845 | ||
| NGC 7252 | ||
Note. — Galaxies are fit with faint VAPEC model as discussed in text. For the faintest galaxies, a metallicity is not able to be determined to to insufficient signal-to-noise.
| Galaxy | Temp | Fe Abundance | -Abundance | ||||||
|---|---|---|---|---|---|---|---|---|---|
| (keV) | (relative to solar) | ||||||||
| NGC 315 | |||||||||
| NGC 404 | |||||||||
| NGC 507 | |||||||||
| NGC 533 | |||||||||
| NGC 720 | |||||||||
| NGC 741 | |||||||||
| NGC 821 | |||||||||
| NGC 1132 | |||||||||
| NGC 1265 | |||||||||
| NGC 1291 | |||||||||
| NGC 1291 | |||||||||
| NGC 1316 | |||||||||
| NGC 1332 | |||||||||
| NGC 1399 | |||||||||
| NGC 1404 | |||||||||
| NGC 1407 | |||||||||
| NGC 1549 | |||||||||
| NGC 1553 | |||||||||
| NGC 1600 | |||||||||
| NGC 1600 | |||||||||
| NGC 2434 | |||||||||
| NGC 2865 | |||||||||
| NGC 3115 | |||||||||
| NGC 3377 | |||||||||
| NGC 3379 | |||||||||
| NGC 3585 | |||||||||
| NGC 3923 | |||||||||
| NGC 4125 | |||||||||
| NGC 4261 | |||||||||
| NGC 4365 | |||||||||
| NGC 4374 | |||||||||
| NGC 4382 | |||||||||
| NGC 4406 | |||||||||
| NGC 4459 | |||||||||
| NGC 4472 | |||||||||
| NGC 4486 | |||||||||
| NGC 4494 | |||||||||
| NGC 4552 | |||||||||
| NGC 4555 | |||||||||
| NGC 4621 | |||||||||
| NGC 4636 | |||||||||
| NGC 4649 | |||||||||
| NGC 4697 | |||||||||
| NGC 4782 | |||||||||
| NGC 5018 | |||||||||
| NGC 5044 | |||||||||
| NGC 5102 | |||||||||
| NGC 5253 | |||||||||
| IC 4296 | |||||||||
| NGC 5845 | |||||||||
| NGC 5846 | |||||||||
| NGC 6482 | |||||||||
| NGC 7252 | |||||||||
| IC 1459 | |||||||||
| NGC 7618 | |||||||||