Kinematics of NGC 2264: signs of cluster formation 11affiliation: Observations reported here were obtained at the MMT Observatory, a joint facility of the Smithsonian Institution and the University of Arizona
Abstract
We present results from 1078 high resolution spectra of 990 stars in the young open cluster NGC 2264, obtained with the Hectochelle multiobject echelle spectrograph on the 6.5m MMT. We confirm 471 stars as members, based on their radial velocity and/or emission. The radial velocity distribution of cluster members is non-Gaussian with a dispersion of km s-1. We find a substantial north-south velocity gradient and spatially coherent structure in the radial velocity distribution, similar to that seen in the molecular gas in the region. Our results suggest that there are at least three distinguishable subclusters in NGC 2264, correlated with similar structure seen in 13CO emission, which is likely to be a remnant of initial structure in this very young cluster. We propose that this substructure is the result of gravitational amplification of initial inhomogeneities during overall collapse to a filamentary distribution of gas and stars, as found in simulations by Burkert & Hartmann (2004).
1 Introduction
Studies of young galactic clusters associated with molecular clouds can provide insight into the early history and formation of these objects. One of the most famous and best studied young cluster is NGC 2264. Many investigations of this region have been undertaken, building on the early work of Herbig (1954). A number of studies suggest low extinction toward NGC 2264 ( by Walker (1956); by Sung et al. (1997); by Park et al. (2000)), although the large amount of molecular gas in the region (§2.4) suggests that a substantial number of sources embedded in dust remain to be found. The optical nebular emission is less intense than in the Orion Nebula Cluster (ONC), so contamination of stellar spectra from nebular emission is less of a problem in NGC 2264. There is a dark cloud immediately behind the cluster which obscures most of the background stars, thus reducing the number of potential impostor members (Herbig, 1954). Thus, despite the fact that NGC 2264 is more distant than the ONC and other nearby regions of star formation ( 800 pc by Walker 1956; 800 pc by Sagar & Joshi 1983; pc by Pérez et al. 1987; pc by Park et al. 2000) the low extinction and weak nebular emission make NGC 2264 a favorable and important target for star and cluster formation studies.
Age estimates of NGC 2264 have been reduced as the quality of NGC 2264 observations have improved. Early estimates suggested ages 3-5 Myr (Harris, 1976; Park et al., 2000; Palla & Stahler, 1999), while Flaccomio et al. (2000) estimate an age closer to 1-2 Myr, and Ramírez et al. (2004) found that most of the X-ray stars were younger than 3 Myr. A major reason for the discrepancy between different estimates is the differing weight placed on specific mass ranges. As pointed out by Hartmann (2003), ages inferred from M⨀ stars in young associations tend to be older than those of the lower-mass stars. Hartmann (2003) argued that the ages of these slightly higher-mass stars are systematically overestimated by neglecting “birthline” effects (e.g., pre-main sequence contraction from finite starting radii); this leads us to favor the lower ages of Flaccomio et al. (2000). and Ramírez et al. (2004) based on the lower mass stars, which are more consistent with the large amount of molecular gas associated with the cluster.
The spatial distribution of the stars in NGC 2264 is extended along the north-south direction, paralelling the extension of the molecular gas in the region (Ridge et al., 2003). This feature, consistent with the general youth of the cluster, suggests that NGC 2264 may still exhibit the morphology of the gas cloud from which the protostars coalesced. The early evolution of stellar systems may be strongly affected by the density and dynamics of the environments in which they form. Numerical simulations (Scally & Clarke, 2002) show that the lifetime of any primordial substructure is short, a few million years or less. Radial velocity studies may be able to provide clues to cluster formation for very young regions by revealing coherent patterns in the motion of sub-regions.
In this paper we report the initial results of our continuing radial velocity (RV) survey of NGC 2264, in the search for kinematic signs of primordial structures in young stellar clusters. In §2 we describe the observations and data reduction; in §3 we compare the radial velocity distribution of the stellar and gaseous component, the latter as traced by 13CO measurements. Finally, we discuss possible implications of our results for cluster formation scenarios.
2 Observations and data reduction
2.1 Target selection
We drew our target sample from several sources, starting with surveys of H emission-line objects (Herbig 1954; Reipurth et al. 2004 – R04 hereafter), narrow-band photometry (Sung et al., 1997, 2004; Park et al., 2000), and samples of young objects selected based upon their IR and UV excess (Lada et al., 1993; Rebull et al., 2002). All of these surveys have a bias toward finding (accreting) Classical T Tauri stars (CTTS) and against finding pre-main sequence (PMS) stars with weak or no disks. Therefore, by supplementing these samples with a large catalog of X-ray sources (Flaccomio et al., 2000; Ramírez et al., 2004), also sensitive to weak-emission (non-accreting) T Tauri stars (WTTS), the bias towards accreting stars can be corrected. These surveys, together with proper motion (Vasilevskis et al., 1965) and variability (Lamm et al., 2004) surveys provide a very good input catalog of potential cluster members.
The selected targets come from three of the catalogs above: a substantial fraction, 1389 stars, from Ramírez et al. (2004) X-ray sources; 408 H emission stars from R04; and 100 stars from Park et al. (2000). As some of the stars appeared in more than one of these three cataloges, the final target list contained 1563 stars.
2.2 Spectroscopic observations
The stellar spectra were obtained with Hectochelle (Szentgyorgyi et al., 1998), a fiber-fed, bench mounted echelle spectrograph that operates at the post-conversion MMT. The MMT is a 6.5m Cassegrain telescope and the Hectochelle is designed to operate with the MMT in its f/5, wide field mode (Fabricant et al., 2004). The robot positioner places all 300 fibers buttons for observation in five minutes with an accuracy of 25m or better. The fiber diameter is 250m, or 1.5″ at the MMT f/5 plate scale. The resolution of the Hectochelle is 34,000 and the the peak efficiency is 7% of the light striking the primary mirror. Because the Hectochelle and Hectospec, a moderate dispersion fiber fed spectrograph, both use the same fiber feed, but have different magnifications, only 240 fiber images fall on the Hectochelle focal plane format, while Hectospec exploits all 300 available fibers.
The preferred order for radial velocities with Hectochelle is centered at 5225Å and includes the Mg triplet. Unfortunately, a failure of the original coatings (now replaced) on the camera and collimator mirrors of Hectochelle reduced the reflectivity in this spectral region by a factor of up to 6 per mirror. Also, our targets have brighter continuua at H than at 5225Å, helping to compensate for fewer lines. Therefore we decided to use the 190Å wide order centered at H, which was relatively unaffected by the coating failure. Although this order has a smaller number of lines than the 5225Å order, we found that by masking out the line when executing the cross-correlation we can get velocities with an error of km s-1. This velocity resolution is good enough for our kinematic study (see, e.g., Sicilia-Aguilar et al. 2005). While this order is not optimal for radial velocity measurement, observations of the profiles allows us to unambiguously identify and distinguish CTTS and WTTS stars.
Our first observations in NGC 2264 were taken in March 2004. These data were obtained during the commissioning phase of the instrument, and we ended up observing 155 targets in one fiber configuration (see Table 1) centered north of the Cone nebula. The preliminary results derived from this first data set showed interesting results so we decided to observe NGC 2264 again. We revisited the cluster selecting targets from an expanded list including objects from the cataloge of R04 and the full cataloge of Ramírez et al. (2004).
Even though the spectrograph mirrors were re-coated during the summer of 2004 and we could have used the 5225Å order, we found that the accuracy of radial velocities obtained in the H order to be adequate and the extra information in the H line profiles to be scientifically useful so we continued our observations in this order. The second observing run was carried out in December, 2004. During the nights of 2 Dec. and 3 Dec. we observed 923 targets in four fields (see Table 1), including 88 targets observed in March which were thought to be members based on the March RV data.
We have found, in observations of regions with strong, spatially structured nebular emission, e.g. the Orion Nebula Cluster (Sicilia-Aguilar et al., 2004), that it is necessary to offset the telescope 10″ without moving the fiber buttons to obtain a good measurement of nebular emission contaminating the stellar spectra. In March we followed this procedure. We found that in NGC 2264 this background subtraction is only important near the H and [N II] lines; it is unimportant for radial velocity measurements, which depend only upon the absorption line spectra in between the emission features. Therefore in December we opted to eliminated the offset observations so that we might spend more time collecting stellar spectra.
2.3 Radial velocities
To establish the radial velocity zero point for our spectra and to provide a variety of well-observed spectra that could serve as templates in the cross-correlation analysis, we obtained spectra of 10 relatively bright stars in a field located in Selected Area 57 (Pickering and Kapteyn, 1918), near the north Galactic Pole. The radial velocities of these stars have been monitored for many years using the CfA Digital Speedometers (Latham, 1992) without showing any signs of variation, and their absolute velocities have all been measured with a precision better than 0.2 km s-1 following the procedures outlined by Stefanik, Latham, & Torres (1999). These 10 stars were included in the sample discussed by Latham et al. (1991), but two recent technical developments have made it possible to improve measurements of their mean velocities. First, several additional observations had been obtained over the intervening years, thus doubling the typical time spanned by the radial velocities measurements. Second, the spectra were re-analyzed using our latest library of synthetic spectral templates calculated by Jon Morse for a grid of Kurucz (1979) model atmospheres for a range of effective temperatures, surface gravities and rotational velocities. Solar abundance is assumed in all cases. We ran grids of correlations between these templates and observed spectra using the rvsao package (Kurtz & Mink, 1998) running inside the IRAF 11footnotetext: IRAF (Image Reduction and Analysis Facility) is distributed by the National Optical Astronomy Observatories, which are operated by the Association of Universities for Research in Astronomy, Inc., under contract with the National Science Foundation.environment. For the final velocity determinations, we adopted the template parameters that gave the strongest correlation peak averaged over all the observed spectra (see Table 2; and Stefanik et al., in prep.).
To calibrate the wavelength scale of our spectra, we used Thorium-Argon lamp exposures for both the NGC 2264 targets and the SA57 secondary standards. We adopted the observed spectrum of W23870 (Latham et al., 1991) in SA57 as the template for the velocity determinations of all our NGC 2264 targets in March, because this K dwarf gave the best results using the cross-correlation technique. However, for the final reduction of the entire data set we made use of all the template stars in the SA57 field, in order to obtain the most accurate radial velocities. For each of the observed NGC 2264 targets we selected the “best matching template” which yielded the correlation peak with the highest signal-to-noise value. If the RV values from all the other 9 templates were comparable to the radial velocity measured with this best matching template, we combined all the 10 measurements of a given star and used the median value for the further analysis.
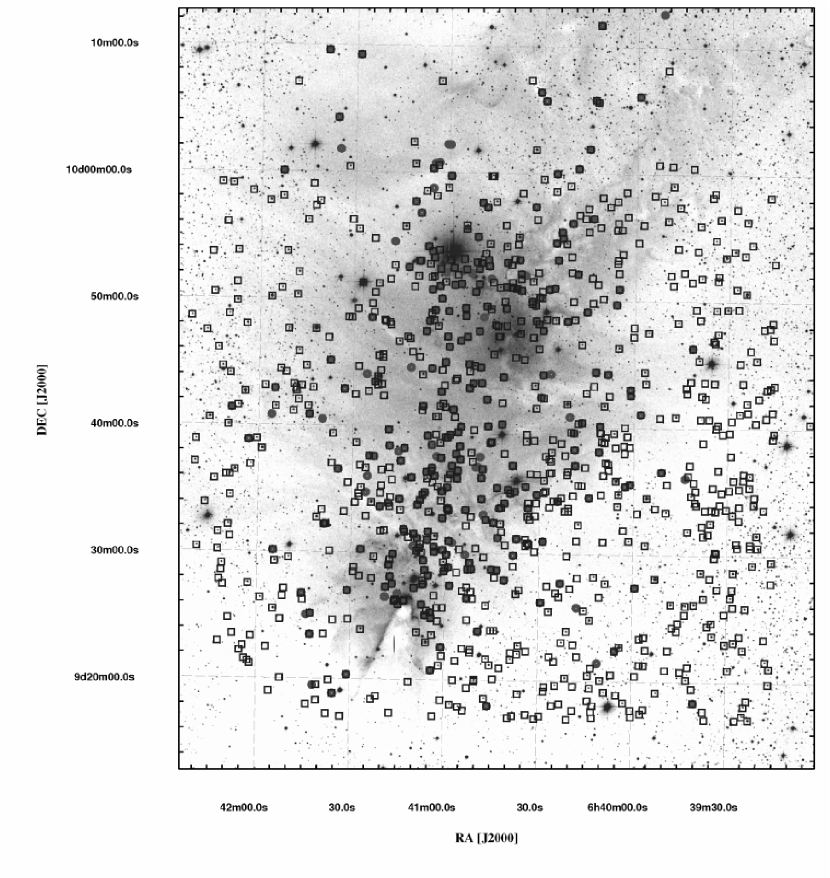
Using this method of template selection, we obtained radial velocities with errors less than 1.5 km s-1 for 344 targets, as shown in Fig. 1. In this figure we also plot the H emission stars of R04 objective prism survey to guide the eye where the larger concentrations of cluster members are expected.
In order to ensure consistency between the March and December data we observed 88 stars in both runs. For 31 of these stars yielding the highest correlation peaks the mean of the velocity differences is km s-1 with an RMS of 0.8 km s-1.
2.4 13CO observations
Observations of the 13CO transition of CO (110.201 GHz) were obtained at the Five College Radio Astronomy Observatory (FCRAO) 14m telescope located in New Salem, Massachusetts during 2002 September, as part of a larger survey of nearby cluster forming regions (Ridge et al., 2003).
Using the SEQUOIA 32-element focal-plane array and On-the-Fly (OTF) mapping technique eight submaps were obtained over 3 nights, in order to build up the final map. Submaps were obtained by scanning in RA, and an “off” source reference scan was obtained after every two rows. The off-position was checked to be free of emission by performing a single position-switched observation with an additional 30′ offset. Each submap was repeated twice to increase the sensitivity.
The narrow band digital correlator provided a total bandwidth of 25 MHz over 1024 channels, yielding an effective velocity resolution of 0.07 kms-1. System temperatures at the observing frequency were between 200 and 300 K (single sideband). Calibration was via the chopper-wheel technique (Kutner & Ulich 1981), yielding spectra with units of TA∗. The final combined map has an average rms sensitivity of 0.2 K/channel. A full discussion of the data analysis procedure and the integrated intensity image was presented in Ridge et al. (2003).
3 Results
3.1 Distribution of radial velocities
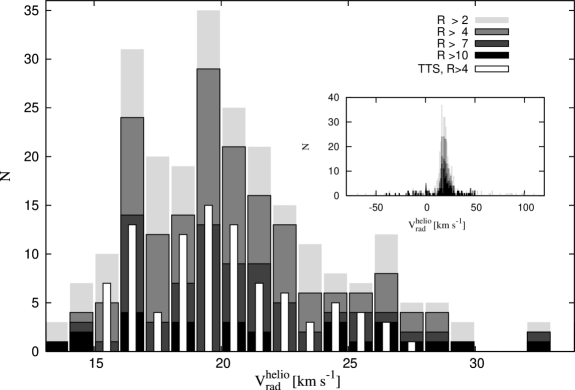
The radial velocity distribution of the 344 stars with accurate RV values is shown on Fig. 2. The cluster members clearly form a peak centered around km s-1, but the distribution is unusually wide and not symmetrical. We also report the distribution on an expanded velocity scale to show how clearly the cluster members form a peak in radial velocity space.
We plot the RV distribution for four selections of stars according to the signal-to-noise values (Tonry & Davis, 1979) of the correlation, in Fig. 2. This R value is inversely proportional to the error of velocity measurement. As described in Kurtz & Mink (1998) the errors consist of a systematic and a statistical component, the systematic could be determined for a given instrument by comparing radial velocities measured on large number (several hundred) of objects at two epochs. A very good estimate for the random velocity error is (Kurtz & Mink, 1998), where w is the FWHM of the correlation peak and R is the signal-to-noise ratio.
This estimate agrees well with our result in NGC 2264 based on 31 stars, observed both in March and December with an R value larger than 6 (see §2.3). Also, based on results with other instruments, the estimate for the error mentioned above is likely within % of the real error value for a Hectochelle measurement. We therefore adopt a velocity error of ; the error is larger for stars with rotational velocities greater than about 10 km s-1. In principle, this means that slowly-rotating stars with correlation peaks of can yield a velocity error of 2 km s-1.
Of course, in our spectral order of velocity width km s-1,
we can expect to find, just due to chance, roughly one peak
(with an FWHM of km s-1 or an R value of )
in the cross-correlation function, somewhere within the interval.
If we restrict our attention to an interval of km s-1 near
the median cluster velocity, then we would expect to have a probability
of about 10% of finding a peak of width km s-1.
The selection is included in Fig. 2 because,
even with the larger uncertainty in velocity, the distribution of these stars follow the overall shape of the histogram fairly well.
As a reminder that large errors are associated with
this group, we plotted this group as light gray columns
without a border. There is a fifth sample of stars displayed on the left panel of Fig. 2
as narrow, white bars: stars with emission detected in
their spectra. Comparing this sample to the others we can say that the radial velocity
ditribution of TTS is the same as for the rest of our targets. Also, as the
distribution is same independently of the R value of the correlation, the observed
large dispersion is not due to uncertainties in the RV measurement.
The RV histogram of Fig. 2 is far from Gaussian. To estimate the velocity dispersion we used the definition . Assuming lower and upper limits for membership as 13 km s-1and 30 km s-1, the estimated one-dimensional RV dispersion is km s-1. This is much larger than in the ONC, for example, which has a dispersion of 2.3 km s-1 (Jones & Walker, 1988), and km s-1 for the brighter stars (see also Sicilia-Aguilar et al. 2005). The skewness of the velocity distribution suggests that the cluster is not dynamically relaxed, consistent with our finding of spatially-coherent motions (§3.3).
3.2 emission and binary stars
Recording spectra at the order has the advantage of not just measuring RV, but also identifying T Tauri stars and distinguishing between the CTTS and WTTS. Classical
T Tauri stars in star forming regions were originally identified as strong
emission line objects in objective prism spectra. Later other techniques such as
X-ray surveys could find similar, young stars but with much lower optical emission
line strengths than in classical TTS. As described in Hartmann (1998) WTTS
are not accreting from circumstellar disks.
In absence of this magnetospheric accretion, which would produce emission lines with
large velocity widths ( km s-1), solar-type magnetic energy dissipation
powers the excess (chromospheric) emission in WTTS so the observed lines are much
narrower and weaker than in the case of CTTS.
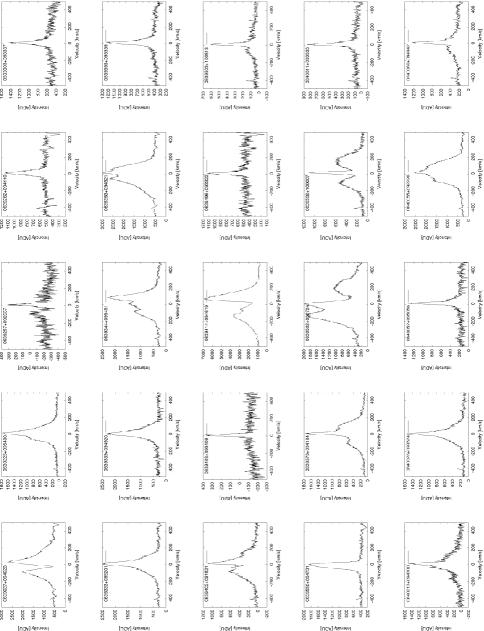
We found 277 stars with emission exceeding the nebular component: 152 among these were CTTS and 125 were WTTS, using the indicator of accretion from White & Basri (2003), that the full width at 10% intensity exceeded 270 km s-1. A sample of profiles plotted on Fig. 3. We define membership as the RV value should be within 4 of the cluster mean velocity (22 km s-1 3.5 km s-1). Based on this criteria we found 178 of these emission stars to be radial velocity members (with an R value larger than 2). For these stars identification is given in Table 3. A few of the H stars listed in Table 3 have velocities close to the 4 RV membership selection criteria, these are noted as hsb. Further observations are needed to see if these are spectroscopic binaries.
Of the 277 obvious cluster member emission stars, 99 (35%) have velocities outside either lower or higher than the mean cluster velocity. These stars yielded an R value less than 2, which suggest a random peak in the cross-correlation happened to be close to the cluster velocity. Based on their emission spectra these stars are young and therefore members, but we do not have enough SNR in the cross-correlation to determine velocities.
We identified several spectroscopic binary stars. Some of these have resolved double peaks in the cross-correlation function, and we measured different velocities in the two separate observing runs. There are 6 such stars listed in Table 3 and 4 with a three-letter note “RDB” (Resolved Double-lined Binary). In case of obvious side-lobes of the cross-correlation function and two non-consistent but accurate velocities, we identified additional 3 stars as binaries (listed with a note “UDB”, as Unresolved Double-lined Binary). There are 6 “rdb” and 5 “udb” noted stars in Table 3 and 4, for which we have just one RV measurement but observed double peaks or side-lobes in the cross-correlation function. 11 stars showed no sign of binarity in the cross-correlation, but we got two significantly different velocities. These are likely single-lined binaries, and have an “sb” note.
3.3 Velocity correlations between stars and gas
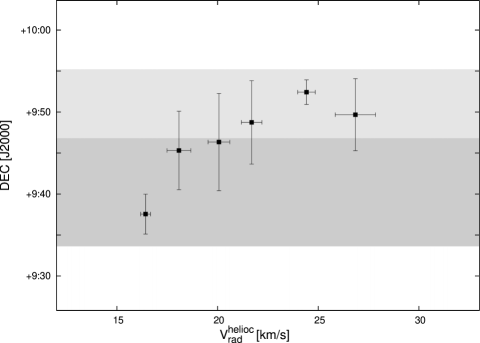
The radial velocity distribution of stars in NGC 2264, as shown in Fig 2, is wide and asymmetric, probably due to subcluster groups with different mean velocities. In optical images the cluster shows an elongated shape to the north-south direction. The stars of R04 also show two denser cores separated mainly to declination, one centered around and and the other around and (see Fig. 1). To explore this pattern further, in Fig. 4 we plot the declination values of stars observed at two epochs, as a function of velocity. In order to decrease uncertainties due to measurement errors, and natural distribution in velocity space within a possible subcluster group, we calculated mean declination values for 2 km s-1 wide bins in RV (Fig. 4). The shaded areas show the declination ranges of the two largest (suggested) subclusters based on the surface density of emission stars in the catalog of R04. The southern-most declination limit of the shading was set by the Hectochelle field observed in March. The increasing velocity with increasing declination is obvious.
There is not a clear trend in RA, but this is consistent with the optical image of the cluster which shows a North-South elongation with only a very slight tilt in RA.
But the spatial pattern of stellar velocities becomes clear
if we compare them to the pattern of molecular gas.
Using 13CO observations we tried to match the motion of the gaseous
component with the motion of the stellar component in NGC 2264. Fig.
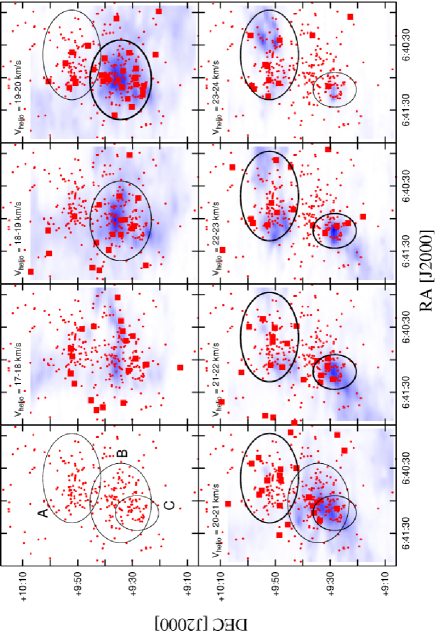
5 displays channel maps as eight, 1 km s-1 wide panels centered
between 3–10 km s-1. Stars from the peak of Fig. 2
with the same 1 km s-1 binning are superimposed on these maps; the mean
velocity of these groups are 17–24 km s-1.
The correlation between the position of dense 13CO cores and
position of stars is very convincing.
On the upper-right panels of Fig. 5 there is a dense 13CO
core at and . On the same panels, many stars occupy the same region (B) in the given RV bin. As we go to higher RV values, stars disappear from this area, as well as the gas, but two other dense 13CO regions appear. One is to the north, with an east-west elongation and a complicated structure, around the central point of and . Most of the stars fall in this region (A) on the lower panels of Fig. 5, especially on the lower-right ones.
On the lower-middle panels of Fig. 5, indicated by “C”, there is
another dense 13CO
core at and at these higher velocity values.
This surrounds the Cone-nebula. On these panels, there are several stars very close to this region,
well separated in space from the larger number of stars to the north but lieing
in the same radial velocity range. These stars are responsible for the turn-down
of the north-south gradient on Fig. 4. This can
be a hint of a third subcluster group around the Cone, having a mean heliocentric
velocity of km s-1.
The distribution of R04 stars also show correlations with the densest cores of molecular gas. At km s-1 there is a small, 3’ diameter ring of stars around and , which surrounds a strong concentration of molecular gas best seen on that panel. The ring-like distribution of RV measured member stars on the km s-1 panel could also be a sign of some high energy process which played role in the formation of the cluster.
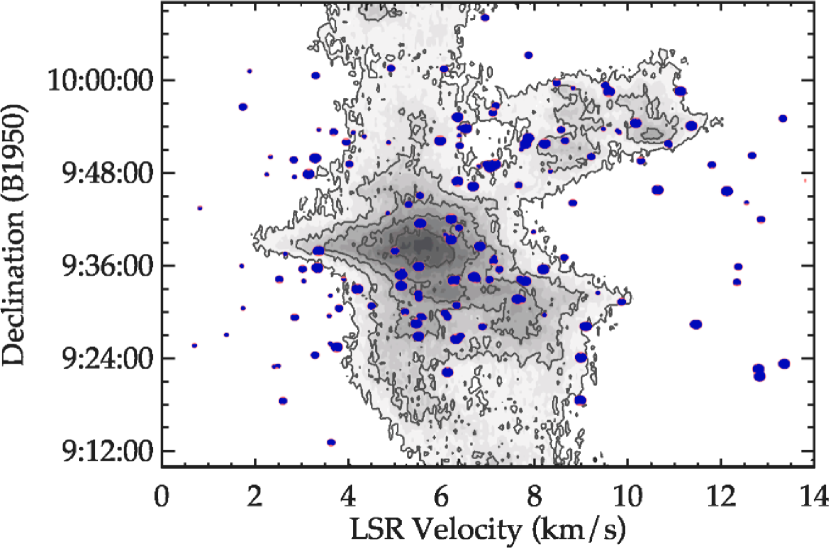
Similar agreements in the structure of stellar and gaseous components can be seen on Fig. 6, which is a projection in RA, displaying the velocities along the horizontal axis and DEC values along the vertical axis. At km s-1 and there is a“hole” in the gas, likely a projection of a bubble, surrounded by stars in a ring which has higher stellar density than the neighboring regions. This structure likely has a connection with the star HD 47839 at and
4 Discussion
While other star-forming regions have been shown to have significant substructure in the young star population (e.g., Lada & Lada 1995; Gomez et al. 1993), NGC 2264 is the first region for which we have sufficiently accurate measurements to explore substructure in the stellar radial velocities. The spatial distribution of stellar radial velocities and its correlation with the velocity structure of the molecular gas shows that NGC 2264 is composed of relatively distinct components (Figures 5,6). Intrinsic errors due to various types of activity (starspots, accretion; Guenther et al. 2000) are not large enough to obscure the strong correlation of the stellar velocities with the gas (Figures 5,6). Though individual stars could have velocity offsets on the order of few km s-1 due to fast rotation and starspots/accretion (Neuhaeuser et al., 1998; Strassmeier et al., 2005), that is very extreme and the large number of stars in our sample overrides the significance of such outliers.
The presence of such substructure in NGC 2264 is not surprising given its size and youth. Assuming a local, within-group velocity dispersion (one-dimensional) of order 2 km s-1, and a spatial extent of 4 pc ( arcmin) or so from the central region, the resulting crossing time of Myr is comparable to the estimated age of the cluster (see Introduction). Even adopting a velocity dispersion of 3.5 km s-1 results in a crossing time of 1 Myr, close to the youngest stellar age estimates. Numerical simulations show (Scally & Clarke, 2002) that substructure in a stellar cluster can remain detectable even after several crossing times, depending upon the number of stars involved and their initial subcluster densities. However, it is unlikely that the region is considerably older than one or two crossing times, because the gas also shows the same substructure as the stars. The cluster gas will shock and dissipate considerable amounts of energy on the first crossing, and thus the initial substructure should be damped out much more rapidly than for the stellar population.
Crutcher & Hartkopf (1978) presented observational evidence for two separate gaseous cores inside NGC 2264 which have a mean velocity difference of 2 km s-1. These two cores correspond in position with the centers of our southern subclusters B and C (C is in the direct vicinity of the Cone nebula), see lower left panel on Fig. 5. The velocity gradient we estimate based on our observations agrees in direction and in its amount with that determined by Crutcher & Hartkopf (1978). Lang & Willson (1980) verified the same gradient based on NH3 measurements and also explained the motion of the two cores as rotation, with a period of 4 Myrs if the rotational axis is perpendicular to the line of sight. However, as the 13CO observations of Ridge et al. (2003) show (Fig. 5), the velocity field is more complicated than simply that of pure rotation.
Large velocity dispersions sometimes arise in molecular gas as the result of powerful bipolar outflows or other stellar energy input. However, the systematic motions seen in the gas require too much energy to explain in this way. Instead, we interpret the velocities as mostly gravitationally-generated, which would very simply explain why the stars spatially co-located with the gas show the same velocities.
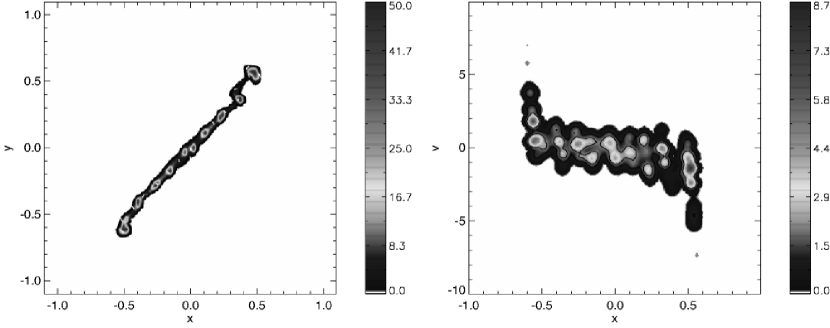
Burkert & Hartmann (2004) recently explored a simple model of the formation of star-forming filaments. Their calculations assumed that molecular clouds were formed schematically from colliding supersonic flows which formed (approximately) sheet-like configurations. If the sheet is elongated, the result is gravitational collapse first along the shortest dimension, forming a filamentary structure. As shown in the left panel of Fig. 7 (reproduced from Figure 10 in Burkert & Hartmann 2004), irregularities initially present in the sheet grow to form non-linear density enhancements by the time the configuration collapses to a filament. The right panel of Fig 7 shows the integrated surface density as a function of the radial velocity in the x-direction, showing that multiple dense structures with coherent velocities are present. Often individual “clumps” appear in nearby pairs with distinct velocities. This pattern is the result of the overall collapse of the elongated sheet; material originating on opposite sides of the sheet fall in with opposing velocities. The high-velocity infall at each end of the filament is due to the highest gravitational acceleration at filament ends (Burkert & Hartmann, 2004), coupled with some initial rotation of the sheet.
We suggest that the Burkert & Hartmann model qualitatively explains the velocity structure seen in the NGC 2264 region. The pattern of first higher velocities, then lower velocities, then somewhat higher again proceeding southward along the region (Figure 7) can be explained by gravitationally-driven infall from opposite sides of a cloud falling in to form a more filamentary structure. The highest velocity structure seen at the northern end may be similar to the acceleration seen in the end of the filament in the right panel of Fig. 7. The velocity units in Figure 7 are ; if we adopt a total gas mass of from Ridge et al. (2003) and a filament half-length of 4 pc, these units correspond to km s-1. Clearly, gravitational collapse can account for the magnitude of the motions seen in NGC 2264, especially considering geometric uncertainties and the simplicity of the model.
5 Summary
We have carried out a spectroscopic study of stars in NGC 2264, utilizing the Hectochelle multiobject spectrograph on the 6.5 m MMT. Obtaining 1078 spectra of 990 stars we classified 471 stars as cluster members based on their radial velocity and/or emission. We determined radial velocities with an accuracy of km s-1 for 344 members. The radial velocity distribution of these stars is wide, non-gaussian, and the dispersion is 3.5 km s-1. We compared the stellar radial velocities to the velocity of the molecular gas in the cluster, traced by 13CO, and found a strong correlation in the spatial distribution of the two components. At least three subgroups of stars can be identified with distinct spatial and velocity coherence. We interpret this substructure as the result of gravitational collapse of initial clumps of star-forming gas from a more extended structure to a roughly filamentary distribution. Using the results presented here, more advanced numerical simulations could help elucidate the initial conditions that produced NGC 2264.
References
- Bate et al. (1998) Bate, M.R., Clarke, C.J., & McCaughrean, M.J. 1998, MNRAS, 297, 1163
- Bate et al. (2003) Bate, M.R., Bonnell, I.A., & Bromm, V., 2003, MNRAS, 339, 577
- Bessel & Brett (1988) Bessel, M.S., & Brett, J.M. 1988. PASP, 100, 1134
- Burkert & Hartmann (2004) Burkert, A., & Hartmann, L. 2004, ApJ, 616, 288
- Crutcher & Hartkopf (1978) Crutcher, R.M., & Hartkopf, W.I. 1978, ApJ, 226, 839
- Fabricant et al. (2004) Fabricant, D.G., et al. 2004, Proc. SPIE, 5492, 767
- Fabricant et al. (2006) Fabricant, D.G., et al. 2006, PASP, In Press
- Flaccomio et al. (2000) Flaccomio, E., Micela, G., Sciortino, S., Damiani, F., Favata, F., Harnden, F.R. Jr., & Schachter, J. 2000, A&A, 355, 651
- Gomez et al. (1993) Gomez, M., Hartmann, L., Kenyon, S., & Hewtett, R., 1993, AJ, 105, 1927
- Guenther et al. (2000) Guenther, E.W., Joergens, V., Neuhäuser, R., Torres, G., Batalha, N.S., Vijapurkar, J., Fernández, M., & Mundt, R., 2001, in Zinnecker, H., & Mathieu, R.D., eds, Iau Symp. 200, The Formation of Binary Stars. ASP, Provo, p. 165
- Harris (1976) Harris, G.L.H 1976, ApJS, 30, 451
- Hartmann (1998) Hartmann, L. 1998, Accretion Process in Star Formation, Cambridge University Press
- Hartmann (2003) Hartmann, L. 2003, ApJ, 585, 398
- Herbig (1954) Herbig, G.H. 1954, ApJ, 119, 483
- Hillenbrand et al. (1998) Hillenbrand, L.A., Strom, S., Calvet, N., Mermill, K.M., Gatley, I., Makidon, R., Meyer, M., & Skrutskie, M. 1998, AJ, 116, 1816
- Joergens & Guenther (2001) Joergens, V., & Guenther, E. 2001, A&A, 379, L9
- Jones & Walker (1988) Jones, B.F., & Walker, M.F. 1988, AJ, 95, 6
- Kurucz (1979) Kurucz, R., 1979, ApJS, 40, 1
- Kurtz & Mink (1998) Kurtz, M.J., & Mink, D.J. 1998, PASP, 110, 934
- Lada & Lada (1995) Lada, E.A., & Lada, C.J. 1995, AJ, 109, 1682
- Lada et al. (1993) Lada, C., Young, E., & Greene, T. 1993, ApJ, 408, 471
- Lamm et al. (2004) Lamm, M.H., Bailer-Jones, C.A.L., Mundt, R., Herbst, W., & Scholz, A. 2004, å, 417, 557
- Lang & Willson (1980) Lang, K.R., & Willson, R.F. 1980, ApJ, 238, 867
- Latham (1992) Latham, D.W. 1992, in ASP Conf. Ser. 32, IAU Coll. No. 135, Complementary Approaches to Binary and Multiple Star Research, eds. H. McAlister & W. Hartkopf, p. 110
- Latham et al. (1991) Latham, D.W., Davis, R.J., Stefanik, R.P., Mazeh, T. & Abt, H.A. 1991, AJ, 101, 625
- Meyer et al. (1997) Meyer, M.R., Calvet, N., & Hillenbrand, L.H. 1997, AJ, 114, 288
- Muzerolle et al. (2003) Muzerolle, J., Calvet, N., Hartmann, L., & D’Alessio, P. 2003, ApJ, 597, 149
- Neuhaeuser et al. (1998) Neuhaeuser, R., Wolk, S.J., Torres, G., Preibisch, Th., Stout-Batalha, N.M., Hatzes, A.P., Frink, S., Wichmann, R., Covino, E., Alcala, J.M., Brandner, W., Walter, F.M., Sterzik, M.F., & Koehler, R. 1998, A&A, 334, 873
- Ogura (1984) Ogura, K. 1984, PASJ, 36,
- Palla & Stahler (1999) Palla, F. & Stahler, S.W. 1999, ApJ, 525, 772
- Park et al. (2000) Park, B.-G., Sung, H., Bessel, M.S., & Kang, Y.H 2000, AJ, 120, 894
- Pérez et al. (1987) Pérez, M.R., Thé, P.S., & Westerlund, B.E. 1987, PASP, 99, 1050
- Pickering and Kapteyn (1918) Pickering. E.C., & Kapteyn. J.C. 1018, Annals of Harvard College Observatory, vol. 101, pp.1-368
- Ramírez et al. (2004) Ram rez, S.V., Rebull, L., Stauffer, J., Strom, S., Hillenbrand, L., Hearty, T., Kopan, E.L., Pravdo, S., Makidon, R., & Jones, B. 2004, AJ, 128, 787
- Reipurth et al. (2004) Reipurth, B., Pettersson, B., Armond, T., Bally, J., & Vaz, L.P.R., 2004, AJ, 127, 1117
- Rebull et al. (2002) Rebull, L.M., Makidon, R.B., Strom, S.E., Hillenbrand, L.A., Birmingham, A., Patten, B.M., Jones, B.F., Yagi, H., & Adams, M.T. 2002, AJ, 123, 1528
- Ridge et al. (2003) Ridge, N.A., Wilson, T.L., Megeath, S.T., Allen, L.E., & Myers, P.C. 2003, AJ, 126, 286
- Sagar & Joshi (1983) Sagar, R., & Joshi, U.C. 1983, MNRAS, 205, 747
- Scally & Clarke (2002) Scally, A., & Calrke, C. 2002, MNRAS, 334, 156
- Sicilia-Aguilar et al. (2004) Sicilia-Aguilar, S., Hartmann, L.W., Szentgyorgyi, A.H., Fabricant, D.G., Fűrész, G., Roll, J.B., Conroy, M.A., Calvet, N., Tokarz, S., & Hernández, J. 2005, AJ, 129, 363
- Sung et al. (1997) Sung, H., Bessell, M.S., & Lee, S.-W. 1997, AJ, 114, 2644
- Sung et al. (2004) Sung, H., Bessell, M.S., & Chun, M-Y. 2004, AJ, 128, 1684
- Stefanik, Latham, & Torres (1999) Stefanik, R. P., Latham, D. W. & Torres, G. 1999, in ASP Conf. Ser. 185, IAU Coll. No. 170, Precise Stellar Radial Velocities, eds. J. B. Hearnshaw & C. D. Scarfe, p. 354
- Strassmeier et al. (2005) Strassmeier, K.G., Rice, J.B., Ritter, A., Küker, M., Hussain, G.A.J., Hubrig, S., & Shobbrook, R. 2005, A&A, 440, 1105
- Szentgyorgyi et al. (1998) Szentgyorgyi, A.H., Cheimets, P., Eng, R., Fabricant, D.G., Geary, J.C., Hartmann, L., Pieri, M.R., & Roll, J.B. 1998, Proc. SPIE, 3355, 242
- Tonry & Davis (1979) Tonry, J. & Davis, M. 1979, AJ, 84, 1511
- Vasilevskis et al. (1965) Vasilevskis, S., Sanders, W.L., & Balz, A.G.A. Jr. 1956, AJ, 70, 797
- Walker (1956) Walker, M.F. 1956, ApJS, 2, 365
- White & Basri (2003) White, R.J., & Basri, G. 2003, AJ, 582, 1109
| Date | field center | exposures | offset sky | number of targets |
|---|---|---|---|---|
| 2004 Mar 10 | min | min | 155 | |
| 2005 Dec 02 | min | — | 234 | |
| 2005 Dec 02 | min | — | 232 | |
| 2005 Dec 02 | min | — | 231 | |
| 2005 Dec 03 | min | — | 226 |
| Name | RA | DEC | log(g) | |||
|---|---|---|---|---|---|---|
| W33245 | 13:03:50.9 | +30:11:38 | -20.95 | 0.0 | 5000 | 3.5 |
| W22942 | 13:04:25.2 | +30:25:44 | -16.32 | 3.3 | 4500 | 2.5 |
| W24128 | 13:04:45.0 | +29:51:22 | 2.20 | 3.2 | 5500 | 4.5 |
| W23082 | 13:04:58.4 | +30:10:39 | -21.68 | 3.5 | 6250 | 4.5 |
| W23108 | 13:05:18.4 | +30:10:46 | -16.43 | 7.0 | 4250 | 2.0 |
| W24226 | 13:05:23.5 | +29:43:02 | 11.69 | 4.1 | 6500 | 4.5 |
| W23131 | 13:05:29.3 | +30:11:12 | -5.96 | 5.4 | 5500 | 3.5 |
| W23961 | 13:06:00.6 | +30:01:22 | -6.98 | 4.2 | 6000 | 4.5 |
| W23870 | 13:06:45.8 | +29:46:30 | -14.85 | 5.3 | 4750 | 4.0 |
| W23833 | 13:06:58.6 | +29:57:49 | -4.90 | 0.5 | 5250 | 4.0 |
Note. — Table — heliocentric velocities on the native CfA velocity system. To convert to an absolute velocity system based on extensive observations of minor planets, 0.139 km s-1 should be added to the native CfA velocities (Stefanik, Latham, & Torres, 1999).
| 2MASS_id | REBU | REIP | LAMM | notes | ||||||
|---|---|---|---|---|---|---|---|---|---|---|
| 0639037+094023 | – | 325 | – | 12.65 | 0.74 | 0.35 | c | 20.46/– | 7.6/– | H |
| 0639156+093912 | – | – | – | 13.26 | 0.44 | 0.11 | – | 17.16/– | 4.0/– | H |
| 0639157+092929 | – | – | – | 11.67 | 0.69 | 0.24 | – | 33.80/– | 12.3/– | H |
| 0639170+095815 | – | – | – | 12.43 | 0.36 | 0.17 | – | 14.06/– | 6.2/– | H |
| 0639226+091703 | – | – | – | 11.13 | 0.19 | 0.14 | – | 28.28/– | 2.2/– | H |
| 0639226+095430 | – | 330 | – | 14.25 | 0.61 | 0.35 | w | 16.51/– | 2.1/– | H |
| 0639229+093616 | – | – | – | 12.62 | 0.49 | 0.14 | – | 14.49/– | 11.3/– | H |
| 0639246+092233 | – | – | – | 12.79 | 0.41 | 0.12 | – | 18.30/– | 9.7/– | H |
| 0639262+094110 | R453 | – | – | 12.71 | 0.58 | 0.23 | w | 16.17/– | 6.2/– | H |
| 0639266+093037 | – | – | – | 15.50 | 0.66 | 0.25 | – | 29.76/– | 2.5/– | H |
| 0639275+092309 | – | – | – | 11.03 | 0.91 | 0.31 | – | 34.54/– | 11.2/– | H |
| 0639278+092839 | – | – | – | 10.81 | 0.54 | 0.20 | – | 13.17/– | 11.6/– | H |
| 0639293+092058 | – | – | – | 12.20 | 0.41 | 0.12 | – | 25.38/– | 11.2/– | H |
| 0639303+093337 | – | – | – | 12.93 | 0.69 | 0.14 | w | 21.27/– | 3.6/– | H |
| 0639329+095629 | R691 | – | – | 13.16 | 0.46 | 0.13 | – | 23.95/23.68 | 10.7/9.4 | H |
| 0639333+095201 | R705 | – | – | 12.63 | 0.73 | 0.24 | c | 19.32/– | 4.1/– | H |
| 0639335+095140 | R712 | – | – | 13.71 | 0.30 | 0.30 | – | 25.61/25.83 | 3.1/3.0 | H |
| 0639339+094920 | R729 | – | – | 13.04 | 0.77 | 0.17 | w | 19.92/– | 5.3/– | H |
| 0639344+095451 | – | – | – | 12.99 | 0.78 | 0.28 | c | 19.25/– | 6.4/– | H |
| 0639347+094654 | – | – | – | 14.45 | 0.59 | 0.26 | – | 13.30/– | 2.8/– | H |
| 0639353+093232 | – | – | – | 13.21 | 0.44 | 0.14 | – | 28.06/– | 2.9/– | vm |
| 0639360+092426 | – | – | – | 11.85 | 0.67 | 0.15 | – | 13.90/– | 11.6/– | H |
| 0639388+095151 | R893 | – | – | 12.47 | 0.40 | 0.23 | – | 13.61/– | 3.0/– | H |
| 0639393+094521 | R908 | – | – | 12.90 | 0.86 | 0.50 | c | 19.26/– | 7.8/– | H |
| 0639393+095559 | R905 | – | – | 12.79 | 0.65 | 0.24 | w | 18.32/– | 4.2/– | – |
| 0639414+094619 | R985 | – | – | 12.57 | 0.65 | 0.22 | c | 18.95/– | 7.5/– | H |
Note. — Hectochelle targets in NGC 2264 found to be members based on measured RV value or detected H emission. The criteria of beeing RV member is to have at least one velocity measurement within 4 of the cluster mean velocity: 8 km s-1 36 km s-1 . (Stars listed only with R value of cross correlation larger than 2.) For the entire table see the electronic version of the Jurnal, or contact the authors.
2MASS id — identification number from 2MASS catalog (truncated RA and DEC coordiantes as: HHMMSSS+DDMMSS); REBU — id numbers from Rebull et al 2002, AJ123, 1528; REIP — id from Reipurth et al 2004 AJ127, 1117; LAMM — id from Lamm et al 2004 A&A 417, 557; J — 2MASS J magnitude and; (J-H) — 2MASS color index; (J-H) — 2MASS color index;
H — emission detected: c – CTTS; w – WTTS; x – V642 Mon; r – reduction error in 2004 Dec data set, categorized as WTTS in 2004 Mar data;
VRDec/VRMar — heliocentric radial velocity measured 2004 Dec / 2004 Mar; RDec/RMar — R value of cross correlation (see text for details) 2004 Dec / 2004 Mar;
notes — MEMBERSHIP: vm – at least one RV measurement suggest membership, but R value is low; hm – just emission suggest membership, none of the RV values (if there are two); ACCURACY: H – most of the templates gave the same velocity, R value of cross-correlation is high, accurate RV value (typical error km s-1) for one RV measurement; BINARITY: RDB – resolved, double lined binary, with RV at 2 epochs (separated double peak in correlation function); UDB – unresolved double lin. binary, with RV at 2 epochs (blended/side lobed peak, but clear asymmetry in correlation function); rdb – same as for RDB, but only 1 RV measurement; udb – same as for UDB, but only 1 VRV measurement; sb – likely single lined binary, RV at two epochs and at least one suggest membership, some also have emission; hsb – member based on emission detected, but correlation either had just acceptable R value (barely larger than 2) or radial velocity is close to the edge of RV distribution.
| 2MASS_id | REBU | REIP | LAMM | notes | ||||||
|---|---|---|---|---|---|---|---|---|---|---|
| 0639152+093937 | R3 | – | – | 10.90 | 0.76 | 0.27 | – | 45.53/– | 5.5/– | H |
| 0639161+092105 | – | – | – | 9.95 | 1.00 | 0.36 | – | 85.84/– | 11.0/– | – |
| 0639163+091953 | – | – | – | 12.61 | 0.29 | 0.15 | – | 65.74/– | 2.8/– | – |
| 0639174+092137 | – | – | – | 13.61 | 0.32 | 0.18 | – | 44.93/– | 2.3/– | H |
| 0639183+093336 | – | – | – | 14.88 | 0.71 | 0.13 | – | 42.58/– | 2.7/– | H |
| 0639200+093036 | – | – | – | 11.32 | 0.70 | 0.24 | – | 49.10/– | 5.2/– | H |
| 0639229+093523 | – | – | – | 12.41 | 0.45 | 0.13 | – | -12.36/– | 9.0/– | H |
| 0639239+094201 | R353 | – | – | 10.84 | 1.09 | 0.44 | – | 81.66/– | 11.3/– | – |
| 0639240+092550 | – | – | – | 11.77 | 0.67 | 0.19 | – | 44.22/– | 5.4/– | H |
| 0639241+091805 | – | – | – | 13.48 | 0.37 | 0.15 | – | -19.37/– | 5.0/– | H |
| 0639243+095619 | – | – | – | 10.68 | 0.74 | 0.28 | – | -12.91/– | 11.6/– | H |
| 0639245+095040 | – | – | – | 10.63 | 0.26 | 0.07 | – | 85.41/– | 10.4/– | – |
| 0639246+091721 | – | – | – | 12.84 | 0.81 | 0.34 | – | 69.63/– | 6.2/– | – |
| 0639250+095339 | – | – | – | 13.06 | 0.51 | 0.14 | – | 78.26/– | 3.9/– | rdb |
| 0639275+095100 | – | – | – | 11.67 | 0.79 | 0.28 | – | 87.58/– | 12.1/– | – |
| 0639283+095358 | – | – | – | 10.06 | 0.82 | 0.31 | – | 0.78/– | 7.5/– | H |
| 0639287+092640 | – | – | – | 12.40 | 0.28 | 0.16 | – | -2.97/– | 2.5/– | H |
| 0639303+092300 | – | – | – | 12.05 | 0.47 | 0.10 | – | 109.22/– | 10.9/– | – |
| 0639304+094924 | – | – | – | 10.03 | 0.77 | 0.25 | – | -9.34/– | 12.4/– | H |
| 0639311+095330 | – | – | – | 10.32 | 0.28 | 0.08 | – | 4.17/– | 9.8/– | H |
| 0639333+093011 | – | – | – | 13.56 | 0.47 | 0.17 | – | 64.57/– | 4.1/– | – |
| 0639334+094728 | R707 | – | – | 13.36 | 0.40 | 0.20 | – | 37.26/– | 2.0/– | H |
| 0639344+092338 | – | – | – | 12.13 | 0.38 | 0.10 | – | 99.31/– | 4.8/– | – |
| 0639346+092440 | – | – | – | 12.72 | 0.35 | 0.07 | – | 52.81/– | 5.5/– | – |
| 0639373+092637 | – | – | – | 11.47 | 0.63 | 0.17 | – | 39.21/– | 10.2/– | H |
| 0639386+094044 | – | – | – | 12.74 | 1.27 | 0.57 | – | 52.73/– | 2.0/– | – |
| 0639396+094544 | R916 | – | – | 11.98 | 0.62 | 0.19 | – | –/43.05 | –/7.2 | – |
Note. — Hectochelle targets in NGC 2264 found to be non members based on RV measurement. (Stars listed only with R value of cross correlation larger than 2.) For the entire table see the electronic version of the Jurnal, or contact the authors.
2MASS id — identification number from 2MASS catalog (truncated RA and DEC coordiantes as: HHMMSSS+DDMMSS); REBU — id numbers from Rebull et al 2002, AJ123, 1528; REIP — id from Reipurth et al 2004 AJ127, 1117; LAMM — id from Lamm et al 2004 A&A 417, 557; J — 2MASS J magnitude and; (J-H) — 2MASS color index; (J-H) — 2MASS color index;
H — emission detected: c – CTTS; w – WTTS; x – V642 Mon; r – reduction error in 2004 Dec data set, categorized as WTTS in 2004 Mar data;
VRDec/VRMar — heliocentric radial velocity measured 2004 Dec / 2004 Mar; RDec/RMar — R value of cross correlation (see text for details) 2004 Dec / 2004 Mar;
ACCURACY: H – most of the templates gave the same velocity, R value of cross-correlation is high, accurate RV value (typical error km s-1) for one RV measurement; BINARITY: RDB – resolved, double lined binary, with RV at 2 epochs (separated double peak in correlation function); UDB – unresolved double lin. binary, with RV at 2 epochs (blended/side lobed peak, but clear asymmetry in correlation function); rdb – same as for RDB, but only 1 RV measurement; udb – same as for UDB, but only 1 VRV measurement; sb – likely single lined binary, RV at two epochs and at least one suggest membership, some also have emission; hsb – member based on emission detected, but have unusable RV measurement due to low SNR; only three of these have trustable velocities with (see text).