Assessing statistical significance of periodogram peaks
Abstract
The least-squares (or Lomb-Scargle) periodogram is a powerful tool which is used routinely in many branches of astronomy to search for periodicities in observational data. The problem of assessing statistical significance of candidate periodicities for different periodograms is considered. Based on results in extreme value theory, improved analytic estimations of false alarm probabilities are given. They include an upper limit to the false alarm probability (or a lower limit to the significance). These estimations are tested numerically in order to establish regions of their practical applicability.
keywords:
methods: data analysis - methods: statistical - surveys1 Introduction
Analysing astronomical time series, one often has to choose between at least two hypotheses, a base one and an alternative one , based on the existing data array. In the signal detection problem, one should check whether the observations are consistent with some base model or they contain an extra deterministic signal. Under presence of random errors, such problem can be solved in a probabilistic sense only. We are never protected from mistakes of two kinds. They are the false retraction of (the ‘false alarm’) and the false non-retraction of (the false non-detection). False alarms are generally believed to be more dangerous, hence the problem of estimation of the false alarm probability (hereafter ) associated with a candidate signal is very important. Given some small critical value (between and usually), we could claim that the candidate signal is statistically significant (if its ) or is not ().
For the Lomb (1976) – Scargle (1982) periodogram (hereafter also L–S), the base hypothesis is that the observations are pure zero-mean uncorrelated and Gaussian errors (also called the white Gaussian noise). The alternative one is that a sinuous harmonic is also present. Every single value of the L–S periodogram represents a test statistic for the corresponding problem of hypotheses testing. In routine practical cases, however, the period of a possible signal is not known a priory and we have to scan many periodogram values within a wide frequency range. In this case, the is provided by the probability distribution of the maximum periodogram value under the base hypothesis (i.e., without signal in the data). Existing methods of calculating this distribution for a continuous frequency range require time-consuming Monte-Carlo simulations. The aim of the present paper is to propose analytic approximations which could allow to avoid Monte-Carlo simulations (at least in many practical cases). Such approximations of the distribution of the maximum have already been constructed by mathematicians specializing in the field of extreme values of random processes. In the Section 3, these results are adapted for and extended to the specific features of the periodogram analysis of astronomical time series. In the Section 4, numerical simulations are used to explore the quality of the analytic results and to show regions of their practical applicability.
2 General formulations
Let us recover the principles of the periodogram analysis in a somewhat more general formulation than usually.111Several mathematical notations, used in the present paper, are described in the Appendix A.
Let be observations made at epochs . The errors of are assumed to be independent and Gaussian with standard deviations . Each value of the periodogram can be recovered as a test statistic that allows to conclude, how likely is the hypothesis that the data contain a signal of a given frequency . Mathematically we should check, whether the observations are fitted well by some base model having only free parameters , or they require an enlarged model of parameters with parameters of an extra periodic signal. We will assume that for any fixed frequency both models are linear and construct them by means of and base functions forming vectors and . Thus the base fit model is , the model of the signal is and the complete fit model is . We wish to test, whether the hypothesis should be rejected in favour of the alternative .
For the L–S periodogram , , and the signal model is given by a harmonic function (here ). Schwarzenberg-Czerny (1998a, b) considered cases with and arbitrary . Ferraz-Mello (1981) put and added a floating constant term to the harmonic model with , whereas Cumming et al. (1999) accounted also for possible linear trend ().
An optimal statistical test, solving such problem in general, is developed rather well (Lehman, 1979, chapter 7). At first, one should compute the minima (by ) of the function under hypotheses and . This may be done by means of any accessible linear least-squares algorithm (see also Schwarzenberg-Czerny, 1998a, b). If are known precisely, both minima and can be computed and the least-squares periodogram may be defined as an advance in provided by the transition from to :
| (1) |
The error variances are often not known precisely and we have to estimate them from the time series, explicitly or implicitly. It is usually assumed that , where the ‘measured’ uncertainties determine the weighting pattern of the time series, whereas the coefficient is unconstrained. In this case, only the ratio can be computed exactly, and the periodogram (1) has to be modified. We will consider the following modified periodograms:
| (2) |
Here, and are the numbers of degrees of freedom in and , correspondingly. The periodograms and are the well-known normalizations of by variances of residuals under the respective hypotheses. All periodograms (2) are entirely equivalent because they are unique functions of each other:
| (3) |
3 False alarm probability
Let us pick any of the periodograms introduced above, and denote it as . If the frequency of a possible signal was known, the false alarm probability could be retrieved as , where is the cumulative distribution function of (taken under the base hypothesis). Under the hypothesis , the statistic follows a -distribution with degrees of freedom, obeys a Fisher-Snedecor -distribution with and degrees of freedom, and obeys a beta distribution with the same numbers of degrees of freedom (Lehman, 1979, §7.1). Using relations (3), the distribution function of can be derived easily. The corresponding expressions of false alarm probability for are given in Table 1. Note that the third modified periodogram obeys exactly the same distribution as the basic one, if .
Now let us assume that we scan all frequencies from the interval and look for the maximum value . Then the false alarm probability, associated with this maximum, is , where denotes the cumulative distribution function of (under the base hypothesis). Precise expression for the latter distribution is not known even for equally spaced time series. It is always possible to use Monte-Carlo simulations to obtain this function, but this way is very time-consuming, especially for the most important region of low false alarm probabilities (high significances). The function is often computed (Schwarzenberg-Czerny, 1998a, b) as
| (4) |
where is an effective ‘number of independent frequencies’ found within . There is no general analytic expression for the quantity , but it is often suggested to use a short Monte-Carlo simulation to assess it and then extrapolate (4) to low (Cumming, 2004; Horne & Baliunas, 1986). However, the multiple-trial formula (4) is only heuristic and is not necessarily precise even for equally spaced observations which don’t produce significant aliasing.
A better estimation of may be obtained using the theory of stochastic processes. The theory of extremes of random processes is developed in mathematical literature rather deeply. For our aims, it is worth to mention the series of works by Davies (1977, 1987, 2002). This author considered (in rather general formulations) extreme value distributions for , , and beta random processes that may include our periodograms and as special cases. The main result of these works is an analytic lower limit to the corresponding extreme value distributions. This result is potentially very useful for astronomical applications, because it yields directly an upper limit to the false alarm probability and a lower limit to the significance of a candidate periodicity. However, the formulae published in the cited papers are not yet ready for usage and require some adaptation to specific applications. Moreover, these results can be improved to obtain not only an upper limit, but an uniform approximation to the false alarm probability, that would be good for low spectral leakage at least.
A brief description of these results, adapted for the uneven time series analysis, along with detailes of my extensions, is given in the Appendix B. Summarizing them, the ‘Davies bound’ may be written down as
| (5) |
The function will be specified below. If the aliasing effects may be neglected within the frequency band being scanned222This means that the spectral window of the time series has no significant peaks in the doubled frequency band , except for the main one at ., and if also is large enough, then
| (6) |
The right hand side in (5) should approach the false alarm probability more closely for large (even the asymptotic equality under is expected, but not proved strictly yet). In general, the quantity looks like
| (7) |
for the basic least-squares periodogram (1) and like
| (8) |
for the modified periodograms (2). Here the coefficient . Note that the asymptotic holds true for . The factor depends on the bases and , on the time series sampling and on the weighting pattern. Unfortunately, the general form of , obtained in the Appendix B, is not simple. For now, let us restrict ourselves to the L–S periodograms and neglect by aliasing effects. In the next section we will show that such approximation for works well even for strong aliasing. Of course, anyone is welcome to calculate numerically from the formulae given in the Appendix: such work is still much less computationaly expensive than Monte-Carlo simulation of . The practical quality of the expressions (5,6) will be also explored numerically in the next section.
To derive from the formula (29), we should calculate the eigenvalues of the matrix M, which is defined by the group of equalities (26). To perform this, we have to concretize the functions . For the usual L–S periodogram the harmonic base
| (9) |
produces the matrices
| Q | (12) | ||||
| S | (15) | ||||
| R | (18) | ||||
| M | (19) |
If we consider the alias-free case, the terms in (19) containing sine and cosine functions of frequencies are averaged out. Under this approximation , where is the weighted variance of the observational epochs. Then both eigenvalues required are equal to the constant and , where is a rescaled frequency bandwidth and is an effective time series length. If are spanned uniformly and all are equal, then almost coincides with an actual time series span. Table 1 contains the alias-free approximations of for all L–S periodograms considered. One may use these expressions and the ones (5,6) to write down the corresponding alias-free approximation of and its Davies bound. Routinely we deal with rather large values of and . In this case either the factor in (6) or the term in (5) may be safely neglected. For instance, for the usual L–S periodogram
| (20) |
Such alias-free approximations are valid if is well resolved () and if the spectral leakage is low. Only the latter assumption is practically significant. If one worries about strong spectral leakage, the approximate inequality
| (21) |
holds true for the basic L–S periodogram. The relations (20,21) are equally valid if the base model is not empty, but includes a low-order polynomial drift and/or several harmonics of fixed frequencies that may be considered as independent on any frequency within the range being scanned.
| , approximately | ||
|---|---|---|
The factors may be neglected for . If the spectral leakage is low, for realistic values of parameters (see text).
For large , every modified periodogram obeys approximately the same extreme value distribution as the basic one. However, this convergence is not uniform in . It is easy to derive from (7,8) that for the periodograms an extra condition must be satisfied to keep relative errors of low. This condition is rarely satisfied in practice. For the periodogram , a corresponding condition is mild and is often satisfied in practical applications. This fact requires to consider the third modified periodogram more closely. The log-likelihood function of our Gaussian observations is given by
| (22) |
As we adopted , this expression may be rewritten as , where does not depend on . Maximizing by under the hypotheses and yields that the logarithm of the ratio of the corresponding likelihood maxima equals to .
4 Numerical simulations
Let us test the analytic results introduced above. For this purpose, we will use simulations of time series of quasirandom data points imitating the white Gaussian noise. The temporal moments cover a segment of a length . The uncertainties are equal to each other unless otherwise stated. For every simulation discussed below, no less than Monte-Carlo trials were generated ( and were fixed during every such simulation, of course). This should provide accuracies of simulated s about for and about for . The simulated tale of often showed unstable deviations comparable with the false alarm probability.

If the time series consists of large number of equally spaced observations, any aliasing should be negligible. Indeed, in such a case the Davies bound (21) appears very sharp (for ) and the analytic approximation (20) perfectly follows the simulated distribution (Figs. 1,2). However, even time series don’t allow to search frequencies less than the Nyquist one . An uneven time series allows to access much lower frequencies. However, this access cannot be free of any charge. Within a wide frequency range (), an essential aliasing is normally present purely due to random fluctuations of observational moments, even if there is no physical necessity for their gapping. Thus we may expect that for a significant ‘natural’ aliasing should take place. According to the numerical results shown on Fig. 1, the alias-free approximation indeed becomes significantly less precise when decreases, but for large only (say, larger than a few per cent). Even for the loss of precision remains moderate for practically important values of . We can quite use (20) for practical calculations even if is ten times larger than (or even larger, depending on the desirable precision).

When a ‘physical’ spectral leakage is large, the quality of the alias-free approximation depends on the frequency range too. If does not exceed the Nyquist frequency of periodic breaking of observations then the interval is free from aliasing and we may use (20) without significant loss of precision. If the frequency range increases, the model (20) comes off from the real distribution and somewhat overestimates the false alarm probability. Such a simulation is shown in Fig. 3. In this example, the frequency of periodic data breaks corresponds to and the respective Nyquist frequency corresponds to a half of this value ().

Although errors of the alias-free model may become practically significant for some extremal situations, they are not very large and (more important) not fatal. The significance of a candidate periodicity is underestimated, what does not favour to false alarms. The aliasing may only decrease the detectability of low-amplitude signals (if numerical simulations are not used). In this case, the error of the threshold level (i.e., the critical level , corresponding to a given ) is more important. Examining Fig. 3 yields that the relative shift does not exceed for . As an amplitude of corresponding signal scales as , this turns into only relative error of an amplitude threshold. Remind, that this offset corresponds to a very strong aliasing. Such spectral leakage takes place, for instance, for the sequence of observations that are made during days with only night hours in a day, or during years with only observational months in a year.


Note that the multiple-trial formula (4) can work well in restricted regions only. When constructed from a short Monte-Carlo simulation, it can fit well the centre of the distribution (i.e., large s), but fails to fit low s. This takes place even for negligible aliasing. The spectral leakage perturbs strongly the distribution centre but affects weakly its high-significance tail. Hence, any multiple-trial models constructed from short Monte-Carlo simulations cannot be extrapolated to the most important region of low false alarm probabilities. Such extrapolation overestimates statistical significances of candidate periodicities, what favours to false alarms.


The last pair of Monte-Carlo simulations in this paper deals with real astronomical time series. I used epochs and standard errors of and radial velocity measurements of the stars 51 Pegasi and 70 Virginis, obtained with ELODIE spectrograph (Naef et al., 2004)333Note that both stars 51 Peg and 70 Vir have a planetary companion (Mayor & Queloz, 1995; Marcy & Butler, 1996).. These time series are not even. For the star 51 Peg, the effective time series length yrs is close to the actual one yrs, but the spectral window (Fig. 4) shows several high peaks indicating periodic gapping of observations. For the star 70 Vir, the time series has yrs, yrs and posesses a more ‘noisy’ spectral window (Fig. 5) indicating significant natural aliasing. In the first case, the simulated extreme value distributions for the L–S periodogram don’t show large deviations from alias-free models (relative error and for ). In the second case, the simulated may be two times less than its alias-free approximation, but this still may be tolerated because (again for ). Note that the both time series possess a strong leakage with one day period. Such gapping affects extreme value distributions for days only. In the case of 51 Peg, this aliasing could introduce a significant error in for unrealistic frequency ranges (say, for days). In the case of 70 Vir, the respective deviation is enforced by low number of observations, what leads to rather large errors of already for day. Note also that in the both cases the errors of alias-free approximations decrease significantly when drops to the values .
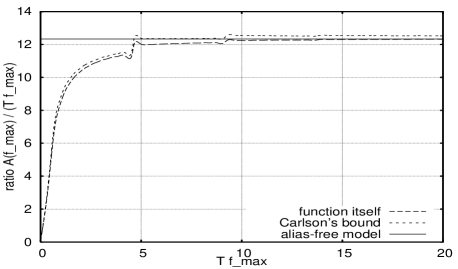
At last, we need to consider the quality of the alias-free approximation for the factor . Fig. 6 shows a graph of the ratio along with graphs of its alias-free approximation and upper Carlson bound (see Appendix B). The observations were spanned in the same way as for Fig. 3. The spectral leakage appears only in small splashes near the Nyquist frequency of the periodic data breaks and near its overtones (i.e., at ). For , the function is well approximated by the alias-free model regardless the strong aliasing.
5 Conclusions
The problem of estimating statistical significance of periodogram peaks is discussed in the paper. The results published in the field of extreme values of random processes are adapted for and extended to the periodogram analysis of astronomical time series. For the Lomb–Scargle periodogram and its modifications the corresponding extreme value distributions are given by a closed formulae being ready for usage. If the spectral leakage cannot be neglected, the similar expressions provide upper limits to the false alarm probability (or lower ones to the significance).
It is established numerically that the region of validity of these approximations is large and has no sharp boundaries. Even if the aliasing is very strong, the error of the analytic estimation of false alarm probability does not favour false alarms and thus is not fatal. For strong aliases, the usage of this analytic approximation slightly decreases the sensitivity to low-amplitude signals. However, the respective increasing of amplitude thresholds should not exceed several per cent in the worst practical cases (like a strong aliasing enforced by lack of observations).
These results may be very useful in a wide variety of astronomical applications. They would be useful especially for systematic surveys that deal with large amounts of data consisting of many separate time series. Indeed, it would be very difficult and even impossible to perform Monte-Carlo simulation for every of such time series. Vice versa, it is easy to use simple analytic formulae (20,21) or their analogs for the modified L–S periodograms. This will eliminate the need for Monte-Carlo simulations in the cases when the observed periodogram peak exceeds the adopted threshold and in the opposite cases when this peak is lower than this threshold by more than, say, . The rare intermediate cases are easy to be studied by means of Monte-Carlo simulations. It is also admissible not to use numerical simulations at all, especially for large datasets (). In this case, the number of undetected low-amplitude periodicities may be increased by a negligible quantity only.
Acknowledgments
I would thank Drs. V.V. Orlov, K.V. Kholshevnikov, L.P. Ossipkov and the anonymous referee for critical reading of this paper, fruitful suggestions and linguistic corrections. This work is supported by the Russian Foundation for Basic Research (Grants 05-02-17408, 06-02-16795) and by the President Grant NS-4929.2006.2 for the state support of leading scientific schools.
References
- Azaïs & Wschebor (2002) Azaïs J.-M., Wschebor M., 2002, in Sidoravicius V., ed., In and Out of Equilibrium: Probability with a Physics Flavor. Vol. 51 of Prog. Prob., The distribution of the maximum of a Gaussian process: Rice method revisited. Birkhäuser book, Boston, pp 321–348
- Cumming (2004) Cumming A., 2004, MNRAS, 354, 1165
- Cumming et al. (1999) Cumming A., Marcy G. W., Butler R. P., 1999, ApJ, 526, 890
- Davies (1977) Davies R. B., 1977, Biometrika, 64, 247
- Davies (1987) Davies R. B., 1987, Biometrika, 74, 33
- Davies (2002) Davies R. B., 2002, Biometrika, 89, 484
- Ferraz-Mello (1981) Ferraz-Mello S., 1981, AJ, 86, 619
- Horne & Baliunas (1986) Horne J. H., Baliunas S. L., 1986, ApJ, 302, 757
- Kratz (2006) Kratz M. F., 2006, Probability Surveys, 3, 230
- Lehman (1979) Lehman E. L., 1979, Testing Statistical Hypotheses [Russian translation]. Nauka, Moscow
- Lomb (1976) Lomb N. R., 1976, Ap&SS, 39, 447
- Marcy & Butler (1996) Marcy G. W., Butler R. P., 1996, ApJ, 464, L147
- Mayor & Queloz (1995) Mayor M., Queloz D., 1995, Nature, 378, 355
- Naef et al. (2004) Naef D., Mayor M., Beuzit J. L., Perrier C., Queloz D., Sivan J. P., Udry S., 2004, A&A, 414, 351
- Scargle (1982) Scargle J. D., 1982, ApJ, 263, 835
- Schwarzenberg-Czerny (1998a) Schwarzenberg-Czerny A., 1998a, MNRAS, 301, 831
- Schwarzenberg-Czerny (1998b) Schwarzenberg-Czerny A., 1998b, Baltic Astron., 7, 43
- Tee (2005) Tee G., 2005, New Zealand Journ. Math., 34, 165
Appendix A Several notations
Let us introduce the following averaging operations:
with being the error variance at the observational epoch . The function may be defined at the set of only, that is to be a discrete sequence. The quantity may be treated as a scalar product in the Hilbert space (Schwarzenberg-Czerny, 1998a).
All vectors are assumed to be column ones by default. The notation corresponds to a column vector formed by the quantities inside the braces. Similarly, is a vector constituted by elements of the vectors
I is the identical matrix.
denotes the transpose of a matrix or a vector.
If is a vector then is a matrix constituted by the pairwise products .
is the joint probability density of the random variables and is the same joint probability density, taken in the point .
Appendix B Rice method and periodograms
In the so-called ‘Rice method’, one considers an integer random variable , the number of up-crossings of a given level by the random process within . The distribution function of the maximum can be represented by the expansion
| (23) |
where and being the conditional factorial momenta of under condition that . Let being the unconditional factorial momenta of . The quantities and are explicitly expressed in terms of the so-called ‘Rice formulae’. For instance,
| (24) | |||
| (25) |
where being the joint probability density of and , both taken at the same frequency , and being the joint probability density of the pairs . For details on the Rice method and further references see the paper by Azaïs & Wschebor (2002).
The expected number of up-crossings plays an important role in what follows. For the sake of convenience, we introduce the synonymous notation . Exact analytic expressions of for the periodograms and may be derived from results by Davies (1977, 1987, 2002). Actually, Davies dealt with the case when the weights of measurements are equal to each other. Nevertheless, his results may be directly extended to the unequal weights. The quantity provides not only the upper bound (5) on the false alarm probability, but also yields its asymptotic representation for large (low ) levels. Unfortunately, the asymptotic character of the Davies bound was strictly proved only for restricted families of random processes, such as stationary Gaussian and stationary ones. Nevertheless, this asymptotic seems to be non-specific to the distribution of the process values and to the strict stationariness (see references and discussion in the cited works by Davies and in the review by Kratz (2006)). Hence, we may expect the asymptotic character of (5) for all of our periodograms. Note that the periodogram may be treated as a random process, as an process, and as a beta process, according to Davies (2002).
The high-order Rice formulae are significantly more complicated with respect to the first-order one. We will not compute here the high-order Rice terms for our periodograms in general case. However, the calculations are essentially simplified if the long-distance correlations of the periodogram may be neglected (equivalently, the aliasing is negligible). Indeed, under the approximation stated the density may be factorized as for all frequencies except for the narrow vicinities of the diagonals . This property allows us to obtain that if is large enough to be resolved by the periodogram well, the relations hold true. Then the extreme value distribution of is given by (6). An alternative way to obtain the latter expression is to assume a Poisson distribution for (Kratz, 2006).
The factor in equalities (7,8) determines the dependence on the frequency range (so-called bandwidth penalty). Before considering it, let us denote and define the matrices
| (26) |
In general, all these matrices, except for the matrix , depend on the frequency. Note the relations and . The definitions (26) look rather bulky, but they are essentially simplified under certain conditions. For example, if the base functions for any are orthogonal to the functions , then and the matrices in (26) labelled with a tilde are equal to the same matrices without tilde mark. Also if the base is orthonormal for any , then , and . The last matrix is necessarily positively definite and possesses the positive eigenvalues . In fact, we need below only these eigenvalues. They satisfy the characteristic equation .
The factor appears implicitly in the papers by Davies after integration of the mathematical expectation by , where the random vector is Gaussian with zero mean and statistically independent componets having . Davies (1987) gave some exact and approximate integral formulae for this expectation. I present here (in terms of the factor ) a number of new integral representations that may be useful in practice. The first two may be derived easily and are given by
| (27) |
where denotes an infinitesimal solid angle in , directed by the unit-length integration vector . The integration in the first formula is performed over all possible directions within the whole space solid angle . Note that the matrix M may be diagonalized by means of a solid-body rotation of , so that and the function is determined by the eigenvalues only. Inner integrals in (27) are equal to each other. They may be expressed in terms of the (hyper)area of an ellipsoidal (hyper)surface in dimensions, having semi-axes . Indeed, changing the integration variable in the inner integral in the second of equations (27) as , then () and integrating by we obtain
| (28) |
It can be directly checked that the integrand in the last expression represents an infinitesimal (within ) area element on the surface , and equals to its total area. It is not hard to show that . The circumference of an ellipse, , and the usual surface area of an ellipsoid, , can be expressed by means of elliptic integrals (complete and incomplete, respectively). For an Abelian integral can be used to compute (Tee, 2005). There are useful inequalities for , e.g. the Carlson’s one bounds the inner integrals in (27) by the quantity . Finally,
| (29) |
The latter inequality seems to be very sharp in practical situations (Fig. 6). Note also, that if every then .