The link between chemical anomalies along the red giant branch and the horizontal branch extension in globular clusters
Abstract
We find a strong correlation between the extension of the Na-O anticorrelation observed in red giant branch (RGB) stars and the high temperature extension of the horizontal branch (HB) blue tails of Galactic globular clusters (GCs). The longer is the O-depleted tail of the Na-O anticorrelation observed in the RGB stars, the higher is the maximum temperature reached by the bluest HB stars in the GC. This result provides a clear, empirical evidence of a link between the extension of the HB and the presence of star-to-star abundance variations of proton-capture elements in GC stars. We discuss the possible interpretation of this correlation.
Subject headings:
stars: abundances — stars: evolution — globular clusters: general1. Introduction
Since more than thirty years, we know that globular cluster (GC) stars show a dispersion in the content of light elements like C, N, O, Na, Mg, Al. The lightest C and N are anticorrelated both in field and cluster stars (Smith & Martell 2003). The environment of GCs must be responsible for the bulk of chemical anomalies observed among stars in GCs (at odds with field stars, Gratton et al. 2000), where the heavier proton-capture elements are anticorrelated (Na vs O and Mg vs Al, respectively; see Gratton, Sneden, & Carretta 2004 for extensive references).
The theoretical background (e.g. Denisenkov & Denisenkova 1990, Langer et al. 1993) points to the simultaneous run of the CNO, NeNa and MgAl cycles of H-burning at high temperature. In turn, this implies that the observations of the same anticorrelations in unevolved cluster stars (Gratton et al. 2001; Ramirez & Cohen 2002; Carretta et al. 2004, 2005; Cohen & Melendez 2005) can be explained only if the involved proton-reactions occurred in more massive stars of a previous generation than the presently observed one, and the anomalies concern a large fraction of the stellar structure, non simply a surface layer (Cohen et al. 2002). Multiple star formation episodes in GCs have eventually been directly observed in the form of a main sequence split in Centauri (Bedin et al. 2004) and NGC 2808 (Piotto et al. 2007), and in a subgiant branch split in NGC 1851 (Milone et al. 2007).
Red giant branch (RGB) stars with both normal and anomalous composition must eventually end up on the Zero Age Horizontal Branch (ZAHB) after the onset of core He-burning, and we might expect to track their different chemical signatures in the ensueing evolution. On one hand, the horizontal branch (HB) phase is an ideal locus to investigate the effects of chemical anomalies on the stellar structure, as it acts as an amplifier of the physical conditions consequent to the star’s previous evolution. On the other hand, the location of stars onto the ZAHB is sensitive to a number of secondary parameters (age, CNO composition, helium content, rotation etc, see e.g., Fusi Pecci et al. 1993) beside the main parameter, metallicity, to make it difficult to disentangle the contribution of the single one. A combination of these parameters actually conspire to give a variety of HB morphologies.
Recently, Recio-Blanco et al. (2006; hereafter RB06) provided a quantitative estimate of the temperature extent of the HB by using the homogeneous set of color-magnitude diagrams (CMDs) of the HST snapshot program by Piotto et al. (2002). RB06 found a significant correlation between the HB extension and the cluster total mass. They interpreted this correlation as an observational evidence of self-pollution, assuming, as suggested by D’Antona et al. (2002), that the factor responsible for the HB extension might be an He enhancement predicted to accompany the observed CNONaMgAl star-to star abundance variations on the RGB.
In this Letter we present a tight and direct empirical correlation between the maximum temperature along the ZAHB and the extent of the Na-O and Mg-Al anticorrelations, as defined by Carretta (2006), and discuss its implications.
2. The data sample
The parameter (HB) was defined in RB06 as the maximum temperature reached by HB stars in each cluster. Briefly, ZAHB models by Cassisi et al. (1999) were fitted to the CMDs of 54 GCs from the snapshot survey by Piotto et al. (2002). The RB06 parameter well compares with similar quantities, such as the HB length (, see Fusi Pecci et al. 1993), but it has the advantage of having been extracted from a photometrically homogeneous catalog of CMDs. Table 1 lists the (HB) values for the subset of clusters discussed in the present paper.
To give a quantitative definition of the extension of the anticorrelations observed among RGB stars, Carretta (2006) proposed to use the interquartile range (IQR) of the [O/Na] and [Mg/Al] abundance ratios. This quantity (see Cleveland 1993 for a description of the technique) is especially useful for indicating whether a distribution is skewed and whether there are potential outliers.
The IQR values for the [O/Na] and, when available, [Mg/Al] ratios come from three sources. Those for NGC 362, NGC 5904 (M 5), NGC 6205 (M 13), NGC 6838 (M 71), and NGC 7078 (M 15) are taken from Carretta (2006), who used the largest samples available in literature from high-resolution spectroscopic analysis. The original data sources are given therein and not repeated here. A second set of values is derived (only for IQR[O/Na]) from the very large samples recently analyzed by our group using FLAMES-GIRAFFE spectra. These are available for NGC 2808 (90 stars, Carretta et al. 2006), NGC 6441 (25 stars, Gratton et al. 2007), and NGC 6218 (M 12, 90 stars, Carretta et al. 2007a). To this GIRAFFE subsample we add NGC 6388 (Carretta et al. in preparation), with about 30 stars observed. Since for that program and instrumental set up (see Carretta et al. 2006 for details) only O and Na abundances are available, we adopt for NGC 2808 the value of IQR[Mg/Al] based on the 19 FLAMES-UVES spectra analyzed by Carretta (2006). The third set of values for IQRs of both [O/Na] and [Mg/Al] is taken from the analysis (Carretta et al. in preparation) of FLAMES-UVES spectra taken simultaneously with the GIRAFFE spectra: for the present paper we computed the IQRs for NGC 104 (47 Tuc), NGC 1904 (M 79), NGC 3201, NGC 4590 (M 68), NGC 6397, NGC 7099 (M 30). The IQR for [Mg/Al] in NGC 6218 is also derived from this analysis. In this case, numbers are more limited, with a maximum of 14 stars in each cluster.
Appropriate Monte-Carlo simulations show that uncertainty estimates for the IQRs due the stochastic errors is given by the ratio between the inter-quartile value divided by the square root of the number of stars used to derive the relation, times a factor quite close to 1 which depends on the shape of the distribution (e.g. it is 1 for a uniform distribution and 1.17 for a Gaussian distribution). For [O/Na], the typical uncertainties in IQR’s range from 0.07 dex (NGC6397), to 0.33 dex (NGC1904), with a median value of 0.15 dex. Similar values are obtained for [Mg/Al].
Values of IQRs of [O/Na] and [Mg/Al] ratios, the adopted metallicity [Fe/H], and the source of data are listed in Table 1, together with total visual luminosity and HB ratio parameter HBR=(B-V)/(B+V+R) taken from the updated version of the Harris (1996) catalog. The normalized age parameter comes from the compilation of De Angeli et al. (2005).
3. A strong link between the Na-O anticorrelation and the maximum temperature in HB
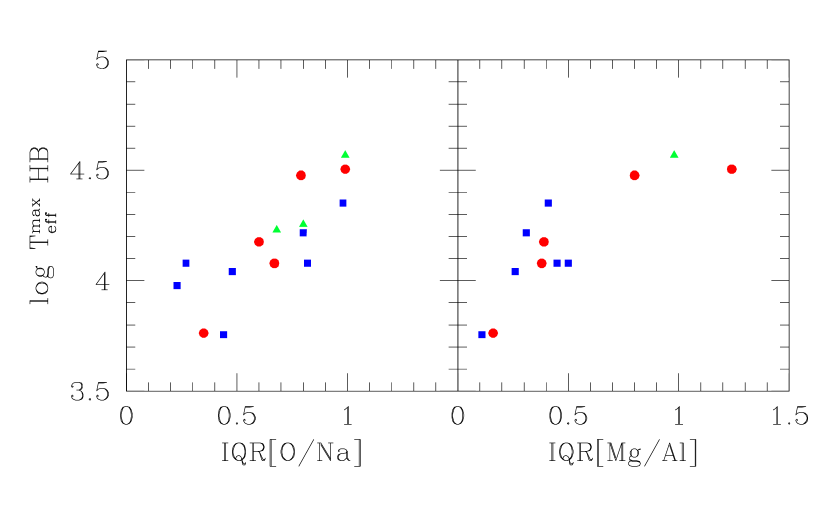
In Fig. 1, the maximum temperature reached along the HB in each cluster is plotted as a function of the IQR parameter for the NaO and MgAl distributions. Interestingly enough, the resulting correlations are very tight, comparable to the bivariate correlations found with metallicity and total luminosity by RB06 (see e.g., their Fig. 8). The Spearman rank correlation coefficient is for the correlation with IQR[O/Na] (15 clusters) and with IQR[Mg/Al] (12 clusters). The one-tailed test gives a negligible probability that this is a mere chance result (e.g., for [O/Na]).
Fig. 1 provides: (i) a clear empirical evidence of a link between the amount of abundance variations and the length of the blue HBs, with clusters with more pronounced Na-O (and simultaneous Mg-Al) anticorrelations having HBs reaching higher temperatures in their blue tails and (ii) it tells us that the IQR value contains in itself as much physical information as the combined effect of total mass and metallicity (see RB06). How can these unequivocal observational facts be explained?
RB06 found that more massive clusters tend to show HBs more extended to higher temperature. This is well understood as a better capability of deeper potential wells to retain ejecta from stars in a self-pollution scenario, which is the currently most popular way to explain the observed cluster abundance variations (see, e.g., D’Antona et al. 2002, Gratton et al. 2004, Carretta et al. 2005). He enhancement is expected to be present in the stars born out from the gas composed by a mixture of un-processed and polluted matter coming from a previous generation of stars. The most favourite classes of candidate polluters (namely, fast rotating massive main sequence stars, Decressin et al. 2007, and intermediate-mass AGB stars, D’Antona et al. 2002) can both potentially pollute the existing interstellar material with products of complete CNO burning, including He. In this framework, D’Antona et al. (2002) invoked a spread of He as the key ingredient to naturally reproduce the whole HB morphology in GCs.
The implied bottom line is that there must be a one-to-one correspondence between the chemical composition of stars on the RGB and their successive location on the HB, in the sense that He enhancement should also provide the needed difference in the mass of He-burning stars required to spread them from the red HB (stars with normal composition) to the hottest part of the HB (stars with extreme abundance alterations). The correlation of Fig. 1 seems to confirm this idea, but also highlights other important pieces of information which needs further investigation, and which will help to better understand the effects of chemical anomalies resulting from the pollution scenario.
We start by noting that the linear correlation in Fig. 1 is even more significant than the monovariate relation between the HB extension and the total mass found by RB06. This is not entirely unexpected, since total mass should be used only as a good of the effect of self-enrichment in GCs, because the dynamical evolution of a GC is also related to its interaction with the Galactic potential. Not surprisingly, Carretta (2006) showed that the best correlations involving the IQR values were not with the total mass, but with the cluster orbital parameters. This can be well explained by comparing the typical orbital periods in the Galaxy and the typical timescales involved in the release of yields by candidate polluters: both are of the order of a few yrs, depending on the mechanism responsible for the pollution. It follows that GCs with eccentric orbits may spend long periods of time relatively undisturbed by bulge and/or disk shocks, and by interactions with the giant molecular clouds in the Galactic disk. Therefore, they have enough time and can efficiently use their whole gas content to build up a second stellar generation. On the other hand, GCs in less eccentric orbits and with shorter periods are more affected by passages through the Galactic disk or bulge, with consequent shocks and gas removal.
The present-day total mass is only a lower limit for the cluster original mass, and not necessarely correlated with the gas reservoir at the time when GCs begun to form a second star generation from polluted matter. Therefore, a simple mass vs extension of chemical anomalies relation cannot fully account for the GC evolutionary history, and not necessarely a larger mass should always be associated to a more pronounced Na-O anticorrelation.
Furthermore, Carretta et al. (2007b) pointed out that a direct one-to-one correspondence between the amount of He pollution and HB morphology is not subtantiated (see their Fig. 5 and related discussion). Hence, the effect of self pollution must be more complicated, and additional mechanisms must be at work, as we will outline below.
Here we propose a different interpretation of the strong empirical link found between the dispersion in light element abundances and the hottest part of the HB.
Let us consider the case of NGC 2808, where Sandquist & Martel (2007) recently found a clear deficit of bright giants on the RGB. A likely explanation is that extreme mass loss for a fraction of stars near the tip of the RGB may reduce the envelope mass below a critical threshold, and that these stars may interrupt their RGB evolution well below the tip, igniting core He-burning only at higher temperature (hot He-flashers, Castellani & Castellani 1993). As a consequence, they end up on a very hot ZAHB location, contributing to build up a conspicuous blue tail on the HB. We propose that these stars with extreme mass loss are also the stars with the extreme values of the Na-O anticorrelations. We do not observe them close to the tip of the RGB simply because they already evolved out of the RGB.
Are there any other observational facts supporting this interpretation? The comparison of M 13 and NGC 2808 is illuminating, in this respect. It is well known that the most O-depleted giants in M 13 are also among the brightest ones, all near the RGB-tip (Sneden et al. 2004). On the other hand, in NGC 2808, such a trend is not observed. Carretta et al. (2003) found no significant variations in Na abundances as a function of magnitude in a sample of about 90 stars, from the bump level up to the RGB-tip in NGC 2808; the same behaviour is seen also for O abundances (Carretta 2006). When coupled to the deficit of bright giants in NGC 2808 noted by Sandquist & Martel, the inference from this comparison is that in M 13 we are probably seeing the most He-poor among the Na/He-enhanced stars that we can actually observe. We propose that He self-pollution probably reached even higher levels in NGC 2808, so high that stars with most extreme composition left the RGB well in advance of approaching the classical tip level. They were able to decrease their envelope masses, experience an hot He-flash, and contribute to the clump of blue, extremely hot HB stars of this cluster, which is not present at all in M13.
Our proposed scenario might account for cases where the difference between the ratio of super O-poor stars on the RGB with respect to normal composition stars is smaller than the ratio of stars on the EHB with respect to global blue HB population in each cluster (see the case of NGC6752: Carretta et al. 2007b). As a caveat, we remind that close binaries evolving through the common envelope phase should be also taken into account as potential members of the EHB. This mechanism explains the EHB field stars (the so-called B subdwarfs). However, the relative weight of this source of EHB stars in GCs should be small, because direct observations of hot HB stars by Moni Bidin et al.(2007) revealed that the binary fraction among hot EHB clump is low, at least in NGC 6752. Finally, even stars of more normal composition making up the classical tip He-flash but with individual mass loss at the high extreme of the average mass loss range in clusters (MM⊙, with a M⊙, Lee, Demarque & Zinn 1994), might end on the EHB.
Finally, as shown by Carretta (2006), and confirmed by the extended sample of Table 1, there is no correlation between the Na-O and Mg-Al chemical variations and the HBR parameter. In the present paper we show a strong link between the extension of the chemical anticorrelation and the extension of the HB. Apparently, the signature of non-standard chemical composition affects the HB extension towards hot temperatures (low envelope masses), but much less the overall distribution of the stars along it. Other parameters must contribute to the global shape (temperature distribution) of the HB, and presumably also to the total extension.
This conclusion is confirmed by the correlations between age and the relevant parameters in Table 1: we found a rather good correlation of age with the HBR parameter (correlation -0.51), but only a weak dependence of the HB maximum temperature on age (correlation -0.09). This strenghtens our proposed scenario, by defining in a quantitative way that most of the effect on the extreme blue HB is due to abundance variations and to metallicity. The role of age in shaping the hottest part of the HB seems to be only a secondary effect, while it seems to have a more significant effect on the overall distribution of stars from the red to the blue ends of the HB.
In summary, we found a very strong correlation linking the pattern of chemical variations observed for proton-capture elements in globular cluster red giants and the highest temperature that stars may reach on the ZAHB. A viable mechanism is enhanced mass loss on the RGB for stars with extreme anomalies in composition; this may decrease their envelope mass below a critical threshold and, after onset of core He-burning in a hot flash, may force the star to spend the following HB lifetime at very high temperature. The deficit of bright giants observed in NGC 2808, as well as the lack of any luminosity dependence for O-variations in this cluster are naturally accounted for in our interpretation. We believe that the present correlation is an important step forward to define and quantify the link between abundance variations (likely arising in the first phases of star formation) and the HB morphology.
References
- (1) Bedin, L., Piotto, G., Anderson, J., Cassisi, S., King, I.R., Momany, Y., Carraro, G. 2004, ApJ, 605, L125
- (2) Carretta, E. 2006, AJ, 131, 1766
- (3) Carretta, E., Bragaglia, A., Cacciari, C., & Rossetti, E. 2003, A&A, 410, 143
- (4) Carretta, E., Bragaglia, A., Gratton R.G., Leone, F., Recio-Blanco, A., Lucatello, S. 2006, A&A, 450, 523
- (5) Carretta, E., Bragaglia, A., Gratton, R.G., Lucatello, S. Momany, Y. 2007b, A&A, 464, 927
- (6) Carretta, E., Gratton, R.G., Bragaglia, A., Bonifacio, P., & Pasquini, L. 2004, A&A, 416, 925
- (7) Carretta, E., Gratton, R.G., Lucatello, S., Bragaglia, A., Bonifacio, P. 2005, A&A, 433, 597
- (8) Carretta, E. et al. 2007a, A&A, 464, 939
- (9) Cassisi, S., Castellani, V., Degl’Innocenti, S., Salaris, M., Weiss, A. 1999, A&AS, 134, 103
- (10) Castellani, V., Castellani, M. 1993, ApJ, 407, 649
- (11) Cleveland, W. 1993, in “Visualizing data”, Hobart Press, Summit, New jersey, USA, 1993
- (12) Cohen, J.G., Briley, M.M., Stetson, P.B. 2002, AJ, 123, 2525
- (13) Cohen, J.G. & Melendez, J. 2005, AJ, 129, 303
- (14) D’Antona, F., Caloi, V., Montalban, J., Ventura, P., Gratton, R. 2002, A&A, 395, 69
- (15) De Angeli, F., et al. 2005, AJ, 122, 3171
- (16) Decressin, T., Meynet, G., Charbonnel C. Prantzos, N., Ekstrom, S. 2007, A&A, 464, 1029
- (17) Denisenkov, P. A., & Denisenkova, S. N. 1990, Soviet. Astron. Lett., 16, 275
- (18) Fusi Pecci, F., Ferraro, F., Bellazzini, M., Djorgovski, S., Piotto, G., Buonanno, R. 1993, AJ, 105, 1145
- (19) Gratton, R.G., Sneden, C., & Carretta, E. 2004, ARA&A, 42, 385
- (20) Gratton, R.G., Sneden, C., Carretta, E., & Bragaglia, A. 2000, A&A, 354, 169
- (21) Gratton, R.G., et al. 2001, A&A, 369, 87
- (22) Gratton, R.G. et al. 2007, A&A, 464, 953
- (23) Harris, W. E. 1996, AJ, 112, 1487
- (24) Langer, G. E., Hoffman, R., & Sneden, C. 1993, PASP, 105, 301
- (25) Lee, Y., Demarque, P., Zinn, R. 1994, ApJ, 423, 248
- (26) Milone, A.P. et al. 2007, ApJ, in press
- (27) Moni Bidin, C., Moehler, S., Piotto, G., Momany, Y., Recio-Blanco, A. 2007, A&A, in press [arXiv: 0708.1521]
- (28) Piotto, G. et al. 2002, A&A, 391, 945
- (29) Piotto, G., et al. 2007, ApJ, 661, L53
- (30) Ramirez, S. & Cohen, J.G. 2002, AJ, 123, 3277
- (31) Recio-Blanco, A., Aparicio, A., Piotto, G., De Angeli, F., Djorgovski, S.G. 2006, A&A, 452, 875
- (32) Sandquist, E.L., Martel, A.R. 2007, ApJ, 654, L65
- (33) Smith, G.H., Martell, S.L. 2003, PASP, 115, 1211
- (34) Sneden, C., Kraft, R.P., Guhathakurta, P., Peterson, R.C., Fulbright, J.P. 2004, AJ, 127, 2162
| GC ID | (HB) | [Fe/H] | N.age | HBR | IQR[O/Na] | IQR[Mg/Al] | source | |
|---|---|---|---|---|---|---|---|---|
| NGC 0104 | 3.756 | 0.76 | 9.42 | 0.97 | 0.99 | 0.44 | 0.11 | Carretta et al. (in prep) |
| NGC 0362 | 4.079 | 1.16 | 8.40 | 0.74 | 0.87 | 0.67 | 0.38 | Carretta (2006) |
| NGC 1904 | 4.352 | 1.57 | 7.86 | 0.90 | +0.89 | 0.98 | 0.41 | Carretta et al. (in prep) |
| NGC 2808 | 4.568 | 1.15 | 9.36 | 0.77 | 0.49 | 0.99 | 0.98 | Carretta et al. (2006) |
| NGC 3201 | 4.079 | 1.58 | 7.49 | 0.77 | +0.08 | 0.82 | 0.45 | Carretta et al. (in prep) |
| NGC 4590 | 4.041 | 2.06 | 7.35 | 0.92 | +0.17 | 0.48 | 0.26 | Carretta et al. (in prep) |
| NGC 5904 | 4.176 | 1.27 | 8.81 | 0.83 | +0.31 | 0.60 | 0.39 | Carretta (2006) |
| NGC 6205 | 4.505 | 1.54 | 8.70 | 1.05 | +0.97 | 0.99 | 1.24 | Carretta (2006) |
| NGC 6218 | 4.217 | 1.48 | 7.32 | 0.94 | +0.97 | 0.80 | 0.31 | Carretta et al. (2007a) |
| NGC 6388 | 4.255 | 0.60 | 9.82 | 0.80 | Carretta et al. (in prep) | |||
| NGC 6397 | 3.978 | 1.95 | 6.63 | 1.00 | +0.98 | 0.23 | Carretta et al. (in prep) | |
| NGC 6441 | 4.230 | 0.53 | 9.47 | 0.68 | Gratton et al. (2007) | |||
| NGC 6838 | 3.763 | 0.73 | 5.56 | 0.91 | 1.00 | 0.35 | 0.16 | Carretta (2006) |
| NGC 7078 | 4.477 | 2.26 | 9.17 | 0.94 | +0.67 | 0.79 | 0.80 | Carretta (2006) |
| NGC 7099 | 4.079 | 2.12 | 7.43 | 1.08 | +0.89 | 0.27 | 0.50 | Carretta et al. (in prep) |