Fluctuation of the download network
Abstract
The scaling behavior of fluctuation for a download network which we have investigated a few years ago based upon Zhang’s Encophysics web page has been presented. A power law scaling, namely exists between the dispersion and average flux of the download rates. The fluctuation exponent is neither 1/2 nor 1 which was claimed as two universal fluctuation classes in previous publication, instead it varies from 1/2 to 1 with the time window in which the download data were accumulated. The crossover behavior of fluctuation exponents can be qualitatively understood by the external driving fluctuation model for a small-size system or a network traffic model which suggests congestion as the origin.
pacs:
89.75.Hc, 89.75.Da, 89.40.DdMany phenomenological and statistical analysis have been made for the complex networks BA1 ; Dor . In those researches, most studies focused on the long-time behavior of a certain complex network. In this sense, the feature of the network corresponds to its static characteristic. However, time evolution of the network topology is also very important. During its evolution, the network nodes experience different traffic flux time by time and the fluctuation is unavoidable. Actually, fluctuation is a universal phenomenon which exists in many different fields, such as nuclear fragmentation or hadron production Botet ; Ma2 ; Gul , which can also be related to the critical behavior or self-organized criticality. For instance, the dispersion () of an order parameter, such as the charge of the largest fragments in nuclear fragmentation, shows a transition from (the ordered phase) to (the disordered phase) when the multifragmentation phase transition takes place in hot nuclear system Botet ; Ma2 (here is the average of the order parameter). For network dynamics, recently, Menezes and Barabási investigated the fluctuation in a number of real world networks, which includes internet, river network, microchip, WWW and highway network dynamics and presented a model to understand the origin of fluctuation in traffic process Bara . They found that the fluctuation is dominantly driven by either internal or external dynamics of the complex system Bara . In their studies, they found there is a power-law scaling for the dispersion and the average flux, namely , and there are two classes of universality for real systems. In the Internet and the computer chip there is robust internal dynamics which leads to the fluctuation exponent = 1/2, while highway and Web traffic are driven by external demand which leads to the fluctuation exponent = 1. Authors use a stylized model of random walkers throughout network, they thought what is probably one of the most important factors in the traffic dynamics on networks is the limited capacity of nodes to handle packets simultaneously, which leads to pack-pack interaction and induce large fluctuations or even network congestion. However, a recent study on scaling of fluctuation in internet traffic shows that the fluctuation is different from 1/2 which was claimed in the above papers. They developed a model where the arrival and departure of ”packets” follow exponential distribution, and the processing capability of nodes is either unlimited or finite was proposed by Duch and Arenas Duch . This model presents a wide variety of exponents between 1/2 and 1, revealing their dependence on the few parameters considered, and questioning the existence of universality classes. Hence it seems that the universal classes of fluctuation scaling for network dynamics are far from reaching consensus and therefore it is worthy to further investigate what about the fluctuation behavior in other real networks. Neverthless, so far there are few analysis on the fluctuation behavior of other specific networks rather than the networks which have been investigated in Ref. Bara ; Duch . In this work, we will investigate the network evolution and fluctuation based on our previous study of the download network.
In our previous work in 2004 Han , we reported, for the first time, that the download frequency of the papers in a web page is also a scale-free network. Its rank-ordered download distribution can be described by the Zipf law Zipf_law ; Ma1 or Tsallis’ non-extensive entropy Tsa . The data set of the download rates comes from a well constructed web page in the field of economical physics (so-called Econophysics) by Zhang since 1998 Zhang_web . Furthermore, the mechanism of network growth was explained by the preferential attachment network model of Barabasi and Albert. Since three years have passed after this network analysis, it is of interesting to see how this network evolves and how about the fluctuation of download rate.
Firstly let us see some plots of rank distributions of the download numbers from the data on 2004/08/31 to 2007/07/29 which is shown in Fig. 1. Roughly, rank distribution are almost linear in double logarithm plots and they can be described by the Zipf law Zipf_law
| (1) |
where the is the Zipf law exponent. Zipf’s law or scale free networks is different from the predictions of pure random networks introduced by Erdos and Renyi Renyi . Roughly, the shapes of these distributions keep similar in all times. However, quantitative analysis shows non-constant behavior of the evolution of Zipf exponent () which is shown in the inset of the Figure 1. Especially there is a bump during 2006, i.e. the rank-ordered distributions tend to be steeper, which reflects higher download frequency for higher rank papers. However, the exponent decreases in 2007, i.e. more flatter distribution, which is obviously seen in the Figure 1 (diamond points). In this case, the web visitors prefer to download more papers listed in the web page which are not only focused on those top downloaded papers.

To quantitatively see the increasing download numbers with time, we make a plot in Fig. 2 for the rank-sorted download numbers starting from the date 2004/08/31 (i.e. = 0 on 2004/08/31) as a function of days which passed starting from 2004/08/31. From the figure, all curves do not follow the exact linear increasing. In other words, there exists fluctuation for the download rates day by day.

Quantitative fluctuation of the download rates can be described by the average download numbers per day, namely the average flux, , where is the time of the download day (i.e., the abscissa of Fig. 2) and from the starting date (2004/08/31) to the ending date which will be illustrated later. For each rank-ordered paper, these download rates change day by day, from which we can extract the average flux and its dispersion (root of mean square of the download rate distribution) for each paper.
Fig. 3 shows the relationship between the average download rates (left column) or the dispersion (left column) as a function of the rank for the accumulated data during 2004/08/31 to 2005/03/13 (i.e. 6.5 months)(top row), from 2004/08/31 to 2005/12/26 (i.e. 31 months)(i.e. 16 months) (middle row) and from 2004/08/31 to 2007/03/26 (i.e. 31 months) (bottom row). In left columns, the download rates show a fast decay with the increasing of rank for those most downloaded papers and the keep fluctuation for large rank values. It can be qualitatively understood that the web visitors prefer to download the top rank-ordered papers when he/she visits this page for the first time. This average day-by-day download flux can be roughly described by the exponential decay fits:
| (2) |
which is plotted in the figures and the half-lifetime decay exponent is shown in the inset. is small and seems to increase with the time period during which the data were accumulated. Right columns depict the dispersion as a function of the ranks which does not exhibit an obvious exponential decay as versus rank shows, rather than frequent fluctuations.

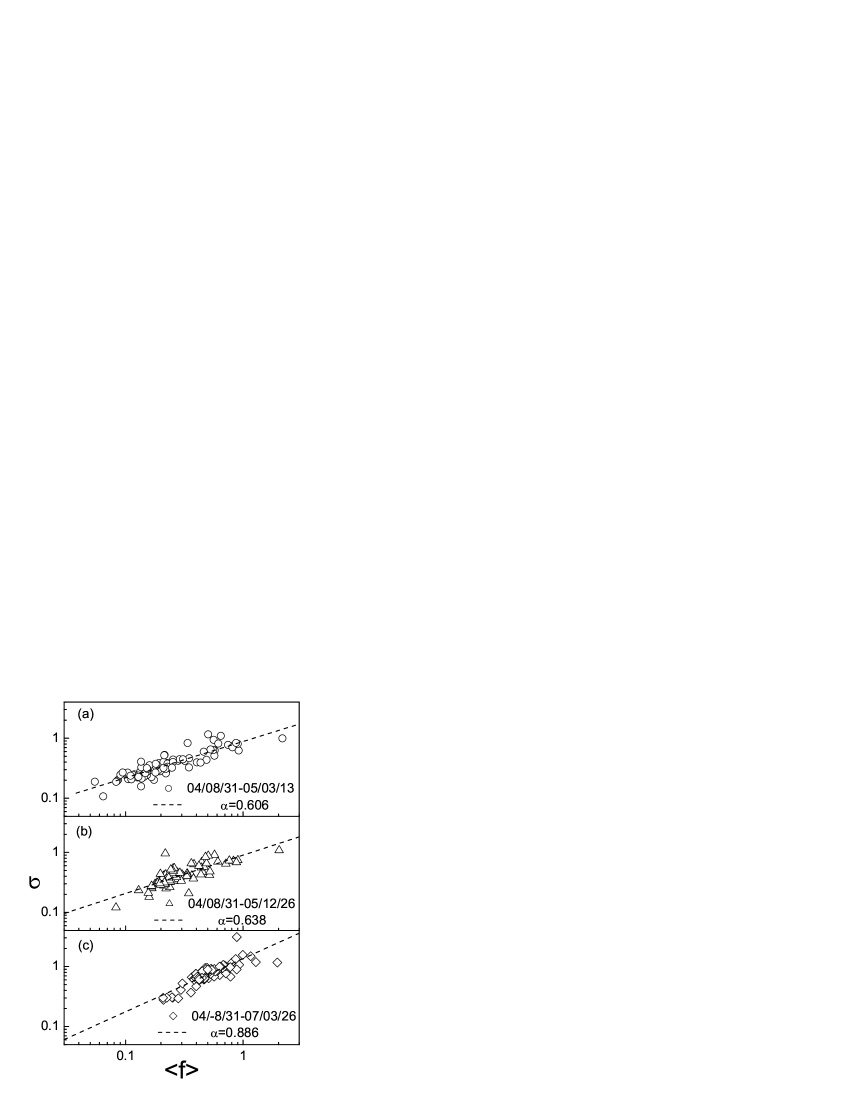
Fig. 4 demonstrates the relationship of and for all rank-ordered papers. To investigate the possible effect of time window in which the download data were accumulated, we use the data ensembles which correspond to the period from 2004/08/31 to 2005/03/13 (a), from 2004/08/31 to 2005/12/26 (b) and from 2004/08/31 to 2007/03/26 (c), respectively. From each double logarithm plot, all points basically show linear increases between the average flux and its dispersion. In this context, we fit the data points using the power law:
| (3) |
to extract the scaling parameter which are shown in the inset of each panel. There are two points which we can learn from the figure: (1) the scaling parameter is neither 1/2 nor 1. In the work of Menezes and Barabási, they thought there are two universal fluctuation classes: or 1 systems. The typical example of the former is the Internet network, which was claimed to be dominantly driven by the internal dynamics. And the typical example of the latter is the WWW URL links, which was claimed to be dominantly driven by the external dynamics. The exponents of our download network are between 1/2 and 1. (2) The scaling exponents seem to depend on the time windows during which the data samples are collected. In the other words, the longer the time windows, the larger the fluctuation exponent. Hence, in this viewpoint, we cannot exclude the possibility that fluctuation exponent could reach to 1 if we take very long time windows from the present work.
Qualitatively, our network fluctuation could be explained by the interplay of different fluctuation types, namely internal fluctuation and external fluctuation, which was proposed by Menezes and Barabási Bara . In their model, they consider the random diffusion of walkers (here they represent the visitors who download the papers) on the network, such that each walker that reaches a node (here it represents the rank-ordered paper) departs in the next time step along one of other nodes. Originally each walker is placed on the network at a randomly chosen location and removed after it performs steps, mimicking in a highly simplified fashion a human browser surfing the Web for information Bara . In this way, finally the relationship between the average flux and the fluctuations follow a fluctuation scaling with = 1/2, corresponding to internal fluctuation driven behavior. However, in real systems the fluctuation on a given node is determined not only by the system’s internal dynamics, but also by changes in the external condition. To incorporate externally induced fluctuation, Menezes and Barabási allow (the number of walkers in the web page), to vary from one day to the other. This is of course true, especially in case that peoples visit un-congested web page, such as the Encophysics web page. Assuming that the day to day variations of define a dynamic variable chosen from an uniform distribution in the interval [-, ], for = 0 one recovers = 1/2. However, when exceeds a certain threshold, in both models the dynamical exponent changes to = 1 Bara . In this case, the external fluctuation can overshadow the internal fluctuation so that = 1. However, our network fluctuation behavior is not exactly the above extreme cases, instead it seems to be located in the transition region between the two extreme cases, namely the internal fluctuation type ( = 1/2) and external fluctuation type ( = 1). This could be explained by a smaller which does not exceed the certain threshold corresponding to a transition condition from = 1/2 to 1 in our download network. We think this is reasonable since the Encophysics web page is not a popular web page, such as Yahoo or Sina web pages, instead it is a small-circle scientific web page and no many people browse it often. In this case, could be small due to a few people browse this web page day-by-day so that the day variations cannot exceed the certain threshold. Actually, there exists a wide transition region where is between 1/2 to 1 for a finite network system in Menezes and Barabási’s model. Therefore, our interpretation for the origin of the download network fluctuation is not contradicted to their model. Using the above scenario, we can qualitatively learn what the fluctuation originates from for our download network.
However, the above scenario which assumes any external driving force is not unique to interpret the observed crossover fluctuation exponents between 1/2 and 1. A simple traffic model in complex networks that suggests congestion as the origin of the increase of and captures the essential parameters governing the dynamical process Duch is also possible to explain the download network fluctuation. In that model, traffic process in a complex network of nodes as queue systems, and a random walk simulation for the movement of packets on the network. The arrival process of packets to the network is controlled by a Poisson distribution with parameter , each packet enters the network at a random selected node. Once the packet arrives to the node enters a queue. The delivery of the packets in the queue is controlled by an exponential distribution of service times with parameter . In that model, the packets will perform random steps in the network before disappearing. This dynamics is performed in continuous time, assuming that the time expended by packets traveling through a link is negligible. The model can finally account for different scaling exponents depending on the parameters , , , and the time period . Especially, we are interesting to see that is a function of the time window length in which the average was taken, which changes from 1/2 to 1: increases with the the time window length in the transition region. In the present study, even though our time window means the whole statistical one in which the download data were accumulated, which is different from the above mentioned time window in which the average were taken in the above model, the effect could be analogous: the larger accumulated time windows can be somewhat equivalent to the larger time window length in which the average were taken. The same trend which increases with time was observed. Actually, the fluctuation exponents between 1/2 and 1 have been observed in the stock market transaction and other human dynamics such as emails from a particular company and data on the printing activity etc, and their exponent shows the dependences on the time window size. A detailed review can be found in Ref. rev .
In summary, we investigated the evolution of the download network for the rank-ordered papers which were listed in Zhang’s Encophysics web page. In recent three years, the download distribution shows the change of the exponents even though the rank-ordered distribution still keeps scale-free feature, reflecting the change of traffic on nodes which represent the given downloaded papers. Further, we give quantitative analysis for the average download rates per day, which show day-by-day fluctuation. The average flux shows a fast exponential decay as a function of the rank, while the dispersion does not show an obvious dependence of the rank. Interestingly, the dispersion of the download rate distributions shows a power-law scaling behavior with its average flux, namely . In different time windows ranging from about 6.5 months to 31 months in which the download distributions are accumulated, the scaling parameter changes with the time windows, namely from 0.60 to 0.89. The origins are qualitatively interpreted by two models. Future work on quantitative model simulation and a possible -scaling of network fluctuation is in progress.
This work was partially supported by Shanghai Development Foundation for Science and Technology under Grant Numbers 06JC14082 and 05XD14021.
References
- (1) Albert R, Barabási A-L 2002 Rev. Mod. Phys. 74 47.
- (2) Dorogovtsev S N and Mendes J F 2002 Adv. Phys. 51 1079.
- (3) Botet R et al. 2001 Phys. Rev. Lett. 86 3514.
- (4) Ma Y G 2001 J. Phys. G 27 2455; 2004 Phys. Rev. C 69 031604(R); 2005 Phys. Rev. C 71 054606; 2005 J. Phys. G 31 S1179; Ma G L et al 2003 Chin. Phys. Lett. 20 1013
- (5) Gulminelli F and D’Agostino M 2006 Eur. Phys. J. A 30 253, Chapter V.6 of the ”World Consens Initiative” book entitled with ”Dynamics and Thermodynamics with Nuclear Degree of Freedom”, (SIF and Springer-Verlag Berlin Heidelberg) 2006, eds Ph. Chomaz, F. Gulminell, W. Trautmann and S. J. Yennello.
- (6) Algollo de Menezes M and Barabási A L 2004 Phys. Rev. Lett. 92 028701; 2004 Phys. Rev. Lett. 93 068701.
- (7) Duch J and Arenas A 2006 Phys. Rev. Lett. 96 218702.
- (8) Han D D, Liu J G, Ma Y G, Cai X Z and Shen W Q 2004 Chin. Phys. Lett. 21 1855.
- (9) Zipf G K, Human behavior and the principle of least effort (Addison-Wesley, Cambridge-MA, 1949).
- (10) Ma Y G 1999 Phys. Rev. Lett. 83 3617; 2000 Chin. Phys. Lett. 17 340; 2006 Eur. Phys. J. A 30 227, Chapter V.4 of the ”World Consens Initiative” book entitled with ”Dynamics and Thermodynamics with Nuclear Degree of Freedom”, (SIF and Springer-Verlag Berlin Heidelberg) 2006, eds Ph. Chomaz, F. Gulminell, W. Trautmann and S. J. Yennello.
- (11) Tsallis C and Albuquerque M P 2000 Eur. Phys. J. B 13 777.
- (12) http://www.unifr.ch/econophysics/
- (13) Erdos P and Renyi A 1960 Publ. Math. Inst. Hung. Acad. Sci. 5 17.
- (14) Eisler Z, Bartos I and Kertész 2007 arXiv:0708.2053