Dispersion and energy spectrum of spin excitations in an underdoped La1.90Sr0.10CuO4
Abstract
We performed inelastic neutron experiments on underdoped La2-xSrxCuO4 (, K) using a time-of-flight neutron scattering technique. Four incommensurate peaks on the two-dimensional reciprocal plane disperse inwards toward an antiferromagnetic zone center as the energy increases. These peaks merge into a single peak at an energy around meV. Beyond , the peak starts to broaden and “hourglass-like” excitations are observed. The in the underdoped sample is smaller than that reported for the optimally doped La1.84Sr0.16CuO4. The reduction of the is explained by the doping-independent slope of the downward dispersion below the combined with the smaller incommensurability in the underdoped sample. In the energy spectrum of , we observed a similar ”peak-dip-hump” structure in the energy region of 10 meV to that reported for the optimally doped sample. We discuss the relation between the hourglass-shaped dispersion and the peak-dip-hump energy spectrum.
pacs:
Valid PACS appear hereOne of the central issues regarding the mechanism of high- superconductivity is to clarify a common feature of magnetic excitation spectra among high- cuprate materials, which has long remained controversial due to the difficulty in inelastic neutron scattering experiment on many different high- cuprates. In recent years, neutron scattering experiments have revealed an overall feature of spin correlations: The spin excitations of hole-doped cuprates form a “hourglass-shaped” dispersive branch in energy-momentum space. In the low-energy region, four symmetric incommensurate (IC) satellite peaks appear at (, 0.5) and (0.5, ) in the high-temperature tetragonal (HTT: space group ) notation note1 . With increasing energy, the IC peaks disperse inwards and merge into a single peak around a characteristic energy, . As the energy is further increased, the excitations disperse outwards again. It is noted that in optimally doped YBa2Cu3O6+y (YBCO) a sharp inelastic peak called a resonance peak starts to develop below with = and meV Rossat-Mignod et al. (1991), which corresponds to the within the experimental resolution Bourges et al. (2000); Reznik et al. (2004).
To date, well-defined hourglass-like dispersive excitations have been observed in both mono-layered La2-x(Sr,Ba)xCuO4 (LSCO, LBCO) Tranquada et al. (2004); Christensen et al. (2004); Vignolle et al. (2007) and bi-layered YBCO Arai et al. (1999); Bourges et al. (2000); Hayden et al. (2004); Reznik et al. (2004); Stock et al. (2005); Hinkov et al. , which indicates that such hourglass-like excitations are common to hole-doped high- cuprates. However, the microscopic origin of the hourglass-like excitations and their relevance to the high- pairing mechanism are still unclear.
Two types of theoretical approaches have been used to understand the hourglass-like excitations. One stands on the local spin dynamics in the presence of spin stripes Batista et al. (2001); Uhrig et al. (2004); Vojta et al. (2006) and the other is based on the Fermi liquid theory of itinerant fermions Eremin et al. (2005); Norman (2007). The former models can describe the overall feature of spin dynamics in a wide energy range in LSCO or LBCO, but so far, it has been difficult to reproduce the drastic change in the spin excitation at such as the resonance peak in YBCO. On the other hand, the latter models naturally explain the origin of the resonance peak as a particle-hole bound state, but cannot describe quantitatively or even qualitatively the spin excitation above or in high energy region well above the resonance.
A recent neutron scattering study on the in La2-xSrxCuO4 (LSCO) with Vignolle et al. (2007) revealed a two-energy scale or a ”peak-dip-hump” structure in the energy spectrum with a peak and a hump located at around meV and 45 meV, respectively. This observation naturally triggered the following questions. Is the peak-dip-hump structure common for the other cuprates? What is the origin of the two-energy scale and the relation with the hourglass-shaped dispersion? In order to answer to these questions, we performed a neutron scattering experiment on underdoped LSCO with and observed both the hourglass-like dispersion and the ”peak-dip-hump” structure. The results obtained by the present study demonstrate not only a common feature but also a doping dependence of magnetic excitations of this system. We further discuss the different character of magnetic excitations between LSCO and YBCO from a view point of duality (local and itinerant characters) of spins in both systems.
Large single crystals were grown using a traveling-solvent floating-zone (TSFZ) method, in the same manner as described in Ref. Kofu et al. (2005). Three crystals, with each 4 cm long and 8 mm in diameter (total weight of 40 g) were grown along the [110] direction in the HTT structure at high temperature. After the growth, to eliminate oxygen deficiencies, the as-grown crystals were annealed under oxygen gas flow. We measured magnetic susceptibility under zero-field cooling using a superconducting quantum interference device (SQUID) magnetometer. The superconducting transition occurs at (midpoint) of 28.6 K within the transition width of 1.6 K. The concentrations of La, Sr and Cu ions were precisely determined by inductively coupled plasma (ICP) analysis.
The three crystals were coaligned using a triple-axis spectrometer in JRR-3M. Inelastic neutron scattering experiments were performed on the chopper spectrometer PHAROS at Los Alamos National Laboratory (LANL) using the time-of-flight neutron scattering technique. The incident beam was parallel to the -axis (-direction) of sample, and the horizontal plane corresponded to the [] zone. Using position sensitive detectors (PSD), this configuration makes it possible for us to survey peaks around in the two dimensional () plane. Measurements were carried out using three different incident neutron beams characterized by both incident energy and chopper frequency , meV and Hz, meV and Hz, and meV and Hz.
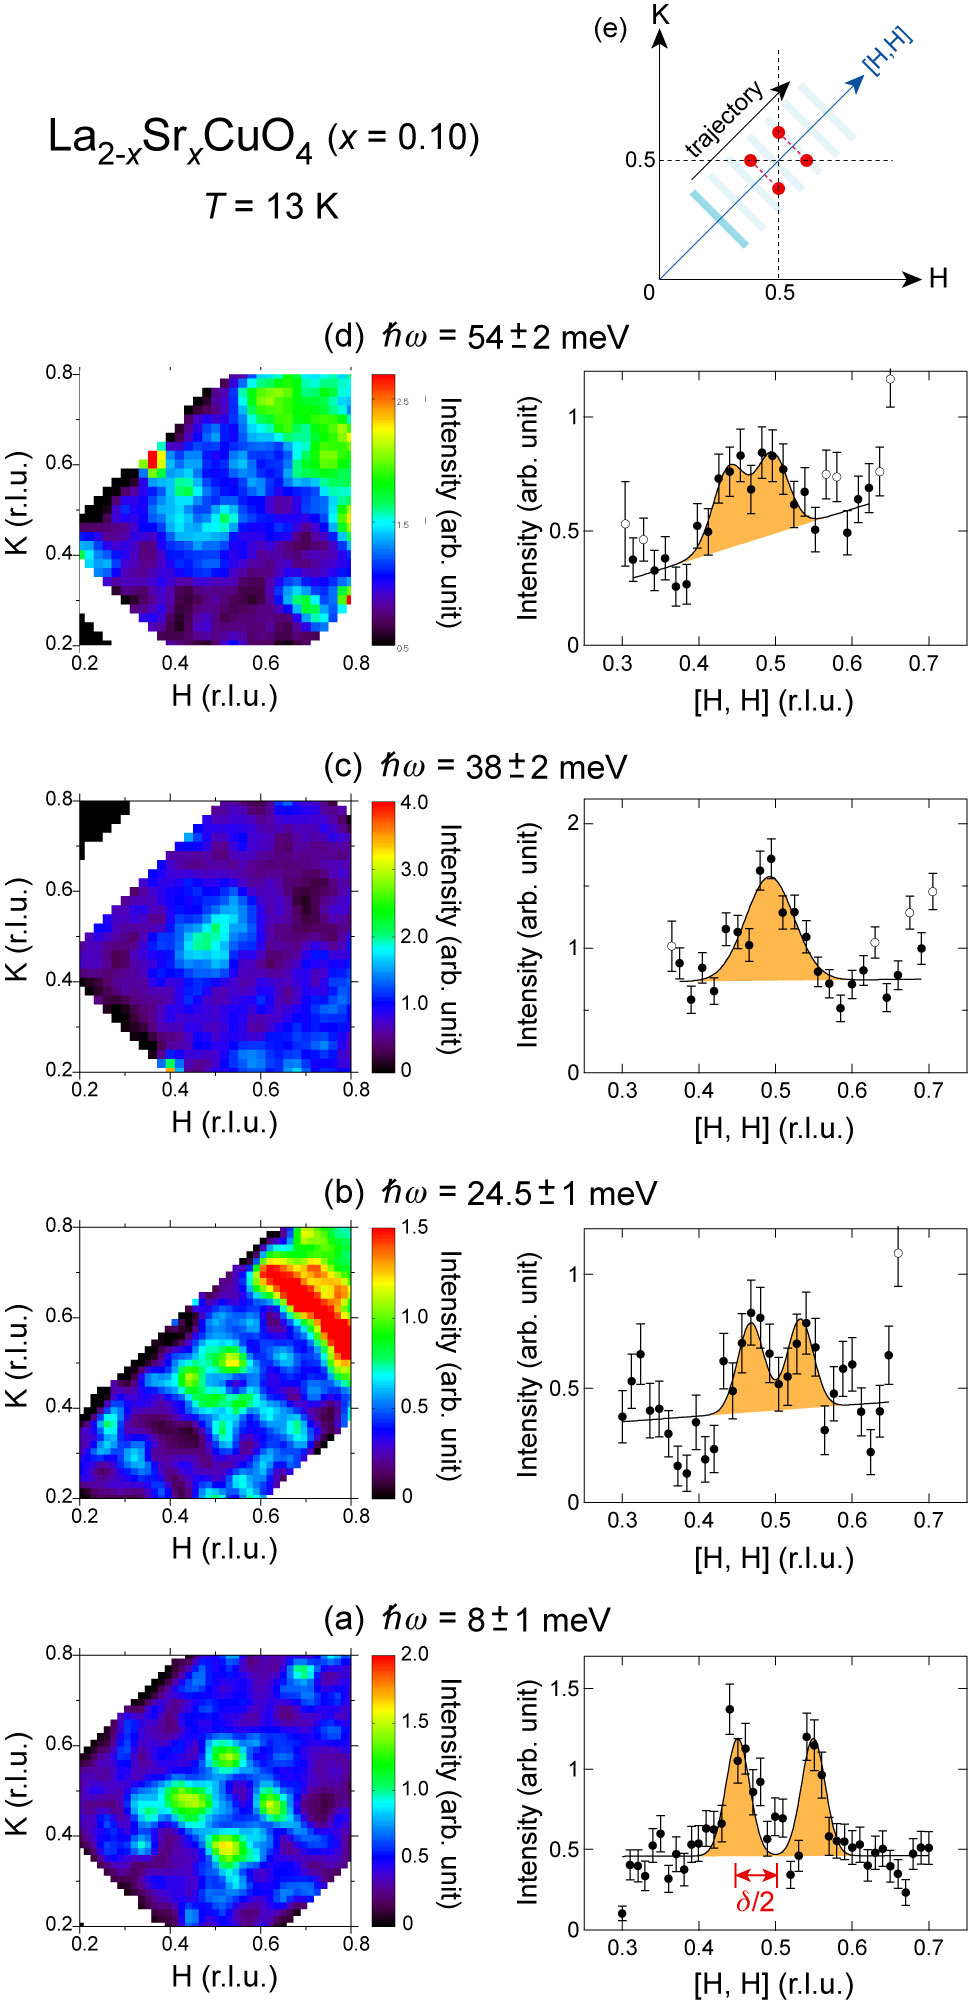
Constant-energy slices of magnetic excitations at are shown in the left panels of Fig. 1. It is noted that the background of the spectrometer is low and that only weak random noise was subtracted from the raw data. For each energy transfer, a clear signal can be observed around . Particularly, at meV, four well-defined incommensurate peaks surround and the incommensurability, , is determined to be (r.l.u.), which is consistent with a triple-axis neutron scattering measurements Lee et al. (2000). These satellite peaks come closer together with increasing energy transfer, , indicating the excitation disperses inwards toward . We note the arc-like strong scattering around at meV is not an intrinsic signal. As seen in the figure at meV, a single peak was found at and the excitation tends to disperse outwards in both directions to the higher and lower energy regions. Therefore, the hourglass-like excitations also exist in underdoped LSCO with .
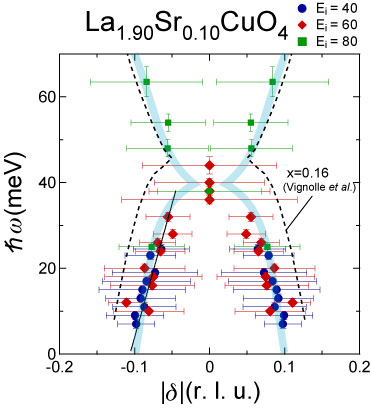
To analyze the data more quantitatively, we plotted the result of one dimensional scan along the [] direction of the data in the left figures (see right figures in Fig. 1). We integrated intensities along the direction perpendicular to [], r.l.u., as shown in the shaded area of Fig. 1(e). By this procedure, four incommensurate peaks at (, 0.5) and (0.5, ) are projected on (, ). Hence the observed peak splitting corresponds to the half of as depicted in the right figure in Fig. 1(a)). Solid lines are the results of the fits with assuming a pair of Gaussian peak and a linear background. We drew a dispersion relation in Fig. 2 by plotting the observed values of in both positive and negative horizontal axis directions.
In the energy region, meV, a single peak was observed and the is evaluated to be meV, which is smaller than that of the sample. On the other hand, the slope of the dispersion for the downward excitation ( meV) is almost the same for the two samples as seen in Fig. 2, which was pointed out by Christensen et al. Christensen et al. (2004). Here, we define the spin wave velocity as . The solid line in the figure corresponds to meV/Å-1. The smaller value of the for the underdoped sample can be understood by the doping-independent spin wave velocity of the downward excitation. The will be proportional to the at low energies. Particularly in underdoped LSCO, the is expected to depend linearly on both doping rate, , and the maximum because of the linear relation among , and the maximum Yamada et al. (1998). This prediction is supported by the previous result on LSCO with Hiraka et al. (2001) where the doping dependence of magnetic peak-width suggests that the is smaller than that of LSCO with .
In contrast to the weak doping dependence of the spin wave velocity for the downward excitation, the spin wave velocity for the upward excitation is remarkably doping dependent. For example, meV/Å-1 Vignolle et al. (2007) is reported for the sample which is much smaller than that of undoped La2CuO4, meV/Å-1 Aeppli et al. (1989). Such different responses to doping indicate different origins of the downward and the upward excitations. Additionally, such different characters of spin excitations are also observed in the peak-widths, shown as the horizontal bars in Fig. 2; for the upward excitation the peak-widths are larger than those for the downward excitation as seen in Vignolle et al. (2007).
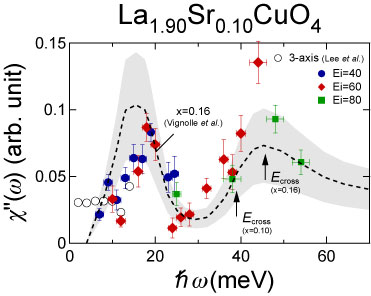
We next show the energy spectrum of the -integrated (local) dynamical magnetic susceptibility at K. Here, is obtained by correcting for the thermal population factor in the integrated dynamical structure factor . Since the thermal population factor for meV at K, and are nearly equivalent. was estimated from the fits of magnetic signals assuming a single or a pair of Gaussian peaks (see in right panels of Fig. 1). In order to draw an energy spectrum over a wide energy range, we normalized each data point of taken under different incident beams. For the normalization we considered the differences of beam flux, energy resolution, and magnetic form factor note2 for each data point.
In Fig. 3, we plot the result of (our data) in addition to the result from the triple axis scattering for (Lee et al. Lee et al. (2000)). Amplitudes of from two different experiments are scaled using the value at meV note3 . In the figure, we also drew a smoothed band to represent the result for (Vignolle et al. Vignolle et al. (2007)). The band width approximately represents the uncertainty in the absolute value of between the different experimental results. Interestingly, exhibits a similar ”peak-dip-hump” structure to that is observed in LSCO with . The peak and hump positions weakly depend on doping.
Here, we shortly remark about the possibility of contamination by phonons into the peak at around 20 meV, since the background from phonons are often intense in this energy range. In order to distinguish and remove clear contamination by phonons, we analyzed the -profiles of IC peaks at many different energy values by using different incident neutron energies. If we observed any anomalous profiles possibly due to phonon scattering, we discarded the data point. Therefore, the peak around 20 meV is considered not to be severely contaminated by phonons, though we are not completely free from the effect from non-dispersive phonons or possible coupling between phonons and magnetic excitations.
As seen in Fig. 3, in the underdoped sample the peak intensity at around 20 meV is relatively weaker than that observed in the optimally doped sample. Furthermore, the peak at around 20 meV for is strongly suppressed at K Vignolle et al. (2007). Thus, it is natural to consider that the peak is related to the onset of superconductivity either directly or indirectly. Here we compare the peak observed in LSCO with the resonance peak in YBCO. In YBCO, the resonance peak position, , nearly corresponds to that of the and is approximately proportional to . On the other hand, in LSCO, as indicated by arrows in Fig. 3, the locates near the hump energy which is higher than the peak energy. Furthermore, the resonance peak in optimally doped YBCO appears below with sharp widths in energy and , while the peak in LSCO is much broader and perhaps remains even above Lee et al. (2003). Therefore, although the hourglass shape of the magnetic dispersion is common, the energy spectrum and its temperature dependence are different between LSCO and YBCO.
Recently, phenomenological theories, which take into account both itinerant fermions and local spins Eremin et al. (2006); Bang have successfully reproduced the experimental excitation data for YBCO in both superconducting and normal states. Within this framework, we speculate that the remaining IC correlation well below in LSCO may be related with the local spin state such as a stripe state. Moreover, the aforementioned distinctions in the magnetic excitations between LSCO and YBCO possibly originate from the different local spin state and/or the different degree of dual nature between the two systems, more localized nature in LSCO and more itinerant nature in YBCO.
Furthermore, it should be noted that the degree of such duality seems to correlate with the pseudo-gap behavior. In LSCO, the doping region of the pseudo-gap extends towards the over-doped region Lee et al. (2003); Ando et al. (2004), while in YBCO the pseudo-gap is mainly seen in the underdoped region. Furthermore, in the underdoped YBCO a peak-dip-hump structure was reported by Dai et al Dai et al. (1999) as seen in the optimally doped LSCO. The similar peak-dip-hump structure between the optimally doped LSCO and the underdoped YBCO may correspond to such different doping regions for the pseudo-gap behavior. In other words, the stability of the pseudo-gap depends on the dual nature of magnetic properties in high- cuprates.
Finally, we briefly address the low energy component below around 10 meV which appears in the underdoped LSCO. We speculate the growth of the intensity below around 10 meV coincides with the growth of static or quasi static spin correlations commonly observed in the underdoped region. We note that in LSCO with , the low energy component grows more rapidly than in LSCO with with decreasing energy Hiraka et al. (2001).
In conclusion, we observed an hourglass shape of dispersive magnetic excitation and a peak-dip-hump structure in the energy spectrum for underdoped LSCO with as is observed in the optimally doped LSCO. In the underdoped LSCO, the energy of the , where the downward and upward excitations merge with each other, is lower than that of the optimally doped LSCO. The doping dependence of the is explained as a combined effect of doping-independent spin velocity for the downward excitation and the doping-dependent incommensurability. We discussed the different natures of magnetic excitations in LSCO and YBCO irrespective of the similarity in the hourglass-like dispersion.
We are grateful to K. Hirota and T. J. Sato for experimental support in crystal growth and characterization. We also thank Y. Bang, C. H. Lee, M. Fujita, and H. Hiraka for stimulating discussions. The present neutron scattering experiment was performed under the collaboration in neutron science between the High Energy Accelerator Research Organization and Los Alamos National Laboratory. This work was supported by a Grant-in-Aid for Creative Scientific Research (No. 16GS0417) ,Scientific Research(B) and the Inter-University Research Program on Pulsed-neutron Scattering at Oversea Facilities from MEXT of Japan.
References
- (1) In this paper, we denote the crystallographic indices by the HTT notation, although the crystal structure has an orthorhombic symmetry () below K.
- Rossat-Mignod et al. (1991) J. Rossat-Mignod et al., Physica C 185-189, 86 (1991).
- Bourges et al. (2000) P. Bourges et al., Science 288, 1234 (2000).
- Reznik et al. (2004) D. Reznik et al., Phys. Rev. Lett. 93, 207003 (2004).
- Tranquada et al. (2004) J. M. Tranquada et al., Nature 429, 534 (2004).
- Christensen et al. (2004) N. B. Christensen et al., Phys. Rev. Lett. 93, 147002 (2004).
- Vignolle et al. (2007) B. Vignolle et al., Nature Physics 3, 163 (2007).
- Arai et al. (1999) M. Arai et al., Phys. Rev. Lett. 83, 608 (1999).
- Hayden et al. (2004) S. M. Hayden et al., Nature 429, 531 (2004).
- Stock et al. (2005) C. Stock et al., Phys. Rev. B 71, 024522 (2005).
- (11) V. Hinkov et al., eprint cond-mat/0601048.
- Batista et al. (2001) C. D. Batista et al., Phys. Rev. B 64, 172508 (2001).
- Uhrig et al. (2004) G. S. Uhrig et al., Phys. Rev. Lett 93, 267003 (2004).
- Vojta et al. (2006) M. Vojta et al., Phys. Rev. Lett 97, 097001 (2006).
- Eremin et al. (2005) I. Eremin et al., Phys. Rev. Lett. 94, 147001 (2005).
- Norman (2007) M. R. Norman, Phys. Rev. B 75, 184514 (2007).
- Kofu et al. (2005) M. Kofu et al., Phys. Rev. B 72, 064502 (2005).
- Lee et al. (2000) C. H. Lee et al., J. Phys. Soc. Jpn. 69, 1170 (2000).
- Yamada et al. (1998) K. Yamada et al., Phys. Rev. B 57, 6165 (1998).
- Hiraka et al. (2001) H. Hiraka et al., J. Phys. Soc. Jpn. 70, 853 (2001).
- Aeppli et al. (1989) G. Aeppli et al., Phys. Rev. Lett. 62, 2052 (1989).
- Lee et al. (2003) C. H. Lee et al., Phys. Rev. B 67, 134521 (2003).
- (23) In our configuration of measurements, -component of changes with increasing energy transfer and also depends on the incident energy. We use the free-ion magnetic form factor calculated by Freeman and Watson.
- (24) The scale factor for was estimated to be the same value at meV. To compare the data of with that of , we used the ratio reported by Lee et al. (Ref. Lee et al. (2000)).
- Eremin et al. (2006) M. V. Eremin et al., JETP Lett. 84, 167 (2006).
- (26) Y. Bang, eprint cond-mat/0706.1387.
- Ando et al. (2004) Y. Ando et al., Phys. Rev. Lett. 93, 267001 (2004).
- Dai et al. (1999) P. Dai et al., Science 284, 1344 (1999).