HESS Observations and VLT Spectroscopy of PG 1553+113
Abstract
Aims. The properties of the very high energy (VHE; E100 GeV) -ray emission from the high-frequency peaked BL Lac PG 1553+113 are investigated. An attempt is made to measure the currently unknown redshift of this object.
Methods. VHE Observations of PG 1553+113 were made with the High Energy Stereoscopic System (HESS) in 2005 and 2006. H+K (1.452.45m) spectroscopy of PG 1553+113 was performed in March 2006 with SINFONI, an integral field spectrometer of the ESO Very Large Telescope (VLT) in Chile.
Results. A VHE signal, 10 standard deviations, is detected by HESS during the 2 years of observations (24.8 hours live time). The integral flux above 300 GeV is cm-2 s-1, corresponding to 3.4% of the flux from the Crab Nebula above the same threshold. The time-averaged energy spectrum is measured from 225 GeV to 1.3 TeV, and is characterized by a very soft power law (photon index of ). No evidence for any flux or spectral variations is found on any sampled time scale within the VHE data. The redshift of PG 1553+113 could not be determined. Indeed, even though the measured SINFONI spectrum is the most sensitive ever reported for this object at near infrared wavelengths, and the sensitivity is comparable to the best spectroscopy at other wavelengths, no absorption or emission lines were found in the H+K spectrum presented here.
Key Words.:
Galaxies: active - BL Lacertae objects: Individual: PG 1553+113 - Gamma rays: observations1 Introduction
Evidence for VHE (100 GeV) -ray emission from the active galactic nucleus (AGN) PG 1553+113 was first reported by the HESS collaboration (Aharonian et al. 2006a ) based on observations made in 2005. This evidence was later confirmed (Albert et al. (2007)) with MAGIC observations in 2005 and 2006. Similar to essentially all AGN detected at VHE energies, PG 1553+113 is classified as a high-frequency peaked BL Lac classification (Giommi et al. 1995) and is therefore believed to possess the double-humped broad-band spectral energy distribution (SED) typical of blazars. The low-energy (i.e. from the radio to the X-ray regime) portion of the SED of PG 1553+113 is well-studied, including several simultaneous multi-wavelength observation campaigns (see, e.g., Osterman et al. (2006)). However, the only data in the high-energy hump are from HESS and MAGIC. The measured VHE spectra are unusually soft (photon index =4.00.6 and =4.20.3, respectively) but the errors are large, clearly requiring improved measurements before detailed interpretation of the complete SED is possible.
Further complicating any SED interpretation is the absorption of VHE photons (Gould & Schréder (1967); Hauser & Dwek (2001)) by pair-production on the Extragalactic Background Light (EBL). This absorption, which is energy dependent and increases strongly with redshift, distorts the VHE energy spectra observed from distant objects. For a given redshift and a given EBL model, the effects of the latter on the observed spectrum can be reasonably accounted for during SED modeling. Unfortunately, the redshift of PG 1553+113 is currently unknown111Falomo & Treves (1990) demonstrate the catalog redshift of is incorrect.. To date no emission or absorption lines have been measured from PG 1553+113 despite more than ten observation campaigns with optical instruments, including EMMI at the NTT and FORS2 with the 8-meter VLT telescopes (Carangelo et al. (2003); Sbarufatti et al. (2006)). Lower limits of (Sbarufatti et al. (2006)) and (Carangelo et al. (2003)) were determined from the lack of detected absorption/emission lines, implying that the effect of the EBL is large in the observed VHE data. The absence of absorption and emission lines suggests that the non-thermal component of the emission from PG 1553+113 is largely dominant over that of the host galaxy. This is consistent with the fact that, although some hints for a host galaxy have been suspected, no clear detection has yet been found, even in Hubble Space Telescope (HST) images of PG 1553+113 taken during the HST survey of 110 BL Lac objects Hubble_image (Scarpa et al. 2000). Interestingly, approximately 80% (88/110) of the BL Lacs initially surveyed by HST have known redshifts, of which all 39 with and 21 of the 28 with have their hosts resolved, suggesting that the redshift of PG 1553+113 is indeed large. Recently, using a re-analysis of the HST snapshot survey of BL Lacs, Sbarufatti et al. (2005) claimed the dispersion of the absolute magnitude of BL Lac hosts is sufficiently small that the measurement of the host-galaxy brightness allows a reliable estimate of their redshift. With the assumption that there is no strong evolution, these authors set a possible lower limit of for PG 1553+113. However, adding new STIS-HST data of BL Lacs to the snapshot survey, O’Dowd & Urry (2005) found on the contrary that host galaxies of BL Lacs evolve strongly, making any photometric redshift determination questionable. A conservative upper limit () was determined (Aharonian et al. 2006a ) from the photon spectrum measured by HESS. The same limit was similarly determined from the MAGIC spectral measurement (Albert et al. (2007)). Using both the MAGIC and HESS data, a stronger upper limit of was later reported Mazin_limit (Mazin & Goebel 2007) based on the assumption that there is no break in the intrinsic VHE spectrum of the object. The range of allowed redshift is clearly large enough that the significant effects of EBL absorption cannot be reliably removed from the observed VHE spectrum of PG 1553+113. This correspondingly makes modeling the high-energy portion of its SED unreliable. A clear detection of the object’s redshift would dramatically improve the understanding of PG 1553+113. Further, if it were found to be distant, its VHE spectrum could potentially provide strong constraints on the poorly-measured EBL (assuming a reasonable intrinsic spectrum) and contribute to establishing the VHE -ray horizon.
Results from 17.2 hours of new HESS observations of PG 1553+113 in 2006 are reported here. In addition, a re-analysis of the previously published 2005 HESS data (7.6 hours), with an improved calibration of the absolute energy scale of the detector, is presented. HESS and the Suzaku X-ray satellite observed the blazar simultaneously in July 2006. The HESS results from this epoch are also discussed. This will enable, for the first time, future modeling of an SED determined from simultaneous observations at VHE and lower energies. Finally, results of a March 2006 VLT SINFONI spectroscopy campaign to determine the redshift of PG 1553+113 are also reported.
2 HESS Observations and Analysis Technique
A total of 30.3 hours of HESS observations were taken, typically in 28-minute data segments (runs), on PG 1553+113 in 2005 and 2006. The pointing of the HESS telescopes was offset 0.5∘ from the position of PG 1553+113 during the observations. The useful exposure is 24.8 hours live time, as 9 of the 66 runs fail the HESS data-quality selection criteria. The data are processed using the standard HESS calibration calib_paper (Aharonian et al. 2004) and analysis tools std_analysis (Benbow 2005). Soft cuts (Aharonian et al. 2006a )222The soft cuts were initially named the spectrum cuts in Aharonian et al. (2006a). are applied to select candidate -ray events. The soft cuts are selected instead of the standard cuts since they result in a lower energy threshold. Hence they are more appropriate given the very soft VHE spectra previously measured by both HESS (; Aharonian et al. 2006a ) and MAGIC (; Albert et al. (2007)). At the mean zenith angle of the observations, , the soft cuts result in an average post-analysis energy threshold333The threshold has been corrected to account for the decreased optical efficiency of the HESS mirrors. of 300 GeV. Events falling within a circular region of radius =0.14∘ centered on PG 1553+113 are considered on-source data. The background (off-source data) is estimated simultaneously to the on-source data from events recorded within the same field of view (FoV) using the Reflected-Region method bgmodel_paper (Berge et al. 2007). Equation (17) from Li & Ma (1983) is used to calculate the significance of any excess. The energy of each event is corrected HESS_crab (Aharonian et al. 2006b) using efficiencies determined from simulated and observed muons. This correction accounts for long-term variations in the absolute energy scale due to a changing optical throughput of the HESS system. The HESS results have been verified using independent calibration and analysis chains.
3 HESS Results
| Dark | MJD | MJD | Time | On | Off | Excess | Sig | I(300 GeV)444The systematic error on the observed integral flux above 300 GeV is 20% and is not shown. | Crab555The integral flux percentage is calculated relative to the Crab Nebula flux above 300 GeV. | , NDF666The , degrees of freedom (NDF), and probability P() are given for a fit of a constant to I(300 GeV) binned nightly within a dark period, or monthly within a year, or yearly within the total. | P() | |
| Period | First | Last | [h] | [] | [10-12 cm-2 s-1] | % | ||||||
| 04/2005 | 53492 | 53507 | 4.9 | 1210 | 8154 | 0.125 | 191 | 5.5 | 3.5 | 2.7 , 4 | 0.61 | |
| 08/2005 | 53609 | 53614 | 2.7 | 491 | 3462 | 0.125 | 58 | 2.5 | 7.5 | 4.9 , 2 | 0.09 | |
| 04/2006 | 53849 | 53860 | 7.1 | 1811 | 12742 | 0.125 | 218 | 5.0 | 3.0 | 5.3 , 8 | 0.72 | |
| 07/2006 | 53938 | 53943 | 10.1 | 2236 | 15341 | 0.125 | 318 | 6.7 | 3.2 | 3.1 , 5 | 0.68 | |
| 2005 | 53492 | 53614 | 7.6 | 1701 | 11616 | 0.125 | 249 | 6.0 | 4.0 | 0.9 , 1 | 0.33 | |
| 2006 | 53849 | 53943 | 17.2 | 4047 | 28083 | 0.125 | 536 | 8.3 | 3.1 | 0.03 , 1 | 0.86 | |
| Total | 53492 | 53943 | 24.8 | 5748 | 39699 | 0.125 | 785 | 10.2 | 3.4 | 0.7 , 1 | 0.39 |
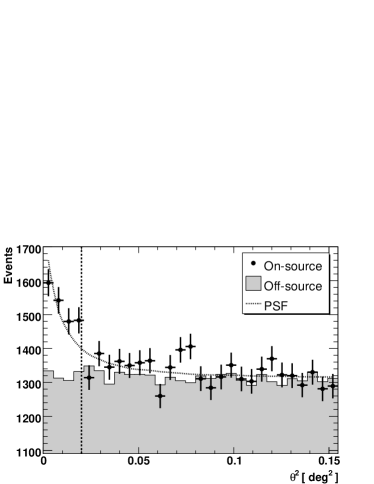
The results of the HESS observations for each dark period in 2005 and 2006, as well as relevant totals for the observations, are given in Table 1. The table shows the dark periods in which PG 1553+113 was observed, the MJD of the first and last night of observations, the dead time corrected observation time, the number of on- and off-source events, the on/off normalization (), the measured excess, and the significance of the excess. A significant excess of events from the direction of PG 1553+113 is clearly detected in each year of HESS data taking. A total of 785 excess events, corresponding to a statistical significance of 10.2 standard deviations (), is detected in the complete data set. Figure 1 shows the on-source and normalized off-source distributions of the square of the angular difference between the reconstructed shower position and the source position () for all observations. There is a clear point-like excess of on-source events at small values of , corresponding to the observed signal, and the background is approximately flat in as expected. The peak of a two-dimensional Gaussian fit to a sky map of the observed excess is located at , . The excess, HESS J1555+111, is coincident with the position (, ) of PG 1553+113 position_1553 (Beasley et al. 2002). The upper limit (99% confidence level) on the extension of HESS J1555+111 is .
3.1 Spectral Studies
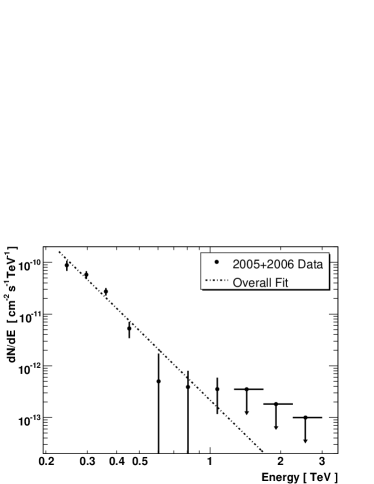
The photon spectrum for the entire data set is shown in Figure 2. These data can be fit ( of 8.4 for 5 degrees of freedom) by a power-law function d/d = ) with a photon index . Fits of either a power law with an exponential cut-off or a broken power law do not yield significantly better values. It should be noted that each of the three highest energy points, TeV, in Figure 2 have statistical significance less than 2. However, removing these points from the fit does not change significantly.
| Epoch | Emin | Emax | NDF | P() | |||
|---|---|---|---|---|---|---|---|
| [TeV] | [TeV] | [ cm-2 s-1 TeV-1] | |||||
| 2005 (AH06)777The AH06 entry is the previously published HESS result (Aharonian et al. 2006a ) for 2005. The AH06 entry was not corrected for long-term changes in the optical efficiency of the system. | 0.185 | 0.585 | 1.7 | 2 | 0.42 | ||
| 2005888The 2005 entry corresponds to exactly the same data as presented in AH06, but with a correction (see text) applied to account for optical efficiency changes within the data. The 2006 and total entries also have this correction applied. | 0.225 | 1.265 | 2.1 | 5 | 0.84 | ||
| 2006 | 0.225 | 0.534 | 8.5 | 2 | 0.014 | ||
| Total | 0.225 | 1.265 | 8.4 | 5 | 0.13 |
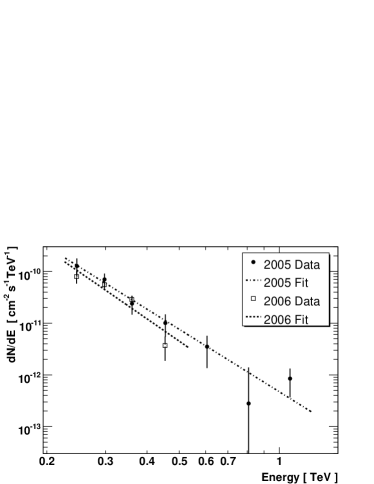
The significant photon statistics from each year of observations allows the determination of annual spectra. These spectra are shown in Figure 3. The results of fits to the data of a power law for both years, as well as for the total, are shown in Table 2. The lower and upper energy bounds, photon index (), differential flux normalization at 300 GeV (), , degrees of freedom (NDF), and probability P() for each fit are given in the table. There are no significant changes in the spectral shape during the HESS observations. By including one negative point at 600 GeV, and two more positive points at higher energies, the 2006 spectrum can be fit over the same range as either the 2005 or the overall spectrum. This fit yields , explaining why the overall photon index is slightly softer than the 2005 and 2006 indices reported in Table 2.
3.2 Integral Flux Studies
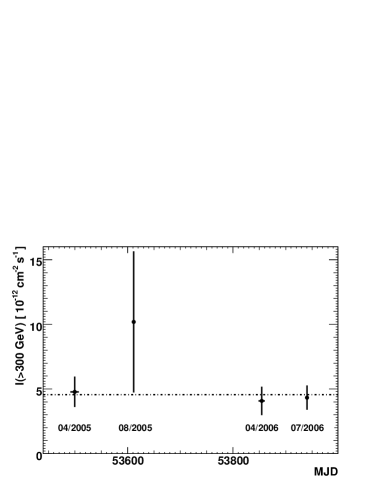
All HESS fluxes (i.e. annual, dark period and nightly values) throughout this article are calculated assuming the measured time-average photon index of . Assuming a different value (i.e. ) has less than a 5% effect on the flux. The observed integral flux above 300 GeV for the entire data set is I(300 GeV) = cm-2 s-1. This corresponds to 3.4% of I(300 GeV) determined from the HESS Crab Nebula spectrumHESS_crab (Aharonian et al. 2006b). The integral flux, I(300 GeV), is shown in Table 1 for each year of observations, as well as for each dark period. The and corresponding probability shown in the table is for a fit of a constant to the data when binned by nights within each dark period, by dark periods within a year, and by year within the total observations. There are no indications for flux variability on any time scale within the HESS data. Figures 4 and 5 show the flux measured for each dark period and night, respectively.
3.3 Effect of the Optical Efficiency Correction
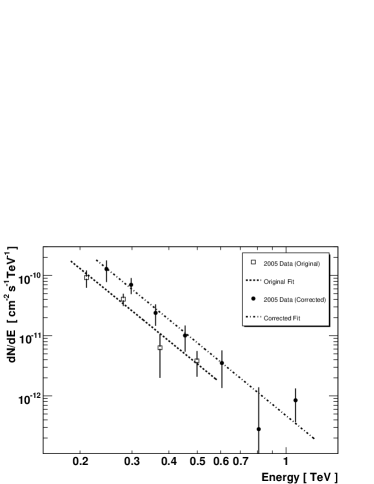
The data previously published (Aharonian et al. 2006a ) for HESS observations of PG 1553+113 in 2005 were not corrected for long-term changes in the optical sensitivity of the instrument. Relative to a virgin telescope, the total optical throughput was decreased by 29% in 2005 and 33% in 2006. These losses are due to the reduced reflectivity of both the mirrors and Winston cones, and to the accumulation of dust on the optical elements. Comparing (see Table 2) the spectrum for 2005 determined here to that which was previously published for the same data shows significant differences in the flux normalization () but not in the photon index (). Figure 6 illustrates this difference which is a result of correcting the energy of individual events for the relative optical efficiency of the system, determined from simulated and observed muon events, as described earlier. The flux measured in 2005 is therefore three times higher than previously published999The flux was reported above a threshold of 200 GeV. Extrapolating the earlier result, using as reported, yields I(300 GeV) = cm-2 s-1.. The large difference is due to the steep spectrum of the source. For harder spectrum sources the effect is much smaller.
3.4 Comparison to MAGIC Results
Table 3 shows the photon index and integral flux for PG 1553+113 measured by both the MAGIC (Albert et al. (2007)) and HESS collaborations. As the data were not simultaneously measured, one might not expect the measured quantities to agree due to variability arguments. In addition, the spectra from the two instruments are measured over different energy ranges which could result in different spectral slopes if the spectrum were curved. Nevertheless, the spectral slope () measured by both instruments agree within errors in all epochs. Further, the flux above 200 GeV measured by both HESS and MAGIC in 2005 is consistent101010Previously the 2005 HESS result was 4 times lower than the 2005 MAGIC result. The agreement is solely the result of the optical efficiency correction.. However the flux observed in 2006 by MAGIC is lower than the HESS value. It should be noted that in 2006, all the HESS data were taken after the final published MAGIC observations, whereas a good fraction of the 2005 data from both instruments are quasi-simultaneous.
| HESS111111The systematic error on the HESS is 0.1. | HESS121212The HESS fluxes are extrapolated from the values in Table 1 to above 200 GeV using the time-average . The systematic error on the HESS flux is 20%. | MAGIC | MAGIC | |
| Epoch | I(200 GeV) | I(200 GeV) | ||
| [ cm-2 s-1] | [ cm-2 s-1] | |||
| 2005 | ||||
| 2006 | ||||
| 20052006 |
3.5 HESS Results during Suzaku Observations
The Suzaku X-ray satellite Suzaku_info (Mitsuda et al. 2007) observed PG 1553+113 from July 24, 2006, 14:26 UTC to July 25, 2006, 19:17 UTC with an average efficiency of 53% (Suzaku Observation Log: http://www.astro.isas.ac.jp/suzaku/index.html.en). HESS observed PG 1553+113 for 3.1 hours live time on the two dates of Suzaku observations. The HESS observation log on these dates, henceforth called the Suzaku epoch, is shown in Table 4. The log contains the start and stop times of the seven HESS observation runs from the two dates of Suzaku observations. In addition, the live time, observed excess and corresponding significance for each run are shown. All runs, except the last, are simultaneous with Suzaku observations. The last HESS run begins two minutes after the end of the Suzaku pointing.
During the Suzaku epoch, a total of 659 on-source events and 4462 off-source events are measured with an on-off normalization of 0.125, corresponding to an excess of 101 events (3.9). Due to the low statistics it is not possible to produce a -ray spectrum from the data. To provide a quasi-simultaneous measurement for future modeling, the -ray spectrum observed during the July 2006 dark period is shown in Figure 7a. The best fit of a power law to the July 2006 data yields , cm-2 s-1 TeV-1, and a of 4.8 for 2 degrees of freedom. Only the statistical errors are presented for and . The systematic errors are 0.1 and 20%, respectively.
The average flux131313Assuming the poorly-measured =5.01 from July 2006, instead of the time-averaged , increases the flux by only 3.5%. during the Suzaku epoch is I(300 GeV) = cm-2 s-1. The flux for each of the nights in the Suzaku epoch can be seen in Figure 5d. In addition, the flux for each HESS run (28 min) during the two nights is shown in Figure 7b. There are no significant variations of the run-wise flux during each night, or of the nightly flux during the Suzaku epoch.
| Start | Stop | Time | Excess | Significance |
|---|---|---|---|---|
| [MJD] | [h] | [] | ||
| 53940.74231 | 53940.76185 | 0.453 | 27 | 2.5 |
| 53940.76328 | 53940.78277 | 0.436 | 20 | 1.9 |
| 53940.78431 | 53940.80385 | 0.437 | 7 | 0.7 |
| 53940.80531 | 53940.82480 | 0.435 | 2 | 0.2 |
| 53941.76336 | 53941.78291 | 0.444 | 27 | 3.1 |
| 53941.78439 | 53941.80392 | 0.444 | 14 | 1.6 |
| 53941.80542 | 53941.82497 | 0.443 | 7 | 0.8 |
4 SINFONI Near-IR Spectroscopy
The determination of the redshift of an AGN is generally based upon the detection of emission or absorption lines in its spectrum. In the unified model of AGN AGN_model (Urry & Padovani 1995) emission lines are generated by ionization from the central source. However in BL Lac objects like PG 1553+113 the line-equivalent width of these emission lines is reduced, possibly even below detectable levels, by the strong beaming of the jet continuum, that is caused by the alignment of the relativistic jet with the line of sight to Earth. Absorption lines can be produced either from spectral features of the stellar population of the host galaxy or from intervening halos as in the case of quasars. The detectability of stellar spectral features depends inversely on the brightness of the central source. Therefore, the probability of detection of any spectral features is likely optimal in the near infrared (IR) wavelength range. Here, the stellar contribution to the overall continuum emission is much larger than at optical or mid-IR wavelengths due to the shape of the SEDs of the AGN and the stars. In addition, the extinction affecting the stellar light is much smaller at near-IR wavelengths than at optical (e.g. AH 0.17 AV) wavelengths schlegel (Schlegel et al. 1998).
In an attempt to detect absorption features from the host galaxy or emission lines from the AGN, H+K (1.50–2.40m) spectroscopy of PG 1553+113 was performed with SINFONI, an integral field spectrometer mounted at Yepun, Unit Telescope 4 of the ESO Very Large Telescope in Chile. The observations were performed in seeing-limited mode using the 125 mas pixel scale, with a spectral resolution of . The seeing was typically 07 FWHM during the 2.5 total hours of on-source observations performed on March 9, 2006 and March 15, 2006.
The ESO Data Reduction Pipeline Version 1.3 Jung_VLT (Jung et al. 2006) and the QFitsView141414Written by Thomas Ott (MPE, Garching); http://www.mpe.mpg.de/ott/QFitsView software are used for the data analysis. In the first steps, the images are cleaned from bad pixels, flat-fielded and wavelength calibrated. A distortion correction is then applied and the FoV of SINFONI is reconstructed. The output of this procedure is a three-dimensional (3D) cube containing about 2000 images of the source in 0.5 nm wavelength steps.
Averaging the cube along the wavelength axis enables the effective construction of a broad-band image. H-band and K-band images were thus extracted from PG 1553+113 data. These images are spatially unresolved and no underlying host galaxy is detected.
A spectrum is extracted from the final 3D cube by summing the individual spectra within an aperture of 5-pixel radius centered on the brightest peak in the image. Observations of two G2V standard stars (HIP071527, HIP088235), near both in time and air-mass to the target exposures, are used to correct for strong atmospheric (telluric) absorption. By dividing the science target spectrum by the standard star spectrum, the atmospheric absorption effects are minimized (see, e.g., Maiolino et al. (1996), Vacca et al. (2003)). However, this step introduces features into the resulting spectrum that are intrinsic to the standard star. Here, these features are accounted for by multiplication of the normalized high-spectral-resolution atmospheric-transmission-corrected solar spectrum151515NSO/Kitt Peak FTS data of the sun used here were produced by NSF/NOAO. that has been degraded to the SINFONI spectral resolution.
Flux calibration at infrared wavelengths is somewhat more problematic than at optical wavelengths since no standard spectral catalog exists. A theoretical continuum spectrum of a G2V star could in principle be used to correct for the throughput of the spectrograph. However, the flux distribution of such stars, as well as later-type ones, in the infrared is not well-reproduced by theoretical modeling, and a small error in the stellar parameters (e.g., the effective temperature or the metallicity) can yield a large error in the continuum. Instead the wavelength-dependent flux calibration is determined from observations of two intrinsically featureless (apart from strong hydrogen lines) B stars (HIP088201, HIP085812). Here the hydrogen lines are manually fit and removed from the B-star spectrum, and the result is then divided by a blackbody spectrum at the effective temperature of the stars (18500 K and 11900 K, respectively) to correct for the continuum slope of each standard star. As the H and K bands are in the Rayleigh-Jeans regime of the blackbody spectrum, the steepness of the continuum slope for these B stars is not particularly sensitive to small errors in the effective temperature. The final step of the flux calibration is setting the absolute flux scale. IR aperture photometry of PG 1553+113 was already performed but the source is known to be variable. Therefore 2MASS H magnitudes of the standard stars, converted to flux density, are used instead to scale the total flux observed here. This value, 12.71.3 mJy at 1.65m, is approximately half of that observed by Bersanelli et al. (1992) and is comparable with R-band fluxes observed (Albert et al. (2007)) in March 2006. It should be noted that the latter (March 15, 2006) of the near-IR observations reported here were performed two days before an outburst in the R-band reported by Albert et al. (2007).
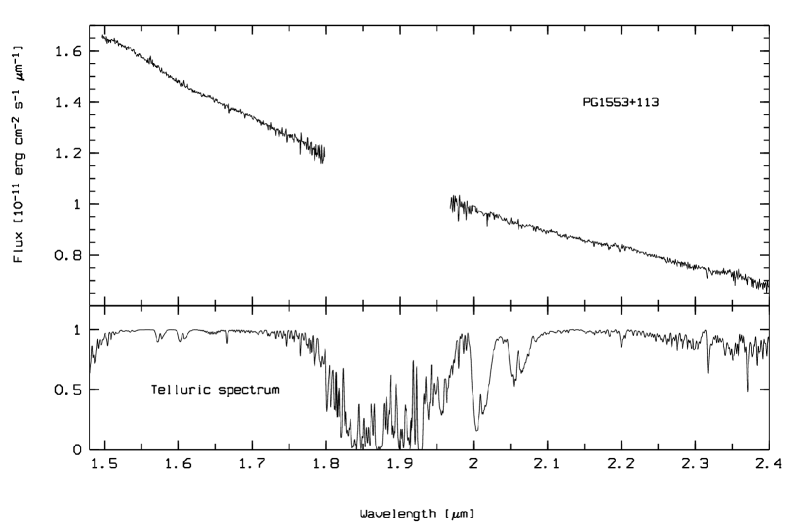
The final H+K-band spectrum of PG 1553+113 is shown in Figure 8. The signal-to-noise ratio is 250 in the H-band and 70 in the K-band. These measurements are the most sensitive ever recorded in the H- and K-bands, and are comparable to the most sensitive spectroscopy of PG 1553+113 at other wavelengths (see, e.g, Carangelo et al. (2003); Sbarufatti et al. (2006)). The lack of data between 1.801.95 m is a result of highly-reduced atmospheric transmission between the H and K bands. The observed near-IR spectrum is featureless apart from some residuals from the atmospheric correction. Thus, in neither the broad-band images nor in the spectrum are the influences of the gas of a host galaxy or the AGN detected, even though PG 1553+113 is bright in the IR. As a result, a redshift determination from these observations is not possible.
5 Discussion
The presence of Suzaku X-ray observations, simultaneous with the HESS measurements, greatly improves the possibilities for accurately modeling the underlying physics in PG 1553+113. However, the observed VHE spectrum is very soft (), which could be in large part due to the redshift-dependent absorption of VHE photons on the EBL. Modeling the VHE portion of the SED of PG 1553+113 requires the effects of this absorption to be removed. Unfortunately the redshift of the object is still unknown, despite the very sensitive new measurements presented in this article. Therefore, modeling of the VHE emission from PG 1553+113 is extremely difficult given the large range of possible intrinsic spectra.
PG 1553+113 is not the only bright BL Lac for which the underlying host galaxy is not detected, even though deep, high signal-to-noise ratio observations were conducted (e.g., O’Dowd & Urry 2005, Sbarufatti et al. (2006)) for many. The properties of their host galaxy or their AGN may be such that it is presently not possible to derive their intrinsic nature and hence redshift. In these cases, it is possible that the properties of the host are not those of giant elliptical galaxies, but correspond to the faint end of the elliptical luminosity distribution (MR 20) or that the AGN may even be hosted by a dwarf galaxy, making these BL Lac objects the radio-loud equivalent to the low-mass black-hole Seyfert galaxies dwarf (Barth et al. 2005). If this is the case, it will be very difficult to derive a firm redshift for PG 1553+113.
As mentioned in the introduction, it is possible to derive upper limits on the object’s redshift using VHE measurements, some basic assumptions about the source’s intrinsic spectrum, and an EBL density model. As yet, none of the limits derived in this fashion are particularly constraining. The strongest, and also based on the most assumptions, is Mazin_limit (Mazin & Goebel 2007). Following exactly the same methodology as in Aharonian et al. (2006a), the VHE spectrum measured here from PG 1553+113 limits the redshift to .
6 Conclusion
With a data set that is 3 times larger than previously published (Aharonian et al. 2006a ), the HESS signal from PG 1553+113 is now highly significant (10). Thus, the evidence for VHE emission previously reported is clearly verified. However, the flux measured in 2005 is now 3 times higher than first reported due to an improved calibration of the absolute energy scale of HESS. The statistical error on the VHE photon index is now reduced from 0.6 to 0.3. Nevertheless, the error of 0.34 is still rather large, primarily due to the extreme softness of the observed spectrum (). The total HESS exposure on PG 1553+113 is 25 hours. Barring a flaring episode, not yet seen in two years of observations, a considerably larger total exposure (100 hours) would be required to significantly improve the spectral measurement. This large exposure is unlikely to be quickly achieved. However, the VHE flux from other AGN is known to vary dramatically and even a factor of a few would reduce the observation requirement considerably. Should such a VHE flare occur, not only will the error on the measured VHE spectrum be smaller, but the measured photon index may also be harder (see, e.g., Aharonian et al. (2002)). Both effects would dramatically improve the redshift constraints and correspondingly the accuracy of the source modeling. Therefore, the VHE flux from PG 1553113 will continue to be monitored by HESS. In addition, the soft VHE spectrum makes it an ideal target for the lower-threshold HESS Phase-II HESSII (Punch 2005) which should make its first observations in 2009.
Acknowledgements.
The support of the Namibian authorities and of the University of Namibia in facilitating the construction and operation of H.E.S.S. is gratefully acknowledged, as is the support by the German Ministry for Education and Research (BMBF), the Max Planck Society, the French Ministry for Research, the CNRS-IN2P3 and the Astroparticle Interdisciplinary Programme of the CNRS, the U.K. Science and Technology Facilities Council (STFC), the IPNP of the Charles University, the Polish Ministry of Science and Higher Education, the South African Department of Science and Technology and National Research Foundation, and by the University of Namibia. We appreciate the excellent work of the technical support staff in Berlin, Durham, Hamburg, Heidelberg, Palaiseau, Paris, Saclay, and in Namibia in the construction and operation of the equipment. Based on ESO-VLT SINFONI program 276.B-5036 observations.References
- Albert et al. (2007) Albert, J., Aliu, E., Anderhub, H., et al. 2007, ApJ, 654, L119
- Aharonian et al. (2002) Aharonian, F., et al. (HEGRA Collaboration) 2002, A&A, 393, 89
- (3) Aharonian, F., et al. (HESS Collaboration) 2004, Astroparticle Physics, 22, 109
- (4) Aharonian, F., et al. (HESS Collaboration) 2006a, A&A, 448, L19
- (5) Aharonian, F., et al. (HESS Collaboration) 2006b, A&A, 457, 899
- (6) Barth, A.J., Greene, J.E. & Ho, L.C. 2005, ApJ, 619, 151
- (7) Beasley, A.J., Gordon, D., Peck A.B., et al. 2002, ApJS, 141, 13
- (8) Benbow, W. 2005, Proceedings of Towards a Network of Atmospheric Cherenkov Detectors VII (Palaiseau), 163
- (9) Berge, D., Funk, S. & Hinton, J. 2007, A&A, 466, 1219
- Bersanelli et al. (1992) Bersanelli, M., Bouchet, P., Falomo, R. & Tanzi, E.G. 1992, Astronomical Journal, 104, 28
- Carangelo et al. (2003) Carangelo, N., Falomo, R., Kotilainen, J., Treves, A., & Ulrich, M.-H. 2003, ASP Conference Series, 299, 299
- Falomo & Treves (1990) Falomo, R. & Treves, A. 1990, PASP, 102, 1120
- (13) Feldman, G.J. & Cousins, R.D. 1998, Phys Rev D, 57, 3873
- (14) Giommi, P., Ansari, S.G., & Micol, A. 1995, A&AS, 109, 267
- Gould & Schréder (1967) Gould, R.J., & Schréder, G.P. 1967, Phys Rev, 155, 1408
- Hauser & Dwek (2001) Hauser, M.G. & Dwek, E. 2001, ARA&A, 39, 249
- (17) Jung, Y., Lundin, L.K., Modigliani, A., Dobrzycka, D., & Hummel, W. 2006, ASP Conference Series, 351, 295
- Li & Ma (1983) Li, T. & Ma, Y. 1983, ApJ, 272, 317
- Maiolino et al. (1996) Maiolino, R., Rieke, G.H., & Rieke, M.J. 1996, Astronomical Journal, 111, 537
- (20) Mazin, D. & Goebel, F. 2007, ApJ, 655, L13
- (21) Mitsuda, K., Bautz, M., Inoue, H., et al. 2007, PASJ, 59, 1
- O’Dowd & Urry (2005) O’Dowd, M. & Urry, C.M. 2005, ApJ, 627, 97
- Osterman et al. (2006) Osterman, M.A., Miller, H.A., Campbell, A.M., et al. 2006, Astronomical Journal, 132, 873
- (24) Punch, M. 2005, Proceedings of Towards a Network of Atmospheric Cherenkov Detectors VII (Palaiseau), 509
- Sbarufatti et al. (2005) Sbarufatti, B., Treves, A., & Falomo, R., 2005, ApJ, 635, 173
- Sbarufatti et al. (2006) Sbarufatti, B., Treves, A., Falomo, R., et al. 2006, Astronomical Journal, 132, 1
- (27) Scarpa, R., Urry, C.M., Falomo, R., et al. 2000, ApJ, 532, 740
- (28) Schlegel, D.J., Finkbeiner, D.P., & Davis, M. 1998, ApJ, 550, 525
- (29) Urry, C.M. & Padovani, P. 1995, PASP, 107, 803
- Vacca et al. (2003) Vacca, W.D., Cushing, M.C., & Rayner, J.T. 2003, PASP, 115 389