11email: kehrig@iaa.es,jvm@iaa.es 22institutetext: Observatório Nacional, José Cristino, 77, 20.921-400, Rio de Janeiro - RJ, Brazil
22email: kehrig@on.br,etelles@on.br 33institutetext: Centro Astronómico Hispano Alemán, Calar Alto, CSIC-MPG, C/ Jesús Durbán Remón 2, E-04004 Almeria, Spain
33email: sanchez@caha.es 44institutetext: Laboratoire d’Astrophysique de Toulouse et Tarbes (LATT - UMR 5572), Observatoire Midi-Pyrnes, 14 avenue E. Belin, 31400 Toulouse, France 44email: enrique.perez@ast.obs-mip.fr
The interplay between ionized gas and massive stars in the HII galaxy IIZw70: integral field spectroscopy with PMAS
Abstract
Aims. We performed an integral field spectroscopic study for the HII galaxy IIZw70 to investigate the interplay between its ionized interstellar medium (ISM) and the massive star formation.
Methods. Observations were taken in the optical spectral range from 3700 Å - 6800 Å with the Potsdam Multi-Aperture Spectrophotometer (PMAS) attached to the 3.5 m telescope at Calar Alto Observatory. We created and analyzed maps of spatially distributed emission-lines (at different stages of excitation), continuum emission, and properties of the ionized ISM (ionization structure indicators, physical-chemical conditions, dust extinction, kinematics). We investigated the relation of these properties to the spatial distribution and evolutionary stage of the massive stars.
Results. For the first time we have detected Wolf-Rayet (WR) stars in this galaxy. The peak of the ionized gas emission coincides with both the location of the maximum of the stellar continuum emission and the WR bump. The region of the galaxy with lower dust extinction corresponds to the region that shows the lowest values of velocity dispersion and radial velocity. The overall picture suggests that the ISM of this region is being disrupted via photoionization and stellar winds, leading to a spatial decoupling between gas+stars and dust clouds. The bulk of dust appears to be located at the boundaries of the region occupied by the probable ionizing cluster. We also found that this region is associated to the nebular emission in HeII4686 and to the intensity maximum of most emission lines. This indicates that the hard ionizing radiation responsible for the HeII4686 nebular emission can be related to the youngest stars. Within 0.4 0.3 kpc2 in the central burst, we derived oxygen abundances using direct determinations of [OIII]. We found abundances in the range 12+log(O/H)= 7.65 - 8.05, yielding an error-weighted mean of 12+log(O/H)=7.86 0.05 that has been taken as the representative oxygen abundance for IIZw70.
Key Words.:
ISM: HII regions – ISM: ionization structure – Massive stars – Galaxies: abundances – Galaxies: dwarf – Galaxies: individual (IIZw70)1 Introduction
The HII galaxies are gas-rich, dwarf systems that have experienced intense recent or ongoing violent star formation (SF). These objects were identified for the first time by Haro (1956) and Zwicky (1964), and are characterized by the presence of giant HII regions that dominate their observable properties at optical wavelengths. In particular, their integrated spectra are very similar to those of giant extragalactic HII regions in spiral galaxies (Sargent & Searle 1970). The analysis of their emission line spectrum indicates that HII galaxies are metal poor objects (1/40 Z⊙ Z 1/3 Z⊙; e.g. Kunth & Sargent 1983).
HII galaxies are ideal laboratories for probing the interplay between massive SF and the ISM in low metallicity environments. The massive SF process in dwarf galaxies has effects on the properties of the surrounding ISM. A large number of massive stars (between 104 - 106 solar masses of gas are transformed into stars in HII galaxies) are formed almost simultaneously within relatively small volumes (e.g. Melnick 1992). Millions of years after the onset of the burst, the most massive stars begin to explode as supernovae, creating violent, short-lived injections of kinetic energy and metallic elements into the ISM. The disruption of the ISM may significantly affect the spatial distribution of gas and dust particles in the regions close to the massive star cluster, and also determine the way in which new metals ejected by massive stars are mixed with the original gas from which the stars formed (Kunth & Östlin 2000).
High spatial resolution imaging has revealed that in many HII galaxies the ionized material presents a complex structure: star clusters in the main body (with a non-uniform distribution of SF knots, ensembles of star clusters, or individual super stellar clusters) of the galaxy and external gas components outside the young stellar clusters (e.g. Martin & Kennicutt 1995, Vílchez & Iglesias-Páramo 1998, Papaderos et al. 2002). Thus, a two-dimensional analysis of the ionized material in HII galaxies yields spatially resolved information on properties of the ionized gas. The study of the distribution of these properties is an important issue for our understanding of the interplay between the massive stellar population and the ISM.
However, up to now only a few two-dimensional spectroscopic studies of HII galaxies have been performed. Recent work by Izotov et al. (2006) presents two-dimensional spectroscopy of the extremely metal-deficient HII galaxy SBS 0335-052E. They found a small gradient of the electron temperature and oxygen abundance, and the presence of an ionized gas outflow in the perpendicular direction to the galaxy disk. Cairós et al. (2002), using two-dimensional spectroscopy, obtained the ionized gas velocity field in the central part of Mrk 370.
In this paper, we present a two-dimensional spectroscopic study for the HII galaxy IIZw70. This galaxy is number 70 in Zwicky’s second list of “Compact Galaxies and Compact Parts of Galaxies, Eruptive and Post-eruptive Galaxies”(Zwicky & Zwicky 1971). IIZw70 has been classified as an HII galaxy (Sargent 1970). The basic data of IIZw70 are shown in table 1. This object is interacting with its nearby companion IIZw71 at a projected distance of 23 kpc (assuming a distance to the IIZw70-71 system of 18.1 Mpc; see table 1). The ongoing interaction is indicated by interferometric H I studies (Balkowski et al. 1978, Cox et al. 2001) which revealed a gaseous streamer connecting IIZw70 with the polar ring galaxy candidate IIZw71 (Whitmore et al. 1990, Reshetnikov & Combes 1994). Cairós et al. (2001) show that IIZw70 presents very elongated outer isophotes and a very blue (U-B = -0.89) nuclear starburst in what seems to be an edge-on disk. They also find that the starburst activity is concentrated in the optical center of the galaxy and is surrounded by faint gaseous emission with quite a distorted morphology.
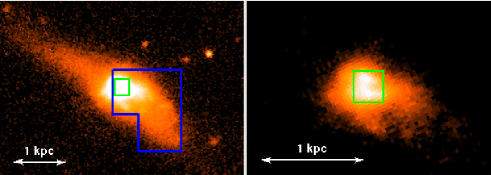
In figure 1 we show the images of IIZw70 in the r (left image) and u (right image) bands extracted from SDSS111The Sloan Digital Sky Survey website is http://www.sdss.org. Over the r filter image, we marked the field of view used in this work (blue box mosaic).
In this work, we investigate the relation between massive SF process and the ionized ISM in IIZw70 using integral field spectroscopy (IFS). In order to do this we created and analyzed maps of spatially distributed emission-lines, continuum emission and physical-chemical properties of the ionized gas (electron temperature and density, gaseous metal abundances, dust extinction, excitation). We present a discussion on the significance of the chemical abundance variation found here. We also present a brief study of the kinematic properties of the ionized gas. The relationship between the physical-chemical and kinematic properties spatial distribution is discussed.
| Parameter | Value |
| Name | IIZw70 |
| Other designations | UGC 9560, Mrk 829 |
| R.A. (J2000.0) | 14h 50m 56.5s |
| DEC. (J2000.0) | +35d 34’ 18” |
| redshift | 0.004 |
| MB222Absolute magnitude in B from Cairós (2001)(mag) | -16.3 |
| mB333Apparent magnitude in B from Deeg et al. (1997)(mag) | 15.1 |
| D444Distance to the galaxy from Cox et al. (2001)(Mpc) | 18.1 |
| MHI555Neutral hydrogen mass from Thuan & Martin (1981)() | 0.34 x 10⁹ |
| Z666Metallicity from Kobulnicky & Skillman (1996)/Z⊙ | 1/5 |
In the following section we describe the observations and data reduction. In Sect.3 the results are presented. We discuss our results in Sect.4.
2 Data
2.1 Observations
IFS allows us to simultaneously collect spectra of many different regions of an extended object, under identical instrumental and atmospheric conditions. This is not only a more efficient way of observing, but it also guarantees the homogeneity of the dataset.
The spectra of IIZw70 were taken with PMAS that is an integral field unit (IFU) developed at the Astrophysikalisches Institut Potsdam (Roth et al. 2005). It is currently installed at the Calar Alto Observatory 3.5 m Telescope. Two pointings of the galaxy (IIZw70-NE and IIZw70-SW) were taken in order to cover the central regions and different regions of interest of the galaxy (e.g. the tails).
The log of observations is given in table 2. The V300 and V1200 gratings present a dispersion of 1.6 Å/pixel and 0.36 Å /pixel, respectively. The PMAS spectrograph is equipped with 256 fibers coupled to a lens array. Each fiber has a spatial sampling of on the sky resulting in a field of view of . Calibration images were obtained following the science exposures and consisted of emission line lamps spectra (HgNe), and spectra of a continuum lamp needed to locate the 256 individual spectra on the CCD. Observations of the spectrophotometric standard stars BD +28∘4211 and Hz44 were obtained during the observing nights for flux calibration. The nights were photometric and the typical seeing during the observations was 1′′.
| Pointing | Exptime | Grating | Spec. range | Date |
|---|---|---|---|---|
| IIZw70 | (s) | ( Å ) | ||
| IIZw70-NE | 3x750 | V300 | 3900-7049 | 05/08/2005 |
| IIZw70-SW | 3x750 | V300 | 3900-7049 | 05/08/2005 |
| IIZw70-NE | 3x1200 | V1200 | 4330-5020 | 06/08/2005 |
| IIZw70-SW | 3x1200 | V1200 | 4330-5020 | 06/08/2005 |
| IIZw70-NE | 3x1200 | V1200 | 3610-4379 | 04/06/2006 |
| IIZw70-SW | 3x1200 | V1200 | 3610-4379 | 04/06/2006 |
2.2 Data reduction
We reduced the data using the software R3D (Sánchez 2006). Different exposures taken at the same pointing were combined using IRAF777IRAF is distributed by the National Optical Astronomy Observatories. tasks. The expected locations of the spectra were traced on a continuum-lamp exposure obtained before each target exposure. After bias subtraction, we extracted the target spectra by adding the signal from the 5 pixels around the central traced pixel (that is the total object spectrum width). With exposures of Hg and Ne lamps obtained immediately after the science exposures, the spectra were wavelength calibrated. We checked the accuracy of the wavelength calibration using sky emission lines, and find standard deviations of 0.5 Å and 0.3 Å for the V300 and V1200 gratings, respectively. The continuum-lamp exposure was also used to determine the response of the instrument for each fiber and wavelength (the so-called flat-spectra). We used these flat-spectra in order to homogenize the response of all the fibers. The average nearby background spectrum, obtained moving the IFU off-target, was subtracted from the target spectra. For the standard star observations we co-added the spectra of the central fibers and compared the one-dimensional standard star spectrum with table values to create a sensitivity function. The spectra were flux calibrated using IRAF.
The reduced spectra were contained in two data cubes, each one corresponding to a different PMAS pointing. The two data cubes were mosaiced into a single frame (see the blue box mosaic in figure 1). We corrected the mosaic data cubes for the effect of differential atmospheric refraction using the R3D package (Sánchez 2006). We recentred and scaled the mosaic data cube taken in 2006 with respect to the mosaic data cubes obtained in 2005 making use of the H emission line, common to the wavelength ranges of both gratings. Further manipulation of the cubes, such as the production of emission-line maps was performed using E3D (Sánchez 2004).
2.3 Line intensities
Using the software FIT3D (Sánchez et al. 2007), we fitted line profiles on the extracted one-dimensional spectra in order to derive the integrated flux of each emission line. A single gaussian was fitted to each emission line, using a polynomial function to characterize the continuum. The software FIT3D allows definition of emission line systems, i.e., a kinematically coupled set of emission lines with the same width. This was essential for accurate deblending of the lines, when necessary.
For each fiber spectrum we derived its corresponding reddening coefficient, C(H), using the value of the Balmer decrement derived from H/H, as compared to the theoretical value expected for case B recombination from Storey Hummer (1995), and applying the extinction law given by Whitford (1958). Thus, the fluxes of the emission lines for each fiber were corrected for extinction using their corresponding C(H) value.
Equivalent widths (EWs) of Balmer emission lines are so high [e.g. EW(H) 40-120 Å] that the effect of the underlying stellar population in these lines appears not to be important [underlying absorption-lines EWs present typical values of 1-2 Å ; see e.g. McCall et al. (1985)]. In addition, we carried out an eye-inspection, fiber-by-fiber, of the H and H emission lines, and we did not find any stellar absorption features (e.g. wings of absorption lines) underlying these emission lines.
We calculated the error in the line fluxes, , from the expression = N1/2[1+EW/N]1/2 (Catellanos 2000) where represents a standard deviation in a box centred close to the measured emission line, N is the number of pixels used in the measurement of the line flux, EW is the equivalent width of the line, and is the wavelength dispersion in Å/pixel. This expression takes into account the error in the continuum and the photon counts statistics of the emission line. The error measurements were performed on the extracted one-dimensional spectra.
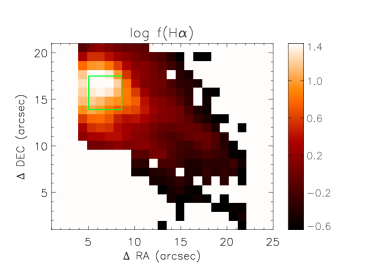
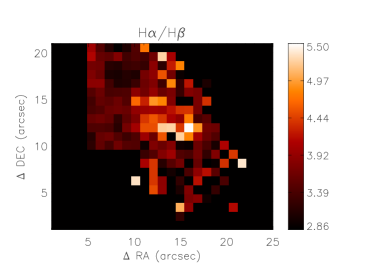
H emission line map (continuum subtracted) and the spatial distribution of H/H are shown in figure 2. The dust distribution seems to be non uniform across the galaxy. We would like to stress that in the following sections, all emission line fluxes, used to derive the ionization structure and physical-chemical parameters, are corrected for extinction using the corresponding value of C(H) for each fiber.
3 Results
3.1 Galaxy structure
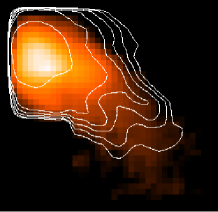
In figure 3 we show the continuum emission near H and H maps, together with the corresponding H and H emission line intensity contours overplotted. The galaxy’s morphology appears very similar in emission lines and in continuum emission, i.e. the continuum and emission line maps (as seen from the contours in figure 3) show a central region with ionized gas and a faint extension towards the south-west. However we note that in the emission line contours we can resolve clearly two filamentary structures, with a tail-like shape, at the faintest extensions of the galaxy which are not present in the continuum maps.
The r filter image in figure 1 shows a red extension already found by Cairós (2001) and Kong et al. (2003). Such a red extension could indicate the likely existence of an intermediate-old underlying stellar population. Kong et al. (2003) studied the stellar content of a sample of 73 HII galaxies by analysing their continuum spectra and absorption features. They showed that in most of HII galaxies (the galaxy IIZw70 is among them), stars older than 1 Gyr exist. The average colours of the low-surface-brightness component (B-V = 0.47, V-I = 0.89) are also consistent with an evolved stellar background with an age of 1-3 Gyr for IIZw70, as shown by Cairós (2001).
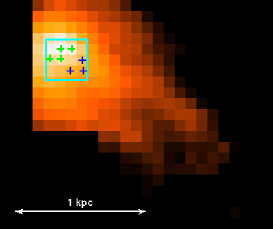
The u band (right image in figure 1) is expected to trace the youngest stellar populations. The box in this image coincides with the u band maximum and encloses the region occupied by the probable brightest young clusters. We also show the exact location of this box in the r image of IIZw70 as a reference (left image). We verified that the location of the probable youngest stellar population, as seen in the u image, coincides with the central bright SF knot and with the zone of maximum in the continuum emission (see figures 3 and 4).
3.2 Ionization structure and excitation sources
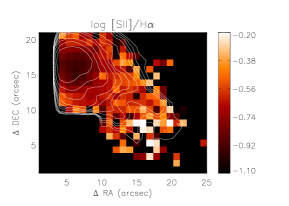
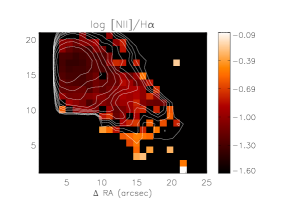
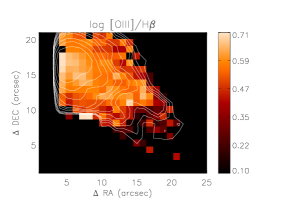

The line ratio maps for the usual diagnostic lines (e.g. Baldwin et al. 1981; Osterbrock & Ferland 2006) can be used to investigate the spatial distribution of the ionization structure of the ionized nebulae. Figure 5 shows the line ratio maps (in logarithmic scale) for [NII]6584/H,[SII]6717,31/H, [OIII]5007/H. H emission line flux contours are plotted over all maps. High excitation values correspond to low values of the first two ratios and to high values of the last one.
It can be seen that [NII]6584/H as well as [SII]6717,31/H increases in zones where the H intensity decreases; [OIII]5007/H presents the opposite trend. This behaviour towards lower excitation when the intensity is smaller can be related to the increasing distance from the young stellar clusters, with the corresponding decrease in the local values of the ionization parameter, as it is typical in extended HII regions (see McCall et al. 1985)
Figure 6 shows the classical BPT diagnostic diagrams (Baldwin et al. 1981) using our own data. Only fibers that present diagnostic line-intensity ratios with relative errors 30 are plotted. The solid lines (adapted from Osterbrock & Ferland 2006) show the locus of separation between regions dominated by photoionization (HII-regions like; left of the line) and regions dominated by shocks. Our data show that the line ratios for most positions in the galaxy are located in the general locus of HII-region like objects.
There are a few fibers, located at the tail-like regions (see the [SII]6717,31/H map in figure 5), with values of [SII]6717,31/H somewhat higher that are found outside the HII-region zone. These values are consistent with predictions from shock models (Dopita & Sutherland 1995) suggesting the presence of shocks in the ionized gas outflow scenario proposed in section 3.5. Nonetheless, we must keep in mind that the line ratios of both axis plotted in figure 6 are sensitive to the metallicity, as well as, to the ionization parameter. Besides, as these line ratios can vary within an HII galaxy (i.e. across giant HII regions), thus BPT diagnostic diagrams on spatially resolved data of HII galaxies should be studied in depth though that is not the purpose here.
3.3 Wolf-Rayet stellar population
WR stars are the evolved descendants of massive O progenitor stars (Maeder & Conti 1994). Stellar evolution theory predicts few WR stars to form in a low-metallicity environment such as in IIZw70 (e.g. Meynet 1995). Therefore WR star detections in low metallicity HII galaxies have important implications for the stellar evolution theory. A common property of HII galaxies with WR stars (WR galaxies), provided that our understanding of stellar evolution is correct, is the existence of ongoing active or recent SF which has produced stars massive enough to evolve to the WR stage. This typically indicates ages of a few Myr for stars with initial masses 20 (Maeder & Conti 1994).
The presence of WR stars can be recognized via the WR bumps around 4650 (blue bump) and 5808 (red bump), which are generally a blend of HeII and several metal lines. The blending of several stellar and nebular emission lines around 4686 and the complex spatial morphology in ground-based data make it challenging to disentangle the emission of stars and gas and to derive the WR content and the corresponding nebular properties.
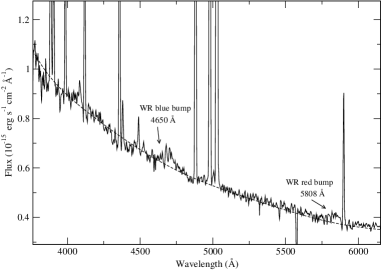
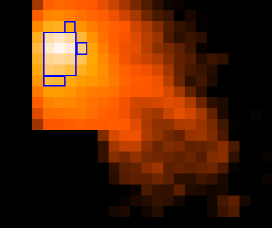
For the first time we detected WR stars in IIZw70. Summing the emission from 4 fibers (green crosses in figure 4) we can observe the blue and red bumps, – the latter marginally detected –, in the corresponding spectrum (see figure 7). This detection would indicate that WR bumps are being seen in an extended area ( 4 arcsec2). The use of the IFS minimises the difficulty in correlating spectra and image location, shown in other works (e.g. de Mello et al. 1998). The WR bumps intensity maximum coincides with the likely youngest clusters location (as shown in the u SDSS image; see figures 1 and 4) and, within 1′′, also spatially coincides with the peak of the H emission. In addition we verified that the maximum of the continuum emission adjacent to H ( 4800 Å) corresponds spatially to the WR bumps intensity maximum. From the spectrum shown in figure 7 we measured a value of EW(WRbump) of -2.2 0.6 Å for the WR blue bump and a corresponding 100 x I(WRbump)/I(H) of 4.6 1.1 .
An area of HeII4686 narrow emission was found in 3 fibers located in the southwest corner of the box encompassing the probable central brightest clusters (see figure 4); the line is narrow showing approximately the same width as the [OIII] lines, confirming its correct identification as a nebular line. The presence of the nebular HeII4686 line should indicate the existence of a very hard ionizing spectrum.
3.4 Physical properties and abundance analysis
We calculated the physical properties and ionic abundances of the ionized gas for IIZw70 following the 5-level atom FIVEL program (Shaw & Dufour 1994) available in the task IONIC of the STSDAS package. Total abundances were derived as we detail in the following. We calculated the final quoted errors in the derived quantities by error propagation taking into account errors in flux measurements.
We obtained the electron densities (Ne) from the [SII]6717/6731 line ratio. Although [OII]3726,29 emission lines are brighter than [SII] 6717,31, the spectral resolution is at the limit to resolve accurately the [OII] doublet lines. [OII] densities are roughly consistent with [SII] densities within the errors.
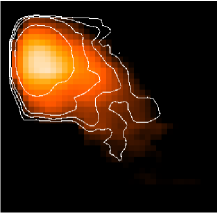
We derived the electron temperature values of Te[OIII] using the [OIII]4363/4959,5007 line ratio. Te[OII] was calculated from the relation between [OII] and [OIII] electron temperatures given by Pilyugin et al. (2006). We were able to measure the faint auroral line [OIII]4363 for 16 fibers with high S/N leading to relative errors lower than 10. These fibers cover a projected area of nearly 19 arcsec2 equivalent to 0.4 0.3 kpc2, including the central starburst region. This area is shown in figure 8 superposed on the H emission map. Te[OIII] values used to derive the ionic abundance O++ were derived from emission line fluxes from the high spectral resolution observations in order to avoid any possible contamination of 4363 by terrestrial HgI emission. Nevertheless we compared the Te[OIII] values derived from both our low and high spectral resolution observations, finding that the measurements coincide within the errors.
Figure 9 shows the distribution of the electron temperature Te[OIII] (top left panel), electron number density derived from the [SII]6717,31 emission lines (top right panel) and the total oxygen abundance spatial distribution (bottom panel). The errors are quoted in parenthesis. We show only the fibers where the [OIII]4363 emission line could be well measured.
We did not find any statistically significant variance for the electron number density; Ne values are of the order 100 cm-3 approximately, within the errors. We saw that there are some variations in the derived electron temperature (11700 - 16000 K). The derived values of Te[OIII] versus the error in the [OIII]4363 line were plotted and no correlation was found, indicating that no significant noise contribution near 4363 was included in the flux measurements.
With regards to the oxygen ionization correction factor (ICF), a small fraction of O/H is expected to be in the form of the O3+ ion in the high-excitation HII regions when the HeII4686 emission line is detected. We have a measurement of the HeII4686 emission line in 3 fibers. According to the photoionization models from Stasińska & Izotov (2003), the O3+/O can be in the order of 1 only in the highest-excitation HII regions [O+/(O+ + O2+) 0.1]; therefore, taking our abundance results into account, this ICF correction was assumed to be negligible in our case.
The oxygen abundance derived for the 16 positions studied does not show correlation with the ionization degree over the whole range in O2+/O+. There are some variations in the derived oxygen abundance in the range 12+log(O/H)= 7.65 to 8.05. The error-weighted mean of the derived oxygen abundance values is 12 + log(O/H) = 7.86 0.05 (1). 14 out of 16 O/H measurements are consistent with this mean value at 2 ( 0.1 dex). The other 2 measurements present values of O/H consistent, within the errors, with 3 of the weighted mean. Bearing in mind that the errors quoted in the oxygen abundance do not account for some observational uncertainties (e.g. pointing errors, seeing variations, etc) nor for errors associated to the reddening correction and flux calibration, we must assume that the variations in the derived oxygen abundance may not be statistically significant.
In our spectra, neon is seen via the [NeIII] emission line at 3869 Å. For this ion, we took the [OIII] electron temperature as representative of the high excitation zone. We calculated the neon abundance assuming that
Regarding [SII] and [NII] temperatures we assumed the approximation Te[SII] Te[NII] Te[OII] as valid, since no auroral line could be measured in the low excitation zone. The N/O abundance was derived under the assumption that


Regarding N/O and Ne/O abundance ratios, evaluating the contribution of all observational errors to the derivation of these abundances, it can be concluded that there is no statistical evidence for any systematic variation of N/O and Ne/O [-1.150.09 log(N/O) -0.900.11; -1.070.18 log(Ne/O) -0.840.10] with O/H for the range of abundances studied in this work. The values of the error-weighted mean for log(N/O) and for log(Ne/O), -1.04 0.06 dex and -0.97 0.08 respectively, are consistent, within the errors, with the log(N/O) and log(Ne/O) solar values, -0.86 0.12 and -0.82 0.11 (Lodders 2003), with N/O being slightly ( 0.1 dex) lower than solar. The error-weighted mean value for log(N/O) in IIZw70 is significantly higher ( 0.4 dex) than the mean for metal-poor HII galaxies [log(N/O) = -1.46 0.14 for galaxies with 7.6 12+log(O/H) 8.2; Izotov & Thuan 1999]. Still the N/O ratio of IIZw70 is consistent with values found for a few HII galaxies in the literature (Nava et al. 2006, Izotov & Thuan 1999) with similar metallicity. As regards Ne/O abundance ratio, the error-weighted mean value for log(Ne/O) derived here (-0.97 0.08) is lower than the mean value of -0.72 0.07 obtained by Izotov & Thuan 1999. However, they also found some galaxies with log(Ne/O) similar to the values derived in this paper. In any case we should bear in mind that neither the literature long-slit measurements we are comparing to nor our IFU mosaic cover the entire galaxy.
3.4.1 Physical properties and chemical abundances from the integrated spectrum of IIZw70
In this section some of the more interesting spectroscopic properties of the ionized gas in IIZw70, derived by analysing the integrated spectrum are described. We obtained the integrated spectrum of IIZw70 by summing the emission from each fiber within an area of 300 arcsec2 ( 1.8 kpc2), enclosing the whole nebular emission.Integrated spectra were obtained for low and high spectral resolution.
The analysis of the integrated spectrum presents several advantages. Contrary to previous studies that attempt to describe the average ionization conditions in the ionized nebula using individual spectra taken at different locations, we were able to describe the average spectroscopic properties over an extended region. Another advantage is that the integrated spectrum does not suffer from systematic effects that may be found for the spectra obtained with smaller apertures (Kewley et al. 2005). These apertures are usually centered on bright SF knots, presenting a bias towards young populations (as a matter of fact in most spectroscopic surveys of HII galaxies carried out up to now). Furthermore, one can compare the real integrated properties of the local SF dwarf galaxies with the properties of SF galaxies in intermediate/high redshift for which only their integrated characteristics are known due to their distance.
The emission lines corresponding to the integrated spectra were measured following the same procedure as in Kehrig et al. (2004). Reddening corrected line intensities, normalized to H are shown in table 3, as well as the value of C(H), estimated using the H/H and H/H ratios, the reddening corrected flux of H, F(H), EW(H), EW(H), and corrected velocity dispersion (see next section for details) derived from H and [OIII]4959. The effect of the underlying absorption in the hydrogen lines appears not to be important; a 0.3 Å EW correction for the underlying absorption on the integrated spectrum would be enough to bring the observed Balmer ratios to their theoretical value within the errors.
From the reddening corrected line intensities of the integrated spectrum we derived ionization structure indicators, physical conditions and chemical abundances (see table 4). These quantities were derived as described in section 3.4 for individual fibers.
| Ion | flux | |
|---|---|---|
| 3726 [OII] | 1.03 0.01 | |
| 3729 [OII] | 1.38 0.02 | |
| 3868 [NeIII] | 0.31 0.01 | |
| 3889 H8+HeI | 0.19 0.01 | |
| 3970 H+[NeIII] | 0.08 0.01 | |
| 4101 H | 0.24 0.01 | |
| 4340 H | 0.45 0.01 | |
| 4363[OIII] | 0.07 0.01 | |
| 4471 HeI | 0.06 0.01 | |
| 4861 H | 1.00 0.02 | |
| 4959[OIII] | 1.20 0.01 | |
| 5007[OIII] | 3.76 0.03 | |
| 6563 H | 2.80 0.03 | |
| 6584 [NII] | 0.17 0.01 | |
| 6678 HeI | 0.03 0.01 | |
| 6717 [SII] | 0.29 0.01 | |
| 6731 [SII] | 0.20 0.01 | |
| C(H) | 0.30 | |
| F(H) | 10.72 0.14 | |
| F(H) | 3.83 0.05888Assuming H/H = 2.80 for Case B recombination (Storey & Hummer 1995) | |
| EW(H)(Å) | -221 18 | |
| EW(H)(Å) | -44 1 | |
| (H) (km/s) | 19 3 | |
| ([OIII]4959) (km/s) | 21 3 |
| Parameter | Integrated |
|---|---|
| (O iii)(104 K) | 1.46 0.08 |
| (O ii)999([OII]) using ([OII])= 0.72([OIII])+0.26 (Pilyugin et al. 2006)(104 K) | 1.31 0.06 |
| (O ii)(cm-3) | 80:101010Uncertain value |
| (S ii)(cm-3) | 144 27 |
| 12+log O+/H+ | 7.40 0.05 |
| 12+log O2+/H+ | 7.620.05 |
| 12+log (O/H)111111O/H abundance derived using Te[OIII] | 7.83 0.04 |
| 12+log(O/H)121212O/H derived from P-method (Pilyugin & Thuan 2005) | 7.99 0.20 |
| 12+log N+/H+ | 6.230.03 |
| log N/O | -1.17 0.06 |
| 12+log Ne2+/H+ | 6.960.06 |
| log Ne/O | -0.67 0.07 |
| 12+log S+/H+ | 5.79 0.03 |
| 103 He+/H+ (4471) | 76 15 |
| 103 He+/H+ (6678) | 85 17 |
| log R23131313R23 = ([OII]3726.29+[OIII]4959,5007)/H | 0.88 0.03 |
| log [OIII]/[OII]141414[OIII]4959,5007/[OII]3726.29 | 0.33 0.01 |
| log [NII]/[OII]151515(1.3 x [NII]6584)/[OII]3726.29 | -1.04 0.02 |
| log [SII]/H161616[SII]6717.31/H | -0.75 0.01 |
3.5 Kinematics of the ionized gas
One of the advantages to using two-dimensional spectroscopy is that the spatial distribution of the kinematics of the ionized gas can be studied when using high enough spectral resolution. Radial velocity and line widths ( = FWHM/2.35) were obtained by fitting a single Gaussian to the emission line. The width is corrected for the instrumental profiles and for the thermal motions, following the formula:
where cor, obs, ins and ther are the corrected width, the observed width, the width of the instrumental profile and the width due to the thermal motions, respectively. The ins is obtained from the profiles of emission lines of lamps, which is 45 km s-1 in our high dispersion spectra. To derive the width of the thermal profile the electron temperature (=14600K) derived from the integrated spectrum is used as a representative value, finding a value of 3 km s-1 to be applied to the [OIII]4959 emission line.
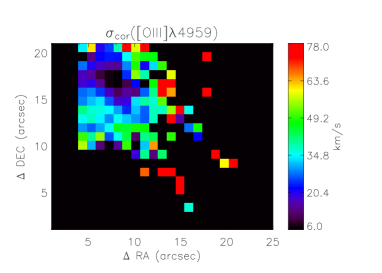
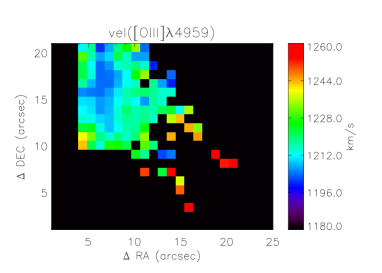
In figure 10 the maps of radial velocity and of corrected velocity dispersion, cor, resulting from single Gaussian fits to the [OIII]4959 emission line are shown.
The corrected velocity dispersion cor map shows the maximum values associated to the tails region of the galaxy, with cor decreasing towards the brightest zones. This map also shows a conspicuous minimum close to the position of the minimum radial velocity. In addition, the corrected velocity dispersion values measured from the integrated spectrum (see table 3) are similar to those obtained for the brightest part of the galaxy (see figure 10). This is because the velocity dispersion for HII galaxies is expected to be dominated by the central (core) component as shown by Telles et al. (2001). The map of the velocity field observed presents a radial velocity minimum coincident with the locus of the central burst. The difference between this minimum and the highest values of radial velocities, found in the tails to the southwest, is of 60 km/s.171717Cox et al. (2001) found a value of 67 km/s for the rotational speed of the HI neutral gas. This blueshifted emission could be produced by an outflow from the bright burst of the galaxy. We assume the outflow interpretation because of the double-tail morphology of the ionized gas and the cor increasing towards the tails region of the galaxy; whereas for a disk, gas velocity dispersion is expected to fall with radius (Binney & Tremaine 1987, Bertola et al. 1995).
4 Discussion and conclusions
4.1 Ionized gas and massive stars
We analyzed integral field spectroscopic observations of the HII galaxy IIZw70 in order to investigate the interplay between the massive stars and the ionized gas. This galaxy is interacting with its nearby companion IIZw71. The contiguous streamer of gas between IIZw70 and IIZw71, as well as the SF activity seen in both, indicate an ongoing interaction and possible gas interchange between these two galaxies (Cox et al. 2001). We studied the spatial distribution of properties of the ionized gas (electron temperature and density, chemical abundances, dust extinction, excitation, kinematics) from different emission-line maps. These maps reveal a central starburst (Cairós et al. 2001, 2001) surrounded by an extended lower excitation, low surface brightness ionized component. From our integrated flux in H, corrected by extinction, we derived a star formation rate of SFR(H) = 0.3 M⊙/yr for IIZw70 following Kennicutt (1998); this value is in agreement with the value we derived using the flux reported in Gil de Paz et al. (2003) from CCD H imaging. Kewley et al. (2002), using long-slit spectroscopic mapping, derived a SFR(H) = 0.19 M⊙/yr181818We calculated this value converting the SFR(H) given in Kewley et al. (2002) from the distance they adopted to the distance adopted in this paper (see table 1).. Different integration areas and C(H) values could be possible reasons for the discrepancy between our SFR(H) measurement and the value found by Kewley et al. (2002).
For the first time we detected the presence of WR stars in IIZw70. For the blue bump, our measurements of the equivalent width, EW(WRbump) = -2.2 0.6 Å, and of the ratio 100 x I(WRbump)/I(H) = 4.6 1.1 (section 3.3) are in good agreement with the predictions of the evolutionary synthesis models Starburst99 (assuming a Salpeter IMF, Mupper = 120 M⊙ and Z=0.004 with high mass loss; Leitherer et al. 1999). The models predict EW(WRbump) values around -2 Å at 3.2 Myr after an instantaneous burst. Corresponding predictions for 100 x I(WRbump)/I(H) give values around 3.6 Myr. This fact indicates that the central burst in IIZw70 is very young. Assuming an age for the burst of 3.2 Myr (as deduced from our measurements), we obtained a ratio of WR/O = 0.056 from Starburst99. The presence of a bump at 5800 Å could be an indicator of the existence of WC stars. A broad feature at this wavelength has been marginally detected in the same spectra, and though the measured EW is consistent with the same model predictions, its statistical significance is poor due to the low S/N. Overall, a total number of 17 WN+WC stars are predicted by the models from our findings.
The nebular emission of HeII4686 detected in this work is shown to be spatially extended, though it is not coincident with the location of the WR bumps by a few arcsec191919We should bear in mind, however, that a small contribution of nebular HeII4686 could have remained unnoticed in the broad feature. This nebular HeII emission is seen to the southwest of the box encompassing the probable ionizing clusters (see figure 4), suggesting the existence of very hard ionizing radiation which, in principle, could not be necessarily related to the WR stars located towards the northeast corner.
In the overall picture, IIZw70 is dominated by the presence of a young central starburst with a significant SFR. The peak of the H emission is located close to the probable youngest stellar clusters (see figure 4). These young starburst could be producing strong winds which have been able to develop an ionized gas outflow from which we see the blueshifted component as a feature in the radial velocity map of the galaxy (see figure 10). This outflow is thought to have been responsible for the minimum in optical extinction (slightly displaced from H emission peak by 2′′ to the west) apparent in the H/H map, where dust could have been swept up by the wind. The characteristic size ( 150 pc) and velocity ( 60 km/s) of the outflow zone are consistent with previous findings in the literature (see e.g. Roy et al. 1991) for the giant HII complex NGC 2363). We can also see that the area with lower dispersion velocity partially overlaps with the zone of the gas outflow, between the probable ionizing clusters location and the zone of minimum extinction. From the kinematical point of view, this picture appears to be consistent with the velocity dispersion map. The narrowest line profiles are dominated by the bulk of the emission from the central HII regions, as expected (Telles et al. 2001), whereas the rest of the ionized gas, with a lower surface brightness, seems to be suffering the effects of the winds and its kinematics should be associated to the structures generated by the likely interaction of the winds with the ambient medium. This situation is reminiscent of what has been found for other extragalactic HII regions and HII galaxies (e.g. Muñoz-Tuñón et al. 1996, Telles et al. 2001) which host strong starbursts.
4.2 Chemical enrichment and abundance variations
In this section, based on our chemical abundance measurements, we present an analysis on the chemical enrichment of the ionized gas and chemical abundance variations in IIZw70.
The oxygen abundance derived here for the integrated spectrum of IIZw70 is 12 + log(O/H) = 7.83 0.04. Previous works reported direct values of oxygen abundance for IIZw70 using long-slit spectra positioned in different places across the brightest regions of IIZw70. Lequeux et al. (1979) quoted a value of 8.07; Kobulnicky & Skillmann (1996) derived an oxygen abundance of 8.07 0.08 whereas Shi et al. (2005) found 12+log (O/H) = 7.69. In principle, the differences between our O/H measurement and the values found in the literature could be explained by different integration areas (see figure 9, bottom panel; Kewley et al. 2005) and atomic parameters used.
Thus far, in most works on chemical abundances in dwarf galaxies there is no clear evidence of abundance variations. Though selected examples of nitrogen enhancement in dwarf galaxies have been reported in the literature, notably the case of NGC 5253 (e.g. López-Sánchez et al. 2006 and references therein), this is not the case of O/H. Many works in the literature have searched for a possible oxygen abundance variation within dwarf galaxies. Kobulnicky & Skillman (1996) presented optical spectroscopic chemical measurements of the ISM in the irregular galaxy NGC 1569 that reveal no substantial localized chemical self-enrichment (i.e., “local pollution”; see e.g. Kunth & Sargent 1986; Pagel, Terlevich & Melnick 1986; Pilyugin 1992). Vílchez & Iglesias-Páramo (1998), using bi-dimensional, long-slit spectroscopy, showed that IZw18 presents a substantially homogeneous chemical composition over the whole galaxy. From long-slit spectra of 16 HII regions in the dwarf irregular NGC 1705, Lee & Skillman (2004) reported that there is no significant spatial variation of oxygen abundances for this galaxy. Izotov et al. (2006), from two-dimensional spectroscopy of the HII galaxy SBS0335-052E, found a variation of 0.4 dex in the oxygen abundance. They concluded that these variations may not be statistically significant due to unaccounted error estimates. Lee et al. (2006) obtained a slightly significant (3.2) oxygen abundance gradient of -0.16 0.05 dex kpc-1 within the Local Group dwarf irregular galaxy NGC 6822. However they claim further deep high-quality spectra of nebulae and stars are needed to distinguish clearly between either a zero or a nonzero slope.
In this work we calculated the O/H abundance in 16 positions across IIZw70 directly from the measurement of [OIII]4363. From these values we found a maximum variation in the derived oxygen abundances of 0.4 dex, similar to the range reported by Izotov et al. (2006) for SBS0335-052E. In order to study whether this variance is statistically significant for an effective abundance variation we must include all other unaccounted uncertainties (variable seeing, flux calibration, etc), which surely contribute to the total oxygen abundance error but are difficult to estimate. In any case, our observations indicate that, within 0.2 dex, the ionized gas in the central burst of IIZw70 appears to be chemically homogeneous in O/H over spatial scales of hundreds of parsecs. In the case of the neon-to-oxygen ratio, Ne/O, the range of values as derived from our point by point abundance analysis, does not show inhomogeneity within the errors; as is also the case of the nitrogen-to-oxygen ratio, N/O (see section 3.4). All these findings give us the upper limits to any chemical inhomogeneity in the ionized gas in the brightest part of IIZw70. In accordance with these results we can say that we are probably not detecting a “local pollution” case in IIZw70, consistent with most results obtained by other works cited previously.
A favourable explanation to this apparent degree of homogeneity in dwarf galaxies is given by the scenario presented in Tenorio-Tagle (1996). According to this scenario, in those places in which one expects that newly produced metals could be returned to the ISM, the “local pollution” is not detected in the warm phase of the ISM. Rather the newly synthesized metals are returned into the hot phase of the ISM, and there is a significant time delay before these newly produced metals can be detected in the warm phase of the ISM. Variations of the oxygen abundance in the ISM of HII galaxies could give constraints to the physical mechanisms involved in the recycling processes (e.g. Recchi et al. 2001).
Analysing the predictions of chemical evolution models, we verified that continuous SF models (Mollá & Díaz 2005) predict an enhancement in O/H of up to 0.4 dex, to be produced in spatial scales of 1 kpc along their disk, over timescales of 8 Gyr. The important point here is that these models predict O/H enhancements that could be achieved keeping the N/O ratio approximately constant throughout the process, and at an absolute value consistent with our observations (see section 3.4) to within 0.1 dex. Further observations with IFUs in 10 m class telescopes and additional measurements of chemical abundances in IIZw70, covering a larger area, should be required in order to draw a firmer conclusion on the statistical contribution of local variations to the chemical homogeneity. Given the interest in the problem of chemical homogeneity of dwarfs galaxies and its role in their chemical evolution (e.g. Legrand et al. 2001, Recchi et al. 2001) a clearer view of the observational situation is probably warranted.
Acknowledgements.
C.K wishes to acknowledge Consejo Superior de Investigaciones Científicas (CSIC-Spain) for an I3P fellowship; C.K. also thanks the CAPES (Brazil) for a fellowship and the Observatorio Nacional for continuous support. This research was partially funded by projects AYA2004-08260-C03-02 “Estallidos” of the Spanish PNAYA and TIC 111 of the Junta de Andalucia (Spain). S.F.S as part of the research group FQM322 would like to thank the Spanish Plan Nacional de Astronomía program AYA2005-09413-C02-02, of the Spanish MEC and the Plan Andaluz de Investigación of Junta de Andalucía. We wish to thank the anonymous referee for his/her useful comments and suggestions. We thank M. Villar-Marti̇n and D. Reverte-Paya for their help in the initial stages of this project. During the course of this work, we benefited from conversations with M. Mollá and V. Luridiana. Thanks are due to G. Stasińska for her fruitful comments and careful reading of the manuscript. We also want to thank Steve Donegan for his careful revision of the English in this paper.References
- Baldwin et al. (1981) Baldwin, A., Phillips, M.M., & Terlevich, R. 1981, PASP, 93, 817
- Balkowski et al. (1978) Balkowski, C., Chamaraux, P., & Weliachew, L. 1978, A&A, 69, 263
- Bertola et al. (1995) Bertola, F., Cinzano, P., Corsini, E.M., Rix, H.W., & Zeilinger, W.W. 1995, ApJ, 448, L13 Binney, J., & Tremaine, S. 1987, Galactic Dynamics (Princeton: Princeton Univ. Press)
- Cairós et al. (2002) Cairós, L.M., Caon, N., García-Lorenzo, B., Vílchez, J.M., & Muñoz-Tuñón, C. 2002, ApJ, 577, 164
- Cairós et al. (2001) Cairós, L.M., Caon, N., Vílchez, J.M., González-Pérez, J.N., & Muñoz-Tuñón, C. 2001, ApJS, 136, 393
- Cairós et al. (2001) Cairós, L.M., Vílchez, J.M., González Pérez, J.N., Iglesias-Páramo, J., & Caon, N. 2001, ApJS, 133, 321
- (7) Cairós, L.M., 2001, PhD Thesis, Universidad de La Laguna
- (8) Castellanos, M., 2000, PhD Thesis, Universidad Autonoma de Madrid
- Cox et al. (2001) Cox, A.L., Sparke, L.S., Watson, A.M., & van Moorsel, G. 2001, AJ, 121, 692
- Deeg et al. (1997) Deeg, H.J., Duric, N., & Brinks, E. 1997, A&A, 323, 323
- de Mello et al. (1998) de Mello, D.F., Schaerer, D., Heldmann, J., & Leitherer, C. 1998, ApJ, 507, 199
- Dopita & Sutherland (1995) Dopita, M.A., & Sutherland, R.S. 1995, ApJ, 455, 468
- Gil de Paz et al. (2003) Gil de Paz, A., Madore, B.F., & Pevunova, O. 2003, ApJS, 147, 29
- Haro (1956) Haro, G. 1956, Boletin de los Observatorios Tonantzintla y Tacubaya, 2, 8
- Izotov et al. (2006) Izotov, Y.I., Schaerer, D., Blecha, A., Royer, F., Guseva, N.G., & North, P. 2006, A&A, 459, 71
- Izotov & Thuan (1999) Izotov, Y.I., & Thuan, T.X. 1999, ApJ, 511, 639
- Kehrig et al. (2004) Kehrig, C., Telles, E., & Cuisinier, F. 2004, AJ, 128, 1141
- Kennicutt (1998) Kennicutt, R.C., Jr. 1998, ARA&A, 36, 189
- Kewley et al. (2005) Kewley, L.J., Jansen, R. A., & Geller, M.J. 2005, PASP, 117, 227
- Kewley et al. (2002) Kewley, L.J., Geller, M. J., Jansen, R.A., & Dopita, M.A. 2002, AJ, 124, 3135
- Kobulnicky & Skillman (1996) Kobulnicky, H.A., & Skillman, E.D. 1996, ApJ, 471, 211
- Kong et al. (2003) Kong, X., Charlot, S., Weiss, A., & Cheng, F.Z. 2003, A&A, 403, 877
- Kunth Östlin (2000) Kunth, D., & Östlin, G. 2000, A&A Rev., 10, 1
- Kunth & Sargent (1986) Kunth, D., & Sargent, W.L.W. 1986, ApJ, 300, 496
- Kunth & Sargent (1983) Kunth, D., & Sargent, W.L.W. 1983, ApJ, 273, 81
- Lee et al. (2006) Lee, H., Skillman, E.D., & Venn, K.A. 2006, ApJ, 642, 813
- Lee & Skillman (2004) Lee, H., & Skillman, E.D. 2004, ApJ, 614, 698
- Leitherer et al. (1999) Leitherer, C., et al. 1999, ApJS, 123, 3
- Legrand et al. (2001) Legrand, F., Tenorio-Tagle, G., Silich, S., Kunth, D., & Cerviño, M. 2001, ApJ, 560, 630
- Lequeux et al. (1979) Lequeux, J., Peimbert, M., Rayo, J.F., Serrano, A., & Torres-Peimbert, S. 1979, A&A, 80, 155
- (31) Lodders, K. 2003, ApJ, 591, 1220L
- López-Sánchez et al. (2006) López-Sánchez, Á.R., Esteban, C., & García-Rojas, J. 2006, A&A, 449, 997
- Maeder & Conti (1994) Maeder, A., & Conti, P.S. 1994, ARA&A, 32, 227 Martin, C.L. & Kennicutt, R.C., Jr. 1995, ApJ, 447, 171
- McCall et al. (1985) McCall, M.L., Rybski, P.M., & Shields, G.A. 1985, ApJS, 57, 1
- Melnick (1992) Melnick, J. 1992, Star Formation in Stellar Systems, 253
- Meynet (1995) Meynet, G. 1995, A&A, 298, 767
- Mollá & Díaz (2005) Mollá, M., & Díaz, A.I. 2005, MNRAS, 358, 521
- Munoz-Tunon et al. (1996) Muñoz-Tuñon, C., Tenorio-Tagle, G., Castañeda, H.O., & Terlevich, R. 1996, AJ, 112, 1636
- Nava et al. (2006) Nava, A., Casebeer, D., Henry, R.B.C., & Jevremovic, D. 2006, ApJ, 645, 1076
- Osterbrock & Ferland (2006) Osterbrock, D.E., & Ferland, G.J. 2006, Astrophysics of gaseous nebulae and active galactic nuclei, 2nd. ed. Sausalito, CA: University Science Books, 2006.
- Pagel et al. (1986) Pagel, B.E.J., Terlevich, R.J., & Melnick, J. 1986, PASP, 98, 1005
- Papaderos et al. (2002) Papaderos, P., Izotov, Y.I., Thuan, T.X., Noeske, K.G., Fricke, K.J., Guseva, N.G., & Green, R.F. 2002, A&A, 393, 461
- Pilyugin et al. (2006) Pilyugin, L.S.,Vílchez, J.M., & Thuan, T.X. 2006, MNRAS, 370, 1928
- (44) Pilyugin, L.S. & Thuan, T.X., 2005, ApJ, 631, 231
- Pilyugin (1992) Pilyugin, I.S. 1992, A&A, 260, 58
- Recchi et al. (2001) Recchi, S., Matteucci, F., & D’Ercole, A. 2001, MNRAS, 322, 800
- Reshetnikov & Combes (1994) Reshetnikov, V.P., & Combes, F. 1994, A&A, 291, 57
- Roth et al. (2005) Roth, M.M., et al. 2005, PASP, 117, 620
- Roy et al. (1991) Roy, J.R., Boulesteix, J., Joncas, G., & Grundseth, B. 1991, ApJ, 367, 141
- (50) Sánchez S.F., García-Lorenzo, B., Pecontal-Rousset, A., 2007, Proceedings of the XIII IAC Winter School, Arribas, S., Mediavilla, E., & Roth, M., Ed., in press.
- Sánchez (2006) Sánchez, S.F. 2006, Astronomische Nachrichten, 327, 850
- (52) Sánchez, S.F. 2004, Astronomische Nachrichten, 325, 167
- Sargent (1970) Sargent, W.L.W. 1970, ApJ, 160, 405
- Sargent & Searle (1970) Sargent, W.L.W., & Searle, L. 1970, ApJ, 162, L155
- Shi et al. (2005) Shi, F., Kong, X., Li, C., & Cheng, F.Z. 2005, A&A, 437, 849
- Stasińska & Izotov (2003) Stasińska, G., & Izotov, Y. 2003, A&A, 397, 71
- Storey & Hummer (1995) Storey, P.J., & Hummer, D. G. 1995, MNRAS, 272, 41
- Shaw & Dufour (1994) Shaw, R.A., & Dufour, R.J. 1994, ASP Conf. Ser. 61: Astronomical Data Analysis Software and Systems III, 61, 327
- Telles et al. (2001) Telles, E., Muñoz-Tuñón, C., & Tenorio-Tagle, G. 2001, ApJ, 548, 671
- Tenorio-Tagle (1996) Tenorio-Tagle, G. 1996, AJ, 111, 1641
- (61) Thuan, T. X., & Martin, G. E., 1981, ApJ, 247, 823
- (62) Vílchez, J.M., & Iglesias-Páramo, J. 1998, ApJ, 508, 248
- Whitford (1958) Whitford, A.E. 1958, AJ, 63, 201
- Whitmore et al. (1990) Whitmore, B.C., Lucas, R. A., McElroy, D.B., Steiman-Cameron, T.Y., Sackett, P.D., & Olling, R.P. 1990, AJ, 100, 1489
- Zwicky & Zwicky (1971) Zwicky, F., & Zwicky, M.A. 1971, Guemligen: Zwicky, —c1971,
- Zwicky (1964) Zwicky, I.F. 1964, ApJ, 140, 1467