The ATESP 5 GHz radio survey.
II. Physical properties of the faint radio population ††thanks: Based on
observations carried out at the European Southern Observatory, La
Silla, Chile under program Nos. 75.A-0280 and 77.A-0211
Context: One of the most debated issues about sub-mJy radio sources, which are responsible for the steepening of the 1.4 GHz source counts, is the origin of their radio emission. Particularly interesting, from this point of view, is the possibility of combining radio spectral index information with other observational properties to assess whether the sources are triggered by star formation or nuclear activity.
Aims: The aim of this work is to study the optical and near infrared properties of a complete sample of 131 radio sources with mJy, observed at both 1.4 and 5 GHz as part of the ATESP radio survey. The availability of multi–wavelength radio and optical information is exploited to infer the physical properties of the faint radio population.
Methods: We use deep multi–colour (UBVRIJK) images, mostly taken in the framework of the ESO Deep Public Survey, to optically identify and derive photometric redshifts for the ATESP radio sources. Deep optical coverage and extensive colour information are available for 3/4 of the region covered by the radio sample. Typical depths of the images are , , , , , , . We also add shallower optical imaging and spectroscopy obtained previously in order to perform a global analysis of the radio sample.
Results: Optical/near infrared counterparts are found for (66/85) of the radio sources in the region covered by the deep multi–colour imaging, and for 56 of these reliable estimates of the redshift and type are derived. We find that many of the sources with flat radio spectra are characterised by high radio–to–optical ratios (), typical of classical powerful radio galaxies and quasars. Flat–spectrum sources with low values are preferentially identified with early type galaxies, where the radio emission is most probably triggered by low–luminosity active galactic nuclei. Considering both early type galaxies and quasars as sources with an active nucleus, such sources largely dominate our sample (78%). Flat–spectrum sources associated with early type galaxies are quite compact ( kpc), suggesting core-dominated radio emission.
Key Words.:
Surveys – Radio continuum: general - Methods: data analysis - Catalogues - Galaxies: general - Galaxies: evolution1 Introduction
The faint (sub-mJy) radio population consists of a mixture of different classes of objects. Since the early seventies it has been known that the strongest sources are almost exclusively associated with either active galactic nuclei (AGNs) or giant ellipticals, the latter of which are also known as radio galaxies (99% above 60 mJy, Windhorst et al. 1990). More recent work on mJy and sub-mJy sources has revealed that faint sources are also found to be associated with normal elliptical, spiral and star-forming galaxies, with the early type galaxies being the dominant component (Gruppioni et al. 1999; Georgakakis et al. 1999; Magliocchetti et al. 2000; Prandoni et al. 2001; Afonso et al. 2006), while at Jy levels star-forming galaxies prevail (see e.g. Richards et al. 1999).
In spite of the progress made in our understanding of the faint radio population, many questions remain open. For example, the relative fractions of the different types of objects are still quite uncertain, and our knowledge of their dependence on limiting flux density is still incomplete. The reason is, of course, that very little is known about the faint ends of the various luminosity functions, and even less is known about the cosmological evolution of different kinds of objects. This uncertainty is due to the incompleteness of optical identification and spectroscopy, since faint radio sources usually have very faint optical counterparts. Clearly very deep () optical imaging and spectroscopy, for reasonably large deep radio samples, are critical if one wants to investigate these radio source populations.
Since the radio emission comes from different types of objects an important question is what are the physical processes that trigger this emission. It is natural to assume that in the case of star-forming galaxies the emission traces the history of galaxy formation and subsequent evolution by merging and interaction, while the emission in AGNs will reflect black hole accretion history. To make matters more complicated, both processes may be present at the same time.
Although research in this field proceeds slowly due to very time–consuming spectroscopy much progress has been made in recent years thanks to strong improvement in the photometric redshift technique. Several multi–colour/multi–object spectroscopy surveys overlapping deep radio fields have recently been undertaken, including the Phoenix Deep Survey (Hopkins et al. 1998; Georgakakis et al. 1999; Afonso et al. 2006) and the Australia Telescope ESO Slice Project (ATESP) survey (Prandoni et al. 2000a, b, 2001). In other cases, deep multi–colour/multi–wavelength surveys have been complemented by deep radio observations (see e.g. the VLA–VIRMOS, Bondi et al. 2003; and the COSMOS, Schinnerer et al. 2006).
Multi–frequency radio observations are also important in measuring the radio spectral index, which may help to constrain the origin of the radio emission in the faint radio sources. This approach is especially meaningful when high resolution radio images are available and radio source structures can be inferred. However, multi–frequency radio information is available for very few, and small, sub-mJy radio samples.
The largest sample with multi–frequency radio coverage available so far is a complete sample of 131 radio sources with mJy, extracted from a square degree region observed at both 1.4 and 5 GHz as part of the ATESP radio survey (Prandoni et al. 2000a, b, 2006).
The GHz radio spectral index analysis of the ATESP radio sources was presented in the first paper of this series (Prandoni et al. 2006, hereafter Paper I). We found a flattening of the radio spectra with decreasing radio flux density. At mJy levels most sources have steep spectra (, assuming ), typical of synchrotron radiation, while at sub-mJy flux densities a composite population is present, with up to of the sources showing flat () spectra and a significant fraction () of inverted-spectrum () sources. This flattening at sub-mJy fluxes confirms previous results based on smaller samples (Donnelly et al. 1987; Gruppioni et al. 1997; Ciliegi et al. 2003). Flat spectra in radio sources usually indicate the presence of a self-absorbed nuclear core, but they can also be produced on larger scales by thermal emission from stars.
It is possible to combine the spectral index information with other observational properties and infer the nature of the faint radio population. This is especially important with respect to the class of flat/inverted–spectrum sources as it permits us to study the physical processes that trigger the radio emission in those sources. This kind of analysis needs information about the redshifts and types of the galaxies hosting the radio sources. A detailed radio/optical study of the sample above is possible, thanks to the extensive optical/infrared coverage mostly obtained in the ESO Deep Public Survey (DPS, Mignano et al. 2007; Olsen et al. 2006).
We give a brief discussion of all the data collected so far in Sect. 2, followed by a more detailed analysis of the DPS optical data in Sect. 3, where we derive the UBVRI colour catalogue and photometric redshifts for the DPS galaxies in the region covered by the ATESP survey, assessing the reliability of the photometric redshifts themselves. In Sects. 4 and 5, respectively, we use the DPS UBVRIJK optical data to identify the ATESP radio sources and to derive photometric redshifts.
A radio/optical analysis of
the optically identified radio sources is presented in
Sect. 6, while in Sect. 7 we discuss the nature
of the mJy and sub–mJy population on the basis of all the
radio and optical data available to the ATESP sample. The main results are
briefly summarised in Sect. 8.
Throughout this paper we use the CDM model, with , and .
2 Radio and optical data
2.1 The ATESP 1.4 and 5 GHz surveys
As discussed in Paper I, the Australia Telescope Compact Array (ATCA) was used to image, at 5 GHz, part of the strip of sky previously covered by the 1.4 GHz sub-mJy ATESP survey (Prandoni et al. 2000a, b). In the sq. deg. area observed at both 1.4 and 5 GHz a total of 131 distinct radio sources are catalogued above a 6-threshold ( mJy) at either 1.4 or 5 GHz (see Table 4 of Paper I). In particular we have 89 sources that appear in both the 1.4 and 5 GHz catalogues (Prandoni et al. 2000b and Paper I), while the remaining 42 sources are catalogued only at one radio frequency: 20 sources at 1.4 GHz and 22 sources at 5 GHz. For the sake of the spectral index analysis (see Paper I), we searched for ( mJy) counterparts for these sources at the other radio frequency by directly inspecting the (1.4 or 5 GHz) ATESP radio mosaics. As a result (1.4 or 5 GHz) flux measurements were provided for 29 additional sources (12 catalogued at 1.4 GHz and 17 at 5 GHz), while for 13 (8 catalogued at 1.4 GHz and 5 at 5 GHz) sources (1.4 or 5GHz) upper limits were estimated. Among the 131 sources catalogued at 1.4 and/or 5 GHz there are three multiple sources: one is catalogued as triple at 1.4 GHz and as double at 5 GHz and another source is catalogued as double at 1.4 GHz and as a single non–Gaussian (extended) source at 5 GHz.
2.2 The optical/infrared DPS survey
The sq. deg. area imaged at both 1.4 and 5 GHz as part of the ATESP survey overlaps entirely with one sub-region (namely the DEEP1 sub-region, see below) of the ESO DPS survey. The DPS is a multi–colour survey consisting of both optical and near–infrared observations. The DPS was carried out in the optical (), using the WFI (Wide Field Imager) camera mounted at the 2.2m ESO telescope, and in the NIR (), using the SOFI camera mounted at the ESO NTT telescope. For a detailed description of the UBVRIJK filters used for the DPS we refer to Mignano et al. (2007) and Olsen et al. (2006).
The optical (UBVRI) observations cover three distinct sq. deg. regions of sky (named DEEP1, DEEP2, DEEP3). Each of the three regions is covered by four WFI pointings (a, b, c, d). Typical depths of the optical observations are , , , , (Mignano et al. 2007).
The infrared DPS comprises two strategies: shallow –band () contiguous coverage of about half the WFI fields, complemented by deeper – and –band ( and ) contiguous coverage ( SOFI pointings) of the central part of the WFI fields observed in the shallow strategy (Olsen et al. 2006). In particular for region DEEP1, the one of interest for this work, infrared coverage was proposed for WFI fields DEEP1a and DEEP1b in shallow strategy ( SOFI pointings), and for the central part of them in deep strategy ( SOFI pointings).
There are some gaps in the optical/NIR imaging of the three fields of the region DEEP1 (see Table 1 for the summary of the observations). Since NIR coverage of each single WFI field is obtained with several contiguous SOFI images, the seeing and the limiting magnitude values reported in the table for and bands are an average ( standard deviation) of all the SOFI images contributing to the WFI field.
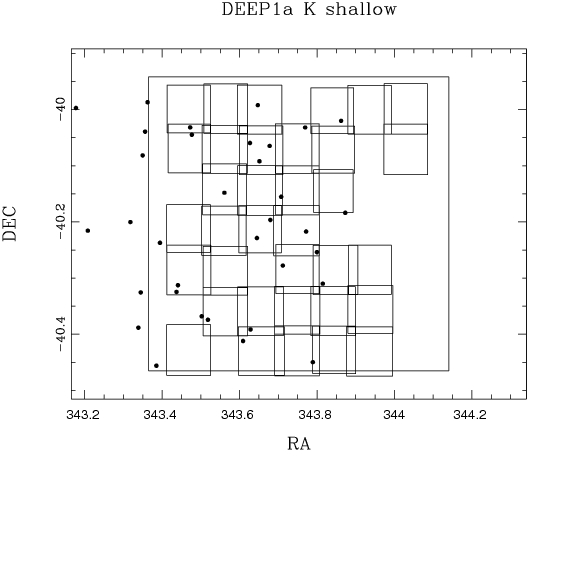
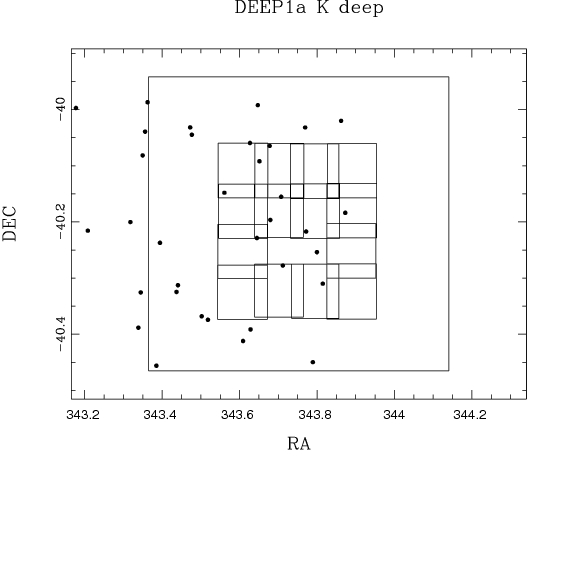
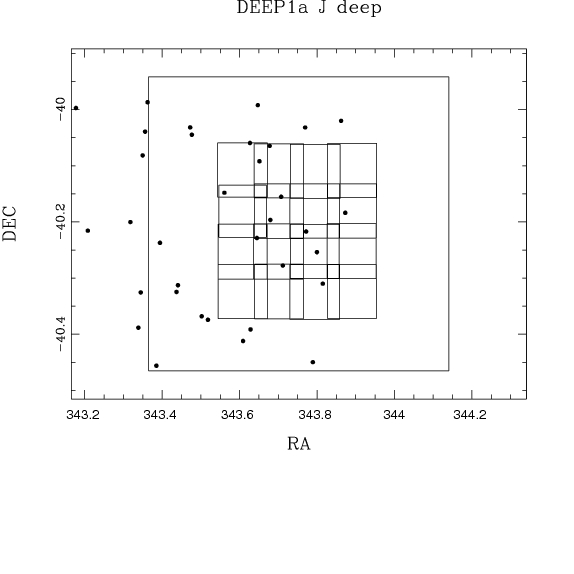
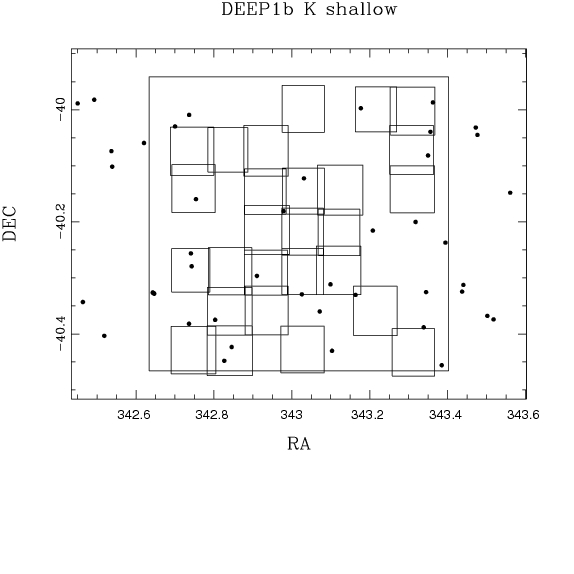
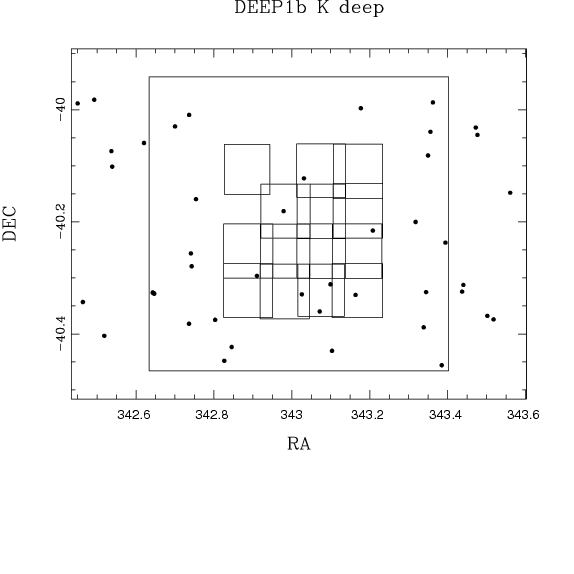
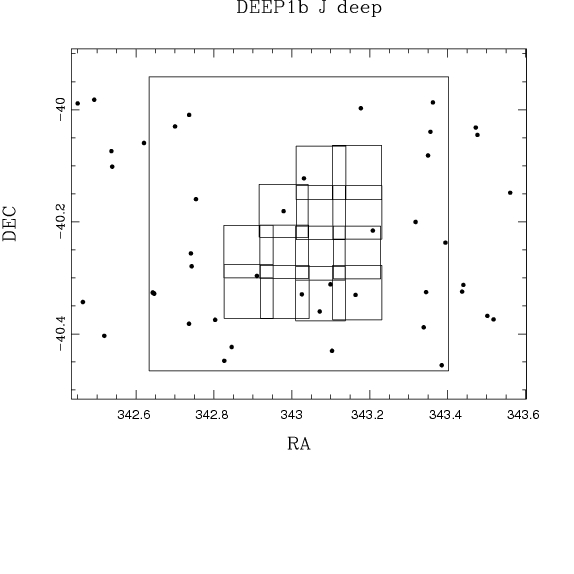
Figure 1 shows the distribution of the infrared SOFI pointings over the WFI fields DEEP1a (top) and DEEP1b (bottom) for the two available infrared bands (J and K). band coverage is shown in both strategies: shallow and deep imaging (left and middle panels). band coverage (right panels) was obtained only for the deep strategy. The infrared frames are represented by the small numbered squares that overlap the corresponding optical WFI frames (big squares).
From Table 1 and Fig. 1 it is clear that DEEP1a imaging is complete in the optical U, B, and R pass-bands, while no imaging is available in the V-band. The –band imaging, on the other hand, is 70% complete in the shallow strategy and 75% complete in the deep strategy, while 100% completeness is reached by the –band imaging.
The optical imaging of DEEP1b is complete, except for the –band imaging, which is slightly shallower than planned (). The deep infrared imaging has a good coverage in both filters (80%), while the shallow –band imaging covers only about 55% of the area.
It is interesting to note that, even if not complete, the infrared coverage of DEEP1a and b is distributed in such a way that many of the ATESP radio sources (filled black points in Fig. 1) in the two fields (27 and 26 radio sources for DEEP1a and b respectively) have infrared information. In particular, 75% () of the sources have shallow –band coverage, while deep – and –band infrared data are available for 100% () of the radio sources located in the central part of the fields.
DEEP1c was only observed in the V band (only down to ) and R band, while no observations are available for field DEEP1d.
Reduced images and single pass-band source catalogues extracted from both the optical and infrared DPS are described in detail in Mignano et al. (2007) and Olsen et al. (2006), respectively, and are publicly available at the Centre de Données astronomiques de Strasbourg (CDS).
| Field | Pass-band | Seeing () | mlim |
|---|---|---|---|
| DEEP1a | 1.37 | 25.26 | |
| 1.37 | 25.85 | ||
| 0.87 | 25.74 | ||
| 0.86 | 23.76 | ||
| DEEP1b | 1.17 | 24.62 | |
| 1.43 | 25.66 | ||
| 1.31 | 25.35 | ||
| 1.29 | 25.32 | ||
| 0.97 | 24.19 | ||
| DEEP1c | 1.19 | 25.03 | |
| 0.98 | 25.43 |
| Field | Pass-band | Seeing () | mlim |
|---|---|---|---|
| DEEP1a | 0.98 | 25.76 | |
| DEEP1c | 1.09 | 25.07 | |
| 1.27 | 26.56 | ||
| 1.21 | 24.83 |
2.3 Additional optical imaging
Since the DPS was not completed, we have undertaken new WFI optical observations in order to collect the missing data necessary to have full colour information for region DEEP1, and hence for our ATESP radio sources. In this framework we have obtained V–band imaging for DEEP1a, and U-, B-, I-band imaging for DEEP1c. All these new observations were taken in collaboration with the group that developed the Garching-Bonn Deep Survey (GaBoDS) data reduction pipeline (Schirmer et al. 2003; Erben et al. 2005) and therefore these new data were reduced through that pipeline. The main attributes for this additional imaging are shown in Table 2. We refer to Hildebrandt et al. (2006) for a detailed description of the data (both reduced images and single pass-band source catalogues). Our multi–colour analysis of ATESP radio sources can rely on full UBVRI information for DEEP1a, b and c (plus infrared information for most of the sources in DEEP1a and b).
2.4 Other optical information
It is worth mentioning that other optical imaging and/or spectroscopic data are available. The 26 square degree area covered by the ATESP survey was chosen to overlap with the region where Vettolani et al. (1997) made the ESP (ESO Slice Project) redshift survey. They performed a photometric and spectroscopic study of all galaxies down to 19.4. The ESP survey yielded 3342 redshifts (Vettolani et al. 1998), to a typical depth of and a completeness level of 90%.
In the same region lies the ESO Imaging Survey (EIS) Patch A ( square degrees, centred at , ), mainly consisting of images in the I-band, out of which a galaxy catalogue ( complete to ) was extracted (Nonino et al. 1999). This catalogue allowed us to identify of the 386 ATESP sources present in that region and optical spectroscopy was obtained for a complete magnitude-limited () sub-sample of 70 sources (see Prandoni et al. 2001). Some VLT/NTT spectroscopy is also available for fainter sources in the same region ( sources with , Prandoni et al., in prep.). However, the 3 square degree ATESP-EIS sample only overlaps partially with the DEEP1 region, covering the fields DEEP1c and DEEP1d.
This paper mainly focuses on the radio/optical analysis of the 85 ATESP radio sources located in DEEP1a, b and c, for which deep multi–colour optical/NIR information can be exploited. However, whenever considered useful, we include in our discussion any optical data (imaging and/or spectroscopy) available to the ATESP sources located in DEEP1d. Such data may come either from the observations mentioned above, or from the literature.
3 Multi–colour analysis of DEEP1 DPS data
A general discussion of the DPS optical imaging is provided in Mignano et al. (2007) and in Hildebrandt et al. (2006), where the global quality of the photometry obtained through the EIS and the GaBoDS pipelines, respectively, is discussed. Here, we focus our attention on region DEEP1, which is the region of interest of this work. A careful analysis of the photometry of the single pass-band images covering region DEEP1 is very important since we will use this data later to estimate photometric redshifts for the ATESP radio sources. Also very important is the recipe followed to produce the optical colour catalogues, since reliable galaxy colours are crucial to get reliable photometric redshifts.
3.1 Colour catalogues
We used the available UBVRI images to derive overall optical colour catalogues for DEEP1a, b and c.
To obtain a good quality colour catalogue it is clear that one should use UBVRI images reduced in a consistent way. The optical images available to this work were reduced with different pipelines: the EIS pipeline for the images obtained in the framework of the DPS survey and the GaBoDS pipeline for the images obtained later on (UBI images for DEEP1c and V images for DEEP1a). In order to avoid internal inconsistency, we therefore decided to refer to the EIS reduction for DEEP1b (see Mignano et al. 2007) and to the GaBoDS reduction for both DEEP1a and DEEP1c (see Hildebrandt et al. 2006).
The technique of reference imaging (see below) was adopted in this work to produce the colour catalogue, since it provides the most accurate colour estimates, through the measuring of the source flux within the same area in any of the different pass-band images. This is especially important for extended objects.
We selected as the reference image the best seeing single pass-band image. Such a choice allows us to minimise the effect of very close pairs of objects, which are not resolved due to poor seeing. The –band and R–band images for field DEEP1a have very similar seeing values and the colour catalogue of DEEP1a was extracted by using the –band image as the reference. For DEEP1b and DEEP1c best seeing is measured for I– and R–band images, respectively, and the choice of the reference image was done accordingly.
We run SExtractor (ver. 2.3, Bertin & Arnouts 1996) in the so–called double image mode: detection and object apertures were based on the reference image, followed by isophotal magnitudes measured in the same aperture for each detected object on the other pass-band images separately.
The optical colour catalogues were then cross–correlated with single pass-band catalogues extracted from the and images, whenever available. Since the infrared catalogues overlap, it may happen that the same optical object is identified in more than one infrared catalogue. In such cases, the infrared object with the lowest magnitude error was selected.
We did not include the NIR information in the colour catalogue production from the beginning since a) it is available only for limited sub-regions of DEEP1a and DEEP1b fields and b) the data are taken with a different instrument and telescope (SOFI at the 3.6 m) and reduced through a specific EIS pipeline.
3.2 Photometric redshifts
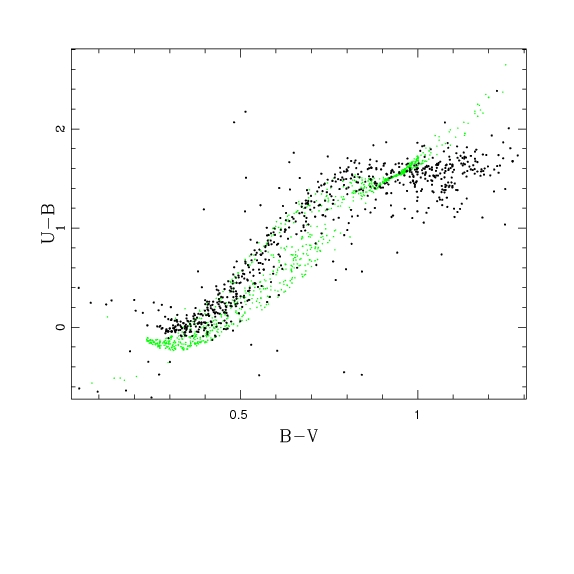
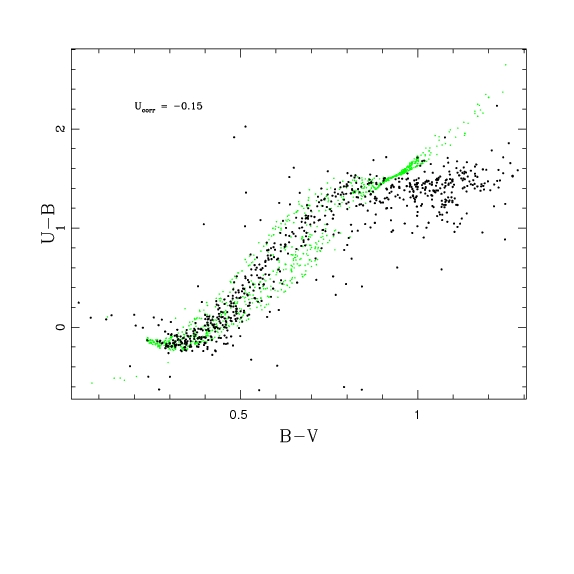
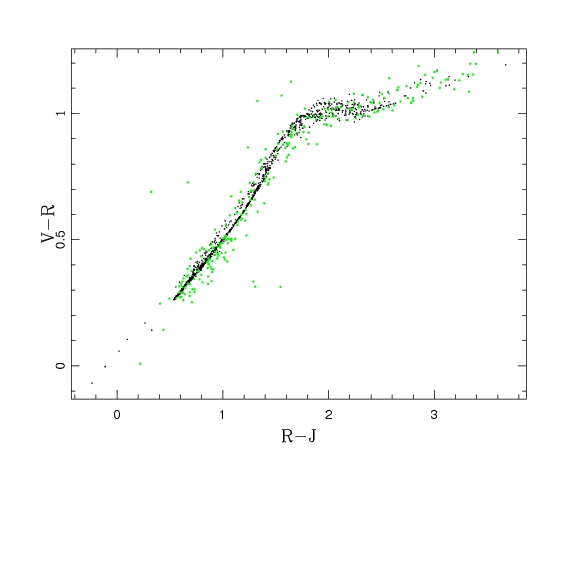
The success of photometric redshift estimate routines strongly depends on the accuracy of the photometric calibration in the various pass-bands and on the accuracy of the colour estimation. In Mignano et al. (2007) and Hildebrandt et al. (2006), comparisons between the UBVRI colours of stars in the various regions covered by the DPS, and the ones expected from a theoretical model (Girardi et al. 2005), were presented to check for the presence of possible systematic offsets. Here, we report on the results obtained specifically for the DEEP1 region, which is the one of interest to our radio/optical study. From the colour-colour diagram analysis very good agreement was found between the catalogued star colours and the theoretical expectations, except in the case of the U-band for field DEEP1b, where an offset of mag is present (see Fig. 2, top panel). After correcting for this offset, a good overlap between observed and expected colours is obtained (see Fig. 2, bottom panel).
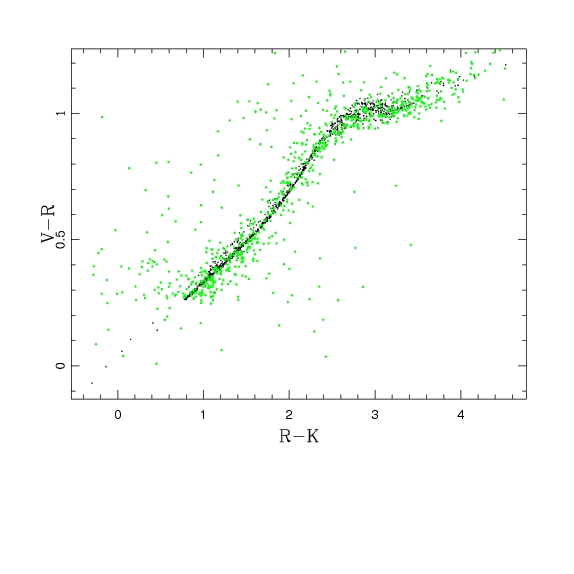
We have also checked the optical (WFI)–infrared (SOFI) colours of the DPS stars, and no appreciable offset was seen. This is shown in Fig. 3, where vs. and are plotted for DEEP1b, chosen as reference.
We also used any spectroscopic data available from the literature in this region to analyse the impact of both the correction applied in the U-band for DEEP1b and the use of NIR colours (when available) in the determination of galaxy photometric redshifts.
It is important to note that most spectra come from the ESP redshift survey (see Sect. 2.4), which covers a limited redshift range (, Vettolani et al. 1998) and therefore the present comparison mainly probes the most local galaxies of the DPS.
Photometric redshifts for 88 galaxies with spectroscopy information present in fields DEEP1a, b and c were estimated using the public photometric redshift code Hyperz (Bolzonella et al. 2000), by using both the templates created from the synthetic stellar libraries of Bruzual & Charlot (1993), hereafter BC, and the empirical ones compiled by Coleman et al. (1980) to represent the local galaxy population (hereafter CWW). We stress that such galaxies are not necessarily associated to ATESP sources.
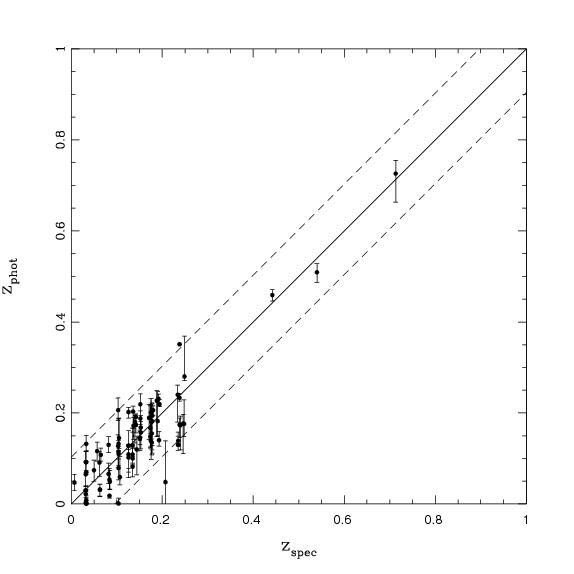
From this analysis we found a clear improvement in the photometric redshift determination when correcting for the systematic offset in U-band photometry. A further improvement is obtained when adding the NIR ( and ) information (when available) to the colour catalogue. The vs. linear fit slope gets closer to unity () and the object distribution around the line gets narrower. The final diagram is shown in Fig. 4. Dotted lines indicate the range that contains 95% of the objects (z z 0.1). Such a range, albeit rather large, is adequate for this kind of study, where errors in luminosity determinations of of the order of are acceptable. The horizontal error bars are not shown since they are negligible: ESP redshifts are characterised by errors of the order of km/s on the measured recession velocity, i.e. (Vettolani et al. 1998).
As a final remark, we stress that photometric redshifts shown in Fig. 4 were obtained using different template sets for different redshift ranges: galaxies with spectroscopic redshift were fitted by CWW templates, while objects at z by BC templates. This choice, as expected, turned out to provide the best redshift estimates over the two redshift ranges.
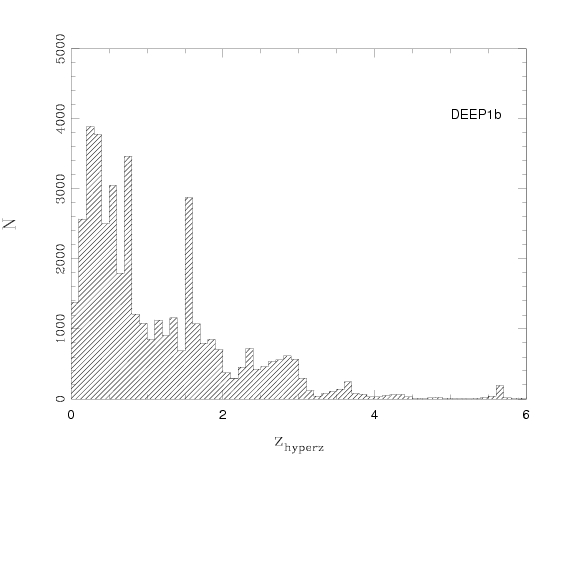
Figure 5 shows the galaxy photometric redshift distribution obtained from the optical UBVRI colour catalogues in field DEEP1b, chosen as reference. Most of the galaxies lie at , as expected, with a significant number of objects extending up to . On the other hand, the excess at is mainly due to objects classified by Hyperz as Sc galaxies and is clearly spurious. For such objects the photometric redshift determination clearly fails. Noteworthy are the two narrow peaks at and . The latter is also present in fields DEEP1a and DEEP1c, and most probably indicates a degeneracy in the Hyperz routine, due to the fact that the spectral range covered by UBVRI-bands at does not probe the Balmer Å break. More interesting is the peak at , mainly composed of early type galaxies, which is not replicated in DEEP1a and c, possibly indicating the presence of real large scale structure.
4 Optical identification of the ATESP radio sources
In the following we present the cross-correlation between the ATESP radio sources in fields DEEP1a, b and c and the multi–colour optical/NIR catalogues described in Sect. 3.1.
In the literature different statistical techniques are used to cross–correlate radio and optical catalogues, from the simplest, distance-only based criterion, which considers as good any identification within a certain fixed radio–optical distance, to more sophisticated techniques, like the likelihood ratio criteria, based on the probability that a given source, at a certain distance and with a certain magnitude, is the true optical counterpart of the radio source (e.g. de Ruiter et al. 1977; Ciliegi et al. 2003; Sullivan et al. 2004; Simpson et al. 2006).
In Mignano et al. (2007) a preliminary optical identification of the ATESP sources with the DPS catalogues was proposed, based on distance alone. However, while this choice proves to be appropriate for shallower optical databases (see e.g. the ATESP-EIS case, Prandoni et al. 2001), it is not very reliable when dealing, like in this case, with very deep (and therefore crowded) optical catalogues. Hence, we adopt the likelihood ratio technique in the form described by Sutherland & Saunders (1992) and Ciliegi et al. (2003).
The likelihood ratio LR is defined as the ratio between the probability that the source is the correct identification and the corresponding probability that the source is a background, unrelated object. A threshold value of the likelihood ratio is assumed, above which a counterpart is considered as a good identification and below which is dismissed as spurious.
The sample of accepted identifications thus consists of all the radio–optical associations that have . was chosen to be the value of that maximises the function , where is the completeness and the overall reliability of the sample (de Ruiter et al. 1977).
4.1 Optical identifications
The ATESP radio sources were identified in the same reference pass-band (R or I) as chosen to derive the colour catalogues of DEEP1a, DEEP1b and DEEP1c.
Before proceeding with the optical identification, the presence of possible systematic offsets between the radio and the optical astrometry was verified. We note that radio positions always refer to 5 GHz catalogue positions, unless the source is catalogued only at 1.4 GHz (i.e. GHz), see Paper I), while optical positions refer to the reference pass-band catalogue.
As shown in Mignano et al. (2007), where a preliminary analysis was given, the median radio-optical offsets for our sample are RA213 and Dec073. The source radio positions were corrected for such median offsets before proceeding with the radio source optical identification.
In computing the value for each optical counterpart, the radio and optical positional uncertainties have to be taken into account. Here, we adopted positional errors appropriate for the ATESP (see Prandoni et al. 2000b) and for the DPS (see Mignano et al. 2007) catalogues. In addition, we need to assume an expected a priori identification rate (). We adopted , i.e. 70% of the radio sources are assumed to be truly identified down to the limiting magnitude of the optical catalogues. This choice is based on previous radio-optical identification studies undertaken down to similar optical depths (see e.g. Ciliegi et al. 2005; Sullivan et al. 2004).
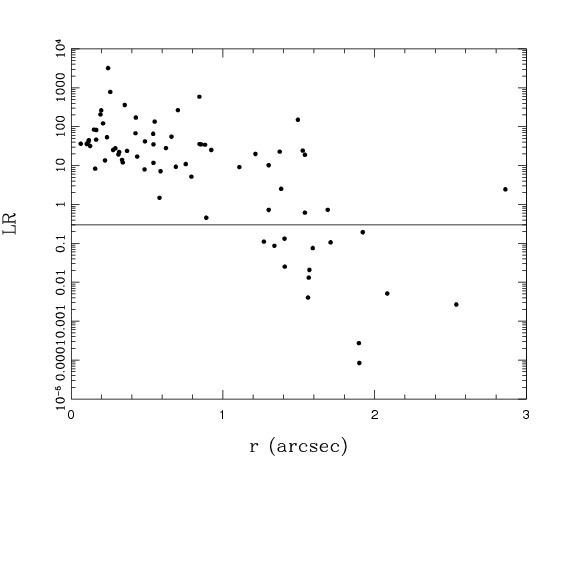
Figure 6 shows the distribution of values as a function of radio–optical offsets for the 85 radio sources in DEEP1a, b, and c. As expected, decreases going to large radio–optical offsets (), and the identifications become less reliable. The horizontal solid line represents the assumed threshold value, above which optical counterparts are considered as good identifications. The adopted threshold value, , was chosen in agreement with similar works reported in literature (e.g. Ciliegi et al. 2005). It is worth noting, however, that most of the sources have values 10 (see Fig. 6), which means that most of the optical identifications have very high probability of being real. As reported in Table 3, 60 radio sources in DEEP1a, b and c were identified down to , (see Col. 3).
In order to check the robustness of this identification technique and its dependence on the assumed parameters, the likelihood ratio analysis was repeated using different values of in the range 0.5–1.0. No substantial difference in the final number of identifications and in the associated reliability was found.
The contamination due to possible spurious identifications with was estimated by shifting the coordinates of the radio sources by several random offsets and then repeating the identification procedure. The average contamination rate () was 7.4%, 6.8% and 6.3% for DEEP1a, DEEP1b and DEEP1c, respectively (see Table 3, Col. 5).
| Field | NRS | N | C | N | N | ||
|---|---|---|---|---|---|---|---|
| DEEP1a | 27 | 16 | 98.6 | 7.4 | 4 | 20 | 74.1 |
| DEEP1b | 26 | 21 | 99.1 | 6.8 | 1 | 22 | 84.6 |
| DEEP1c | 32 | 23 | 99.0 | 6.3 | 1 | 24 | 75.0 |
| 85 | 60 | 98.9 | 6.8 | 6 | 66 | 77.6 |
4.2 Additional identifications
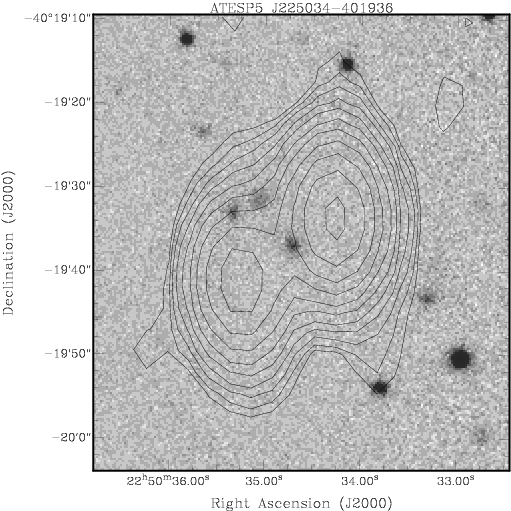
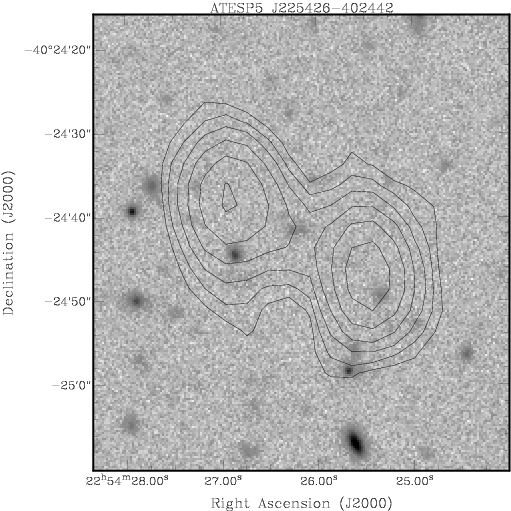
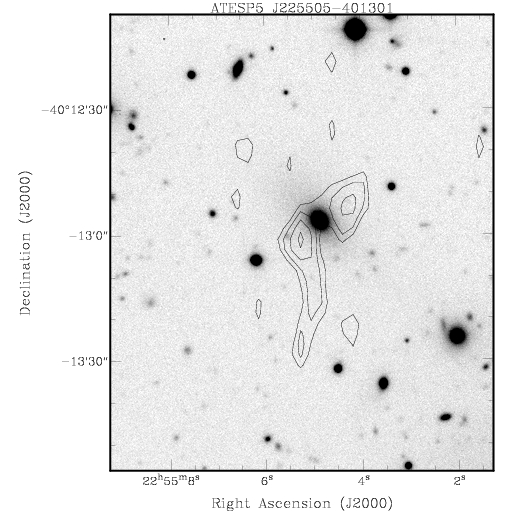
The optical counterparts of the ATESP radio sources were all visually inspected on the corresponding optical reference-band images, giving particular attention to the multiple and non–Gaussian radio sources, where radio positions might not precisely coincide with the host galaxy core. From this inspection we decided to include among the identified radio sources three extended radio sources with values lower than the threshold: in all cases, the optical counterpart located close to the radio barycenter is very likely to be the host galaxy of the radio source. Two (ATESP5 J225034–401936 and ATESP5 J225426–402442) are classical double radio sources (see Fig. 7, left and middle panels) and one (ATESP5 J225505-401301) has the morphology of a low surface brightness wide angle tail (WAT) source, i.e. an extended radio source located in a cluster (see Fig. 7, right panel). This hypothesis is supported by the fact that ATESP5 J225505-401301 is located in a crowded optical field with several optical galaxies in the field having similar photometric redshifts (see Sect. 3 for the derivation of photometric redshifts for the optical sample).
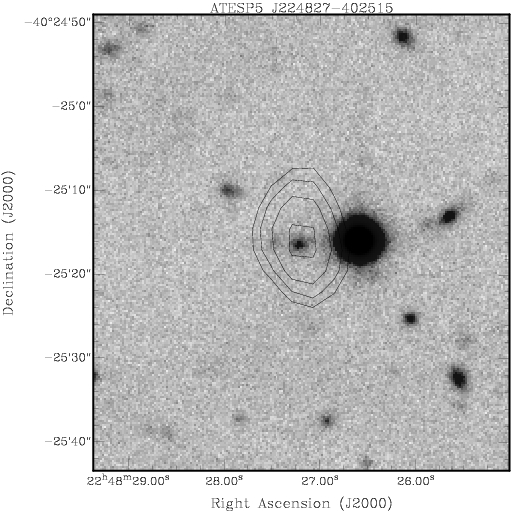
In addition, we checked for any possible additional identification in pass-bands other than the reference one ( or ). We found that only one extra identification (source ATESP5 J224827-402515 in DEEP1c field) could be recovered when the reference optical catalogue was extracted from the band image (see Fig. 8, left panel). This identification was originally missed due to the fact that a larger region around the bright star close to the object was masked in the band image. This means that in general the reference images were chosen appropriately for our scientific application.
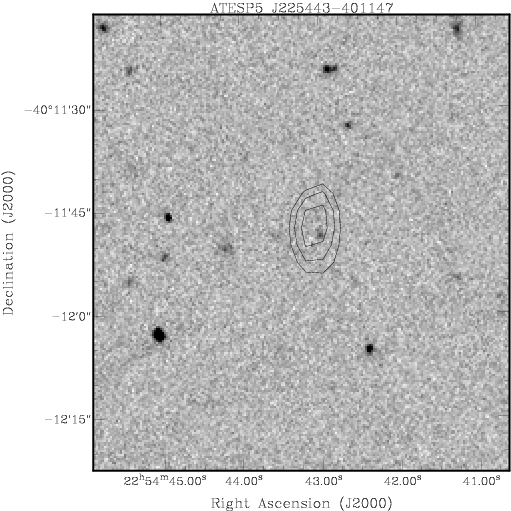
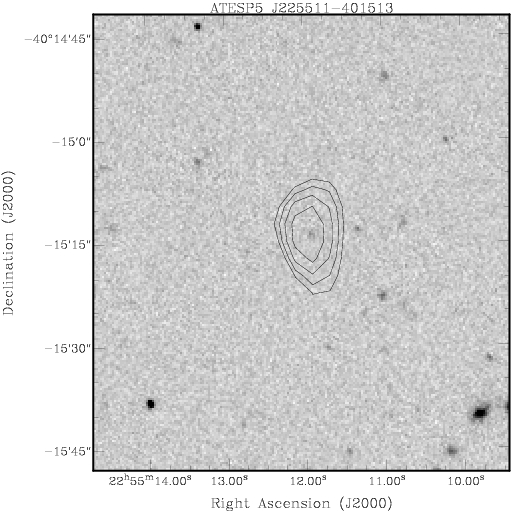
A similar check was performed for the and band infrared images, available for DEEP1a and b. For two sources (ATESP5 J225511-401513 and ATESP5 J225443-401147), with no optical counterpart in the DEEP1a optical images, a possible counterpart was found within a distance of 2 in the infrared or band images (see Fig. 8, middle and right panels). These objects have extremely red colours (), probably caused by either high redshifts or reddening due to dust.
Including the six objects discussed above ( in Table 3), the final identification sample is composed of 66 objects, corresponding to an identification rate of 77.6% (see last column of Table 3). On average the completeness is 98.9% and the contamination rate is 6.8%. Both these quantities refer to the sample of 60 identifications, statistically defined on the base of the likelihood ratio technique. A summary of the sample identification statistics is given in Table 3.
A list of all the identified radio sources is given in Table 6. The six objects included a posteriori (see discussion above) are added at the bottom of the table.
A comparison with other similar radio/optical studies is shown in Table 4. It is worth noting that the identification rate of our sample is consistent with the ones found in similar radio–optical studies taken from the literature. Of particular interest is the comparison with the identification rates reported for the VVDS–VLA sample (Ciliegi et al. 2005), and for the Phoenix survey (Sullivan et al. 2004), where the radio/optical analysis was performed down to the same optical depth.
It is also interesting to compare the present study with the shallower ATESP–EIS sample, where optical identifications were searched down to (see Prandoni et al. 2001). The identification rate increases from % of the ATESP–EIS to % of the ATESP–DEEP1, demonstrating the need for deep follow–up surveys to properly identify the mJy/sub–mJy radio population.
| Survey | Slim | NRS | Area | Ilim | %id |
| (mJy) | (sq.degr.) | ||||
| ATESP–DEEP1 | 0.4 | 85 | 0.75 | 24.3 | 77.6 |
| VVDS–VLA | 0.08 | 1054 | 1 | 24.5 | 74.0 |
| Phoenix | 0.1 | 839 | 3 | 24.5 | 79.0 |
| VLA–LH | 0.05 | 63 | 0.03 | 24 | 92.0 |
| ATESP–EIS | 0.4 | 386 | 3 | 22.5 | 57.3 |
5 Photometric redshifts for the identified ATESP radio sources
The optical spectra of radio sources are not exhaustively represented by the standard “stellar” templates used for normal inactive galaxies (Ellipticals, S0, Spirals, Irregulars, Star-bursts). We therefore added to the standard template spectra provided by Hyperz (BC and CWW) a set of spectral templates derived from the SDSS (Sloan Digital Sky Survey, York et al. 2000) quasar samples. In particular we added templates for: a) blue quasars (QSO, Hatziminaoglou et al. 2000); b) composite red quasars (REDQ, Richards et al. 2003); and c) composite broad absorption lines (BAL) quasars (BALQ, Reichard et al. 2003). These templates are available at the SDSS web pages.
For each identified ATESP radio source Hyperz was used to provide a possible (and corresponding reduced probability) for each set of templates (CWW, BC, blue, red and BAL quasars). Then, the “best” (highest probability) zphot was selected as the correct one, together with the corresponding spectral type.
In eleven cases it was not possible to assign a reliable zphot and spectral type to the optical radio source counterpart. Typically these are very faint objects (mag24 in detected bands), or objects with very limited colour information (e.g. detected only in NIR pass-bands), or objects with bad photometry due to nearby star and/or deblending problems. One of these cases could be recovered thanks to the availability of spectroscopy information (source ATESP J224958-395855).
In summary, it was possible to assign a redshift and a spectral type to 56 of the 66 radio sources identified in DEEP1a, b and c (85%). However, if we restrict our analysis to a magnitude-limited complete sample, we get a success rate of 97% (56/58 objects with redshift determination).
The relevant spectral parameters obtained for the 56 radio sources for which a redshift and type could be assigned, are reported in Table 6.
-
1.
Early type spectra (ETS): ellipticals, early spirals (bulge–dominated Sa);
-
2.
Late type spectra (LTS): late spirals (Sb, Sc, Sd) and irregular Magellanic (Im) galaxies;
-
3.
SB: star-burst galaxy spectra (typical of HII regions);
-
4.
PSB: post star-burst galaxy spectra (K+A and E+A galaxies);
-
5.
AGNs: objects with evident characteristics of either Seyfert 1, Seyfert 2, or quasar spectra (respectively labeled as Sy1, Sy2, Q);
For the 14 objects with optical spectroscopy available, we have in general a good match between spectral and photometric redshifts (, see Sect. 3.2). The exception is ATESP J224803-400513, for which we have a . In this case, the obtained photometric redshift () is much lower than the spectroscopic value of 1.72 (the published value, by Prandoni et al. 2001, was over-estimated).
We also find very good agreement between photometric and spectral types. There is only one case (source ATESP J225400-402204) where the photometric type (very old Sa) disagrees with the spectral type (LTS). However, note that passively evolving single bursts (defined as Burst in Hyperz BC templates) can be considered early or late, depending on their age. As a general rule, very old galaxies (age Gyr) are included among the ETS, while very young galaxies (age Gyr) are included among the LTS. For intermediate cases (ages between 0.1 and 1 Gyr) the classification is not straightforward, from wide-band information on the continuum shape alone. It is difficult to distinguish between LTS, ETS and PSB, with no information on the presence of narrow absorption and/or emission lines. For the sake of simplicity we decided to make a sharp separation between LTS and ETS at age Gyr, with the caveat that among such objects we could have some mis–classification. The value of 0.3 Gyr was chosen from a comparison between spectral type and Burst age in the few cases where spectroscopy was available. One probably mis–classified object is source ATESP5 J225321-402317 (Burst age 0.18 Gyr), which has linear size kpc and extended radio morphology, clearly indicating an AGN origin of its radio emission (see Fig. 13, middle panel).
The final classification given to the optical counterpart on the base of the present discussion is reported in last column of Table 6. The classes are defined following the spectral type definitions listed above. In the one case where photometric and spectral types disagree, we rely on the latter to define the object class.
To further check the reliability of our photometric redshift determinations, we compared our redshift distribution with the one expected for ETS on the base of the well-known K–z correlation found for radio source host galaxies (see e.g. Willott et al. 2003) and with the R–z relation found for host galaxies of gigahertz peaked spectrum (GPS) radio sources (see Snellen et al. 1996; Rigby et al. 2007). We find that the photometric redshift distribution obtained for objects classified as ETS in our sample follows, within a dispersion, the one expected on the base of the quoted relations.
6 The ATESP–DEEP1 source properties
| Sample | ETS | LTS+SB | AGNs | UNCL | |
|---|---|---|---|---|---|
| (%) | (%) | (%) | (%) | ||
| ATESP–EIS | |||||
| ATESP–DEEP1 |
We exploited the photometric redshift and spectral type determinations for the ATESP sources in the DEEP1a, b and c regions, to study the composition of the ATESP sample and the radio/optical properties of mJy and sub–mJy sources. It is important to note that the ATESP–DEEP1 sample overlaps with the ATESP–EIS sample. This means that photometric (or spectroscopic) redshifts obtained for sources in DEEP1a, b and c could be in principle complemented by the sparse spectroscopic information available from the ATESP–EIS for DEEP1d sources. Nevertheless, in the following it was preferred to limit our analysis to the sources in DEEP1a, b, and c, (see Table 6), which represent a much more reliable sample, thanks to the very high identification/redshift determination statistics.
Of the 66 identified radio sources, it was found that 37 are ETS, 8 are quasars (AGNs), 10 are LTS, 1 is a SB, while 10 objects could not be classified (UNCL).
In Table 5, the ATESP–DEEP1 composition is compared with the one found for the “brighter” ATESP–EIS sample (70 objects with complete spectroscopy down to , Prandoni et al. 2001). The ATESP–DEEP1 sample provides insight into the composition of the faint radio population associated with optically faint galaxies, albeit in this comparison we restrict our analysis to the magnitude-limited sample of 58 objects with , to reduce the number of unclassified objects. Table 5 shows that, as suggested by previous studies (e.g. Gruppioni et al. 1999; Prandoni et al. 2001), the contribution of star–forming (LTS plus SB) galaxies decreases dramatically with the magnitude, going from 43% of the ATESP–EIS “bright” () sample to 19% of the “deeper” () ATESP–DEEP1 sample. The fraction of ETS and AGNs, on the other hand, increases going to deeper magnitudes, even though the statistical uncertainties are large.
6.1 Redshift distribution
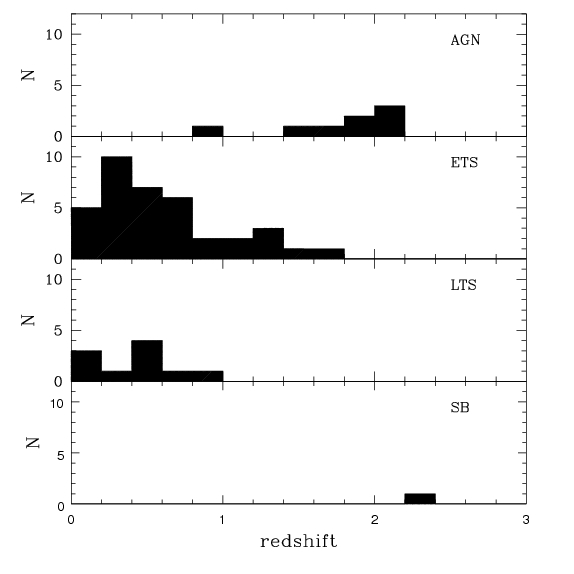
Figure 9 shows the redshift distribution of the 56 ATESP radio sources in regions DEEP1a, b and c, for which a reliable redshift estimate was obtained (see Table 6). Whenever spectroscopy is available (14 objects), we rely on the spectral redshift determination. The distribution of ETS shows a significant peak at z=0.4, with a tail extending up to z, while, as expected, quasars have typically higher redshifts , and LTS are found at z1. This reflects the fact that radio sources triggered by star formation are usually characterised by lower radio powers than sources triggered by AGN activity (see also Fig. 10). The only star-burst galaxy in the sample has either a redshift () or a radio power ( close to W/Hz, see Fig.10) that is much higher than for the LTS galaxy population. While this could be due to evolutionary effects in the population of the radio–selected star forming galaxies, it is also possible that the photometric classification is wrong. In fact the SB spectra are notoriously similar to narrow–line AGN spectra (Seyfert 2) and photometric techniques based on wide–band colours could easily fail in classifying such objects. In addition, the photometric routine applied to this sample (Hyperz) does not provide template spectra for Seyfert 2 galaxies.
6.2 Radio and optical luminosities
For the 56 ATESP radio sources in DEEP1a, b and c with redshift determination we derived radio and optical/NIR luminosities. Radio powers were K–corrected by using the 1.4 – 5 GHz radio spectral index of each source (see Table 6), while absolute magnitudes (computed by Hyperz) were K–corrected on the base of the optical spectral type.
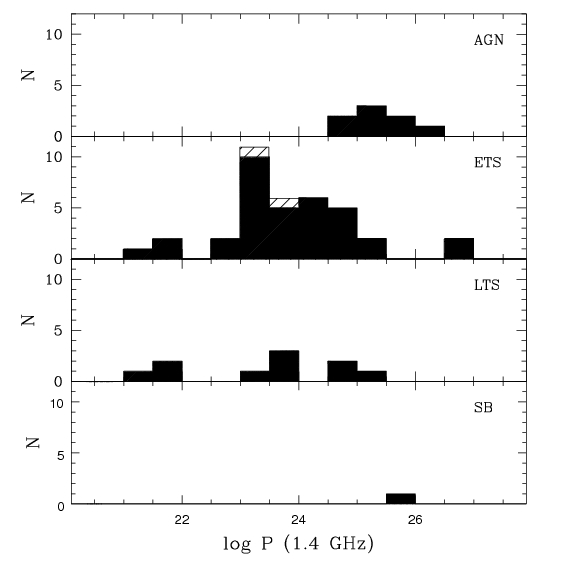
Figure 10 shows the 1.4 GHz radio power distribution for the sample. Again, the four classes (AGNs, ETS, LTS, and SB) are shown separately. ETS galaxies mostly have , which are typical values of FRI radio sources (Fanaroff & Riley 1974), while AGNs are, as expected, characterised by higher radio powers ( W/Hz). LTS galaxies, on the other hand, have low radio powers, with 7/10 having W/Hz, typical of radio sources triggered by star formation (see e.g. Condon & Broderick 1988).
If we assume that the ETS are triggered by low to medium luminosity AGN activity and put both AGNs and ETS objects in a single class, one finds that the sample is largely dominated by galaxies with an active nucleus (78%, see Table 5), which further demonstrates that sub–mJy samples like the ATESP are best suited to study the evolutionary behaviour of low–power AGNs.
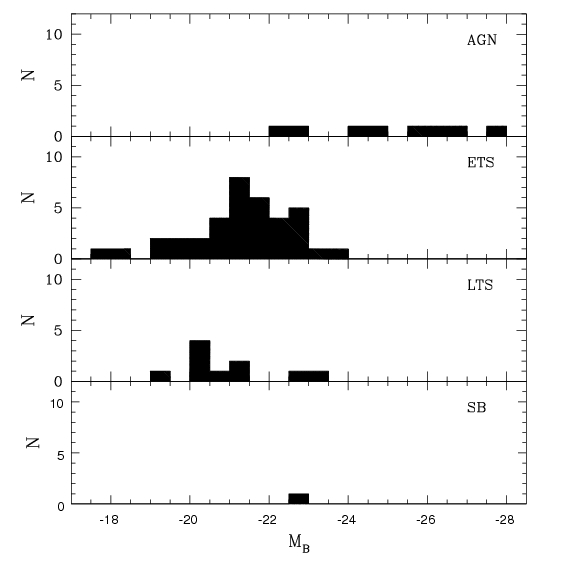
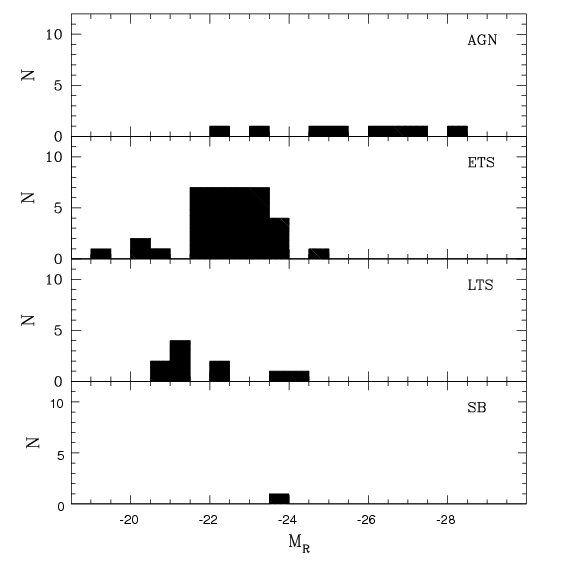
Figures 11 and 12 show the absolute magnitude distributions in B– and R–bands for the 56 ATESP–DEEP1 radio sources in fields DEEP1a, b and c with a redshift determination. AGNs are characterised by higher optical luminosities than ETS, LTS and SB galaxies. This is not surprising when we consider that in our sample all AGNs are photometrically and/or spectroscopically classified as quasars (see Table 6).
7 Nature of the mJy and sub-mJy radio population
In order to probe the origin (nuclear or on a larger scale) of the radio emission in mJy and sub–mJy sources and the physical processes responsible for the flattening of the radio spectral index found in sub-mJy samples like the ATESP (see §1), we made an overall comparison of the radio spectral index, the radio morphology and the optical properties of the entire ATESP–DEEP1 sample.
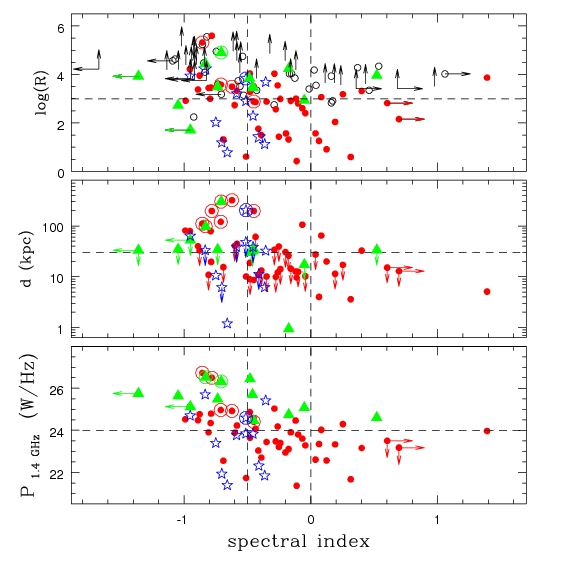
In Fig. 13 (top panel) the radio–to–optical ratio is plotted as a function of spectral index for the whole ATESP–DEEP1 sample (fields a, b, c and d). The radio–to–optical ratio was defined following Condon (1980), as , where is the source 1.4 GHz flux density (in mJy) and is the optical magnitude (here we assume the I–band magnitude). We thus can include sources without known redshifts. In the following we use both DPS and ATESP-EIS optical data (see Prandoni et al. 2001), when available, while lower limits to are given whenever a source was not identified down to the limiting magnitude of the optical surveys ( for EIS–WIDE and for DPS DEEP1). For the sources with spectral type/redshift estimates available (either from multi–colour photometry or spectroscopy) we can distinguish between ETS (red filled circles), LTS plus star-burst galaxies (blue stars) and AGNs (green double triangles).
Figure 13 clearly shows that most of the flat–spectrum sources have high radio–to–optical ratios (), typically associated with the classical powerful radio galaxies and quasars. Flat–spectrum sources with low values are preferentially identified with ETS, where the radio emission is again probably triggered by nuclear activity (typical radio powers W/Hz, see Fig. 10 and discussion therein). Star–forming galaxies (LTS and SB), on the other hand, are typically associated to steep–spectrum sources, as expected for synchrotron emission in galactic disks or in nuclear star-bursts.
A further radio/optical analysis of the ETS in the ATESP–DEEP1 sample has shown that ETS with flat and/or inverted spectrum are preferentially compact (linear sizes kpc, see Fig. 13, middle panel). Their rather low radio luminosities ( WHz-1, see Fig. 13, bottom panel) and the absence of emission lines in the optical spectra may suggest that these objects belong to the class of FRI radio galaxies; but FRI radio galaxies are characterised, on average, by steeper radio spectra and larger linear sizes (but see the linear size – radio power relation found for B2 radio galaxies, de Ruiter et al. 1990 and references therein).
The compactness of the sources, together with the
flat/inverted spectra, suggests core emission with strong synchrotron or
free-free self-absorption. This could be associated to either very early
phases of nuclear radio-activity (the so-called GHz peaked spectrum - GPS -
radio sources, O’Dea 1998; Snellen et al. 2000) or late phases of the
evolution of
AGNs, characterised by low accretion/radiative efficiency
(advection-dominated accretion flow, i.e.
ADAF; advection dominated inflow-outflow solutions, i.e. ADIOS).
In the first case, however, larger luminosities are expected
( WHz-1), while in the latter case
very low radio powers are predicted ( WHz-1;
see Doi et al. 2005).
Another intriguing possibility is that in these sources ADAF and radio jets
coexist, as suggested for low luminosity AGNs, (LLAGNs, see e.g.
Doi et al. 2005 and reference therein).
This would explain the somewhat brighter
luminosities than expected by simple ADAF and can still be consistent with the
presence of flat/inverted radio spectra (see ADAF-jet model by
Falcke & Bierman 1999).
This class of objects may also be very similar to the composite class of the so-called low power ( WHz-1) compact ( kpc) – LPC – radio sources studied by Giroletti et al. (2005). Their host galaxies do not show signatures of strong nuclear activity in the optical (and X-ray) bands. Preliminary results indicate that multiple causes can produce LPC sources: geometrical-relativistic effects (low power BL-Lacertae objects), youth, instabilities in the jets, frustration by a denser than average ISM, and a premature end of nuclear activity.
8 Summary
In this paper we have discussed the nature of the faint, sub-mJy, radio population, using a sample of 131 radio sources that were observed at 1.4 and 5 GHz with the ATCA (the ATESP–DEEP1 sample). A smaller sample of 85 radio sources is covered by deep multi–colour images. These were optically identified down to very faint magnitudes, which was possible thanks to the availability of very deep multi–colour optical material (in U, B, V, R, I, and sometimes J and K bands). The high percentage of identifications () makes this a sample that is well suited for follow up studies concerning the composition of the sub-mJy population and, in general, the cosmological evolution of the various classes of objects associated with faint radio sources.
We summarise our main results here.
-
•
For 85% of the identification sample we succeeded in deriving reliable photometric redshifts, based on the available accurate colours (UBVRIJK).
-
•
Based on spectral types determined either directly from spectroscopy or from the photometry (or both), we find that at the sub-mJy level the large majority of sources are associated with objects that have early type (64%) and AGN (14%) spectra; these are of course what we would normally call radio galaxies and quasars.
-
•
Although earlier work (based on shallower optical imaging and spectroscopy) revealed the presence of a conspicuous component of late type and star-burst objects, such objects appear to be important only at brighter magnitudes (), and are rare at fainter magnitudes ().
-
•
From an overall comparison of the radio spectral index with other radio and optical properties of the entire ATESP–DEEP1 sample, we find that most sources with flat radio spectra have high radio-to-optical ratios, as expected for classical radio galaxies and quasars. Flat-spectrum sources with low radio-to-optical ratios are preferentially associated with ETS, in which the radio emission is most plausibly triggered by nuclear activity as well, while star-forming galaxies are associated to steep-spectrum radio sources.
-
•
ETS with flat or inverted spectra are mostly compact, with linear size kpc, suggesting core-dominated radio emission. Their low radio luminosities (in the range W/Hz at 1.4 GHz) and the absence of emission lines in their spectra (when available) suggest that they are FRI sources, although these would normally have steeper spectra and be more extended. They may therefore represent specific phases in the life of a radio source, or may be similar to the low power compact radio sources discussed by Giroletti et al. (2005).
Acknowledgements.
AM thanks Luiz da Costa and the ESO Imaging Survy (EIS) Team for their hospitality and for the assistance with the optical and NIR data reduction during his stay in Garching.| Source Name | U | B | V | R | I | J | Ks | SED | Age (Gyr) | Sp. Type | Notes | Class | |||
| ATESP5 | J224750-400148 | 21.8 | 20.7 | 19.3 | 18.4 | - | - | 0.35 | Burst | 8.5 | 0.442 | ETS | (a) | ETS | |
| ATESP5 | J224753-400455 | 23.4 | 22.5 | 21.3 | 20.1 | - | - | 0.61 | Burst | 1.7 | - | - | ETS | ||
| ATESP | J224759-400825 | 25.4 | 25.2 | 25.2 | 24.3 | - | - | - | - | - | - | - | - | ||
| ATESP5 | J224801-400542 | 23.1 | 22.1 | 20.9 | 19.8 | - | - | 0.56 | Burst | 2.0 | - | - | ETS | ||
| ATESP | J224803-400513 | 17.7 | 18.4 | 17.9 | 17.6 | 17.2 | - | - | 1.00 | QSO | - | 1.72 | QSO | (bc) | AGN |
| ATESP5 | J224809-402211 | 22.5 | 23.0 | 22.7 | 21.5 | 20.8 | - | - | 0.55 | Sc | 4.5 | - | - | LTS | |
| ATESP | J224811-402455 | 22.0 | 22.7 | 22.4 | 21.6 | 21.1 | - | - | 0.55 | Burst | 0.05 | - | - | LTS | |
| ATESP | J224817-400819 | 25.1 | 23.9 | 22.9 | 21.8 | 20.3 | - | - | 0.80 | Burst | 1.0 | - | - | ETS | |
| ATESP5 | J224822-401808 | 25.1 | 23.5 | 22.2 | 20.6 | 19.4 | - | - | 0.37 | Ell | 6.5 | - | - | ETS | |
| ATESP | J224843-400456 | 24.3 | 25.6 | 24.8 | 24.9 | 24.3 | - | - | - | - | - | - | - | - | |
| ATESP5 | J224850-400027 | 21.8 | 22.3 | 21.8 | 20.8 | 19.7 | - | - | - | - | - | - | - | - | |
| ATESP5 | J224858-402708 | 22.1 | 22.3 | 21.6 | 20.5 | 19.8 | - | - | 0.48 | Burst | 0.09 | - | - | LTS | |
| ATESP | J224911-400859 | 17.8 | 17.4 | 16.9 | 16.2 | 15.6 | - | - | 0.11 | Sbc | - | 0.065 | LTS | (b) | LTS |
| ATESP5 | J224919-400037 | 25.1 | 22.6 | 21.5 | 20.0 | 19.0 | - | - | 0.35 | Burst | 10.5 | - | - | ETS | |
| ATESP5 | J224932-395801 | 23.6 | 24.1 | 23.0 | 21.6 | 20.4 | - | - | 0.60 | Burst | 2.0 | 0.713 | ETS | (ad) | ETS |
| ATESP5 | J224935-400816 | 18.3 | 17.6 | 16.6 | 15.9 | 15.2 | - | - | 0.11 | Burst | 12.5 | 0.153 | ETS | (a) | ETS |
| ATESP5 | J224948-395918 | 25.1 | 25.3 | 25.9 | 24.5 | 23.5 | - | - | - | - | - | - | - | - | |
| ATESP5 | J224951-402035 | 14.6 | 18.6 | 18.4 | 18.0 | 17.6 | - | - | - | - | - | - | - | - | |
| ATESP5 | J224958-395855 | 13.6 | 16.7 | 16.4 | 16.3 | 15.2 | - | - | - | - | - | 0.249 | ETS | (b) | ETS |
| ATESP5 | J225004-402412 | 25.1 | 23.4 | 22.3 | 21.2 | 20.0 | - | - | 0.61 | Burst | 1.7 | - | - | ETS | |
| ATESP5 | J225008-400425 | 18.5 | 18.0 | 17.1 | 16.4 | 15.7 | - | - | 0.10 | Burst | 3.5 | 0.126 | ETS | (e) | ETS |
| ATESP | J225009-400605 | 25.1 | 25.1 | 23.8 | 22.4 | 21.0 | - | - | 0.74 | Burst | 1.0 | - | - | ETS | |
| ATESP5 | J225028-400333 | 20.7 | 21.0 | 20.4 | 19.2 | 18.5 | - | - | 0.51 | Burst | 0.18 | 0.540 | LTS | (b) | LTS |
| ATESP5 | J225048-400147 | 24.6 | 25.7 | 26.4 | 25.9 | 23.8 | - | - | - | - | - | - | - | - | |
| ATESP5 | J225056-400033 | 23.9 | 24.7 | 24.6 | 23.2 | 22.2 | - | - | 1.43 | REDQ | - | - | - | AGN | |
| ATESP5 | J225056-402254 | 21.2 | 20.4 | 19.1 | 18.3 | 17.4 | - | - | 0.21 | Burst | 11.5 | - | - | ETS | |
| ATESP5 | J225057-401522 | 15.8 | 15.3 | 14.6 | 14.0 | 13.2 | - | 13.0 | 0.01 | Burst | 0.72 | 0.033 | ETS | (af) | ETS |
| ATESP5 | J225058-401645 | 24.6 | 26.3 | 24.7 | 23.1 | 21.0 | - | 18.6 | 0.96 | Burst | 1.02 | - | - | ETS | |
| ATESP5 | J225100-400934 | 24.6 | 25.7 | 26.9 | 24.5 | 22.5 | - | 18.0 | 1.21 | Ell | 5.5 | - | - | ETS | |
| ATESP5 | J225112-402230 | 26.0 | 25.7 | 27.8 | 26.5 | 24.4 | - | 18.5 | - | - | - | - | - | - | |
| ATESP5 | J225122-402524 | 23.1 | 23.7 | 23.5 | 23.1 | 22.6 | - | 19.5 | 2.23 | SB2 | - | - | - | SB | |
| ATESP5 | J225138-401747 | 19.4 | 19.3 | 18.4 | 17.8 | 17.0 | 16.0 | 14.5 | 0.21 | Burst | 0.26 | 0.235 | LTS | (e) | LTS |
| ATESP | J225206-401947 | 20.3 | 20.6 | 20.1 | 19.7 | 19.1 | 18.4 | 17.1 | 2.06 | QSO | - | - | - | AGN | |
| ATESP5 | J225217-402135 | 22.7 | 23.8 | 23.4 | 22.9 | 22.3 | 20.9 | 19.2 | 0.93 | BALQ | - | - | - | AGN | |
| ATESP5 | J225223-401841 | 15.7 | 15.4 | 14.9 | 14.3 | 13.6 | 12.7 | 11.5 | 0.04 | Sa | 12.5 | 0.033 | ETS | (af) | ETS |
| ATESP5 | J225239-401949 | 14.9 | 14.8 | 14.3 | 13.8 | 13.1 | 12.2 | 11.3 | 0.06 | Sa | 8.5 | 0.033 | ETS | (e) | ETS |
| ATESP5 | J225242-395949 | 23.9 | 24.2 | 22.9 | 21.7 | 20.7 | - | - | 0.41 | Burst | 0.36 | - | - | ETS | |
| ATESP5 | J225249-401256 | 24.0 | 25.7 | 24.3 | 22.6 | 20.9 | 19.4 | 17.5 | 0.59 | Ell | 5.5 | - | - | ETS | |
| ATESP5 | J225316-401200 | 23.7 | 23.6 | 22.5 | 21.2 | 20.0 | - | - | 0.36 | Ell | 5.5 | - | - | ETS | |
| ATESP5 | J225321-402317 | 22.1 | 23.3 | 22.8 | 21.9 | 21.2 | - | - | 0.70 | Burst | 0.18 | - | - | LTS | |
| ATESP5 | J225322-401931 | 24.6 | 25.3 | 23.1 | 21.7 | 20.0 | - | - | 0.30 | Burst | 10.5 | - | - | ETS | |
| ATESP5 | J225323-400453 | 24.6 | 25.0 | 24.0 | 22.8 | 21.5 | - | 18.2 | 0.36 | Sa | 6.5 | - | - | ETS | |
| ATESP5 | J225325-400221 | 23.1 | 22.8 | 21.7 | 20.4 | 19.1 | - | 16.1 | 0.37 | Ell | 5.5 | - | - | ETS | |
| ATESP5 | J225332-402721 | 24.6 | 25.6 | 26.9 | 24.2 | 24.0 | - | - | - | - | - | - | - | - | |
| ATESP5 | J225344-401928 | 23.8 | 24.9 | 24.4 | 24.1 | 22.7 | - | 18.8 | 1.40 | Ell | 3.5 | - | - | ETS | |
| ATESP5 | J225345-401845 | 19.9 | 19.2 | 18.1 | 17.3 | 16.3 | - | 14.3 | 0.29 | Burst | 1.7 | - | - | ETS | |
| ATESP | J225351-400441 | 25.3 | 23.9 | 23.7 | 23.2 | 22.4 | - | - | 2.20 | QSO | - | - | - | AGN | |
| ATESP5 | J225353-400154 | 21.3 | 21.3 | 21.4 | 20.9 | 19.7 | - | 17.1 | 2.00 | REDQ | - | - | - | AGN | |
| ATESP5 | J225400-402204 | 16.8 | 16.4 | 15.8 | 15.1 | 14.2 | - | - | 0.03 | Sa | 13.5 | 0.033 | LTS | (g) | LTS |
| ATESP5 | J225404-402226 | 21.4 | 21.4 | 20.7 | 19.5 | 18.6 | - | 16.2 | 0.43 | Ell | 4.5 | - | - | ETS | |
| ATESP5 | J225414-400853 | 15.1 | 15.3 | 15.0 | 14.6 | 14.1 | 13.6 | 12.8 | 0.07 | Burst | 0.09 | 0.032 | LTS | (e) | LTS |
| ATESP5 | J225430-400334 | 25.3 | 23.4 | 22.3 | 20.9 | 19.4 | - | 16.4 | 0.56 | Burst | 2.6 | - | - | ETS | |
| ATESP | J225430-402329 | 25.3 | 25.6 | 25.1 | 24.1 | 22.3 | - | 18.7 | 1.03 | Ell | 4.5 | - | - | ETS | |
| ATESP5 | J225434-401343 | 25.3 | 25.8 | 25.8 | 24.6 | 23.2 | 20.7 | 19.0 | 1.64 | Burst | 0.36 | - | - | ETS | |
| ATESP5 | J225436-400531 | 25.3 | 22.2 | 21.1 | 19.7 | 18.4 | 17.7 | 16.0 | 0.44 | Burst | 4.5 | - | - | ETS | |
| ATESP5 | J225442-400353 | 25.3 | 25.1 | 24.1 | 22.9 | 21.0 | 19.5 | 17.6 | 0.81 | Ell | 5.5 | - | - | ETS | |
| ATESP5 | J225449-400918 | 23.2 | 23.6 | 23.3 | 23.2 | 22.3 | 20.6 | 18.9 | 1.58 | Ell | 2.6 | - | - | ETS | |
| ATESP5 | J225509-402658 | 21.6 | 22.3 | 21.8 | 21.0 | 19.4 | - | 16.5 | 0.97 | Burst | 0.13 | - | - | LTS | |
| ATESP5 | J225515-401835 | 23.3 | 23.7 | 23.0 | 22.5 | 21.1 | 19.2 | 15.9 | 2.20 | REDQ | - | - | - | AGN | |
| ATESP5 | J225529-401101 | 25.3 | 23.3 | 22.2 | 21.0 | 19.5 | 18.7 | 16.6 | 0.73 | Burst | 0.36 | - | - | ETS | |
| ATESP5 | J224827-402515 | 22.2 | 22.8 | 22.8 | 22.0 | 21.0 | - | - | 1.25 | Burst | 0.36 | - | - | ETS | |
| ATESP5 | J225034-401936 | 24.6 | 24.5 | 24.0 | 22.9 | 21.1 | - | - | 1.17 | Burst | 0.72 | - | - | ETS | |
| ATESP5 | J225426-402442 | 25.3 | 24.1 | 23.9 | 23.4 | 22.2 | - | 18.7 | 1.92 | REDQ | - | - | - | AGN | |
| ATESP5 | J225443-401147 | 25.3 | 25.9 | 25.8 | 25.7 | 23.8 | 22.2 | 20.0 | - | - | - | - | - | - | |
| ATESP5 | J225505-401301 | 20.6 | 19.8 | 18.6 | 17.7 | 16.8 | 16.0 | 14.7 | 0.35 | Burst | 1.0 | - | - | ETS | |
| ATESP5 | J225511-401513 | 25.3 | 25.9 | 25.8 | 25.7 | 23.8 | 21.2 | 18.3 | - | - | - | - | - | - | |
| a On-going spectroscopy program (Prandoni et al. in prep.) | |||||||||||||||
| b Spectroscopy from Prandoni et al. (2001). | |||||||||||||||
| c Spectroscopic redshift re-measured: published value was over-estimated. | |||||||||||||||
| d Same redshift obtained by Olsen et al. (2005): galaxy in a cluster at . | |||||||||||||||
| e Spectroscopy from Vettolani et al. (1998). | |||||||||||||||
| f Same redshift obtained by Di Nella et al. (1996). | |||||||||||||||
| g Spectroscopy obtained from 6dF public data. | |||||||||||||||
References
- Afonso et al. (2006) Afonso J., Mobasher B., Koekemoer A., Norris R.P., Cram L., 2006, AJ, 131, 1216
- Bertin & Arnouts (1996) Bertin E., Arnouts S., 1996, A&AS, 117, 393
- Bolzonella et al. (2000) Bolzonella M., Miralles J.-M., Pelló R., 2000, A&A, 363, 476
- Bondi et al. (2003) Bondi M., Ciliegi P., Zamorani G., et al., 2003, A&A, 403, 857
- Bruzual & Charlot (1993) Bruzual G., Charlot S., 1993, ApJ, 405, 538
- Ciliegi et al. (2005) Ciliegi P., Zamorani G., Bondi M., et al., 2005, A&A, 441, 879
- Ciliegi et al. (2003) Ciliegi P., Zamorani G., Hasinger G., et al., 2003, A&A, 398, 901
- Coleman et al. (1980) Coleman D.G., Wu C.C., Weedman D.W., 1980, ApJS, 43, 393
- Condon (1980) Condon J.J., 1980, ApJ, 242, 894
- Condon & Broderick (1988) Condon J.J., & Broderick J.J., 1988, AJ, 96, 30
- de Ruiter et al. (1977) de Ruiter H.R., Willis A.G., Arp H.C., 1977, A&AS, 28, 211 1997, A&A, 319, 7
- de Ruiter et al. (1990) de Ruiter H.R., Parma P., Fanti C., Fanti R., 1990, A&A, 351, 361
- Di Nella et al. (1996) Di Nella H., Couch W.J., Paturel G., and Parker Q.A., 1996, MNRAS, 283, 367
- Doi et al. (2005) Doi A., Kameno S., Kohno K., Nakanishi K., Inoue M., 2005, MNRAS, 363, 692
- Donnelly et al. (1987) Donnelly R.H., Partridge R.B., Windhorst R.A., 1987, ApJ, 321, 94
- Erben et al. (2005) Erben T., Schirmer M., Dietrich J.P., et al., 2005, Astronomische Nachrichten, 326, 432
- Falcke & Bierman (1999) Falcke & Biermann 1999, A&A, 342, 49
- Fanaroff & Riley (1974) Fanaroff B.L., Riley J.M., 1974, MNRAS, 167P, 31F
- Georgakakis et al. (1999) Georgakakis A., Mobasher B., Cram L., et al., 1999, MNRAS 306, 708
- Girardi et al. (2005) Girardi L., Groenewegen M., Hatziminaoglou E., da Costa L., 2005, A&A, 436, 895
- Giroletti et al. (2005) Giroletti M., Giovannini G., Taylor G.B., 2005, A&A, 441, 89
- Gruppioni et al. (1999) Gruppioni C., Ciliegi P., Rowan-Robinson M., et al., 1999, MNRAS 305, 297
- Gruppioni et al. (1997) Gruppioni C., Zamorani G., de Ruiter H.R., et al., 1997, MNRAS 286, 470
- Hatziminaoglou et al. (2000) Hatziminaoglou E., Mathez G., Pelló R., 2000, A&A, 359, 9
- Hildebrandt et al. (2006) Hildebrandt H., Erben T., Dietrich J.P., et al. 2006, A&A, 452, 1121
- Hopkins et al. (1998) Hopkins A.M., Mobasher B., Cram L., Rowan-Robinson M., 1998, MNRAS, 296, 839
- Magliocchetti et al. (2000) Magliocchetti M., Maddox S.J., Wall J.V., et al., 2000, MNRAS, 318, 1047
- Mignano et al. (2007) Mignano A., Miralles J.-M., da Costa L., et al., 2007, A&A, 462, 553
- Nonino et al. (1999) Nonino M., Bertin E., da Costa L., et al., 1999, A&AS 137, 51
- O’Dea (1998) O’Dea 1998, PASP, 110, 493
- Olsen et al. (2005) Olsen L.F., Zucca E., Bardelli S., et al., 2005, A&A, 442, 841
- Olsen et al. (2006) Olsen L.F., Miralles J.-M., da Costa L., Vandame B., Madejsky R., Jorgensen H.E., Mignano A., et al., 2006, A&A, 456, 881
- Prandoni et al. (2000a) Prandoni I., Gregorini L., Parma P., de Ruiter H.R., Vettolani G., Wieringa M.H., Ekers R.D., 2000a, A&AS, 146, 31
- Prandoni et al. (2000b) Prandoni I., Gregorini L., Parma P., de Ruiter H.R., Vettolani G., Wieringa M.H., Ekers R.D., 2000b, A&AS, 146, 41
- Prandoni et al. (2001) Prandoni I., Gregorini L., Parma P., de Ruiter H.R., Vettolani G., Zanichelli A., Wieringa M.H., Ekers R.D., 2001, A&A, 369, 787
- Prandoni et al. (2006) Prandoni I., Parma P., Wieringa M.H., de Ruiter H.R., Gregorini L., Mignano A., Vettolani G., Ekers R.D., 2006, A&A, 457, 517, Paper I
- Reichard et al. (2003) Reichard T.A., Richards G.T., Schneider D.P., Hall P.B., Tolea A., Krolik J.H., Tsvetanov Z., Vanden Berk D.E., et al., 2003, AJ, 125, 1711
- Richards et al. (1999) Richards E.A., Fomalont E.B., Kellermann K.I., et al., 1999, ApJ 526, L73
- Richards et al. (2003) Richards G.T., Hall P.B., Vanden Berk D.E., Strauss M.A., Schneider D.P., Weinstein M.A., Reichard T.A., York D.G., Knapp G.R., Fan Xiaohui, 2003, AJ, 126, 1131
- Rigby et al. (2007) Rigby E.E., Snellen I.A.G., Best P.N., 2007, MNRAS, in press (arXiv:0706.2323 [astro-ph])
- Schinnerer et al. (2006) Schinnerer E., Smolcic V., Carilli C.L., et al. 2006, ApJS, COSMOS special issue
- Schirmer et al. (2003) Schirmer M., Erben T., Schneider P., et al. 2003, A&A, 407, 869
- Simpson et al. (2006) Simpson C., Martinez-Sansigre A., Rawlings S. et al., 2006, MNRAS, 372, 741
- Snellen et al. (2000) Snellen I.A.G., et al., 2000, MNRAS 319, 445
- Snellen et al. (1996) Snellen I.A.G., Bremer M.N., Schilizzi R.T., Miley G.K., van Ojik R., 1996, MNRAS 279, 1294
- Sullivan et al. (2004) Sullivan M., Hopkins A.M., Afonso J., Georgakakis A. Chan B., Cram L.E., Mobasher B., Almeida C., 2004, ApJS, 155, 1
- Sutherland & Saunders (1992) Sutherland W. & Saunders W., 1992, MNRAS, 259, 413
- Vettolani et al. (1997) Vettolani G., Zucca E., Zamorani G., et al., 1997, A&A 325, 954
- Vettolani et al. (1998) Vettolani G., Zucca E., Merighi R., et al., 1998, A&AS 130, 323
- Willott et al. (2003) Willott C.J., Rawlings S., Jarvis M.J., Blundell K.M., 2003, MNRAS, 339, 173
- Windhorst et al. (1990) Windhorst R.A., Mathis D., Neuschaefer L., 1990. In: Kron R.G. (ed.) Evolution of the Universe of Galaxies, ASP Conf. Ser. 10, 389
- York et al. (2000) York, D. G., Adelman, J., Anderson, J. E. et al., 2000 AJ, 120, 1579