Structure of Supergiant Shells in the Large Magellanic Cloud
Abstract
Nine supergiant shells (SGSs) have been identified in the Large Magellanic Cloud (LMC) based on H images, and twenty-three SGSs have been reported based on H I 21-cm line observations, but these sets do not always identify the same structures. We have examined the physical structure of the optically identified SGSs using H I channel maps and P-V diagrams to analyze the gas kinematics. There is good evidence for seven of the nine optically identified SGSs to be true shells. Of these seven H SGSs, four are the ionized inner walls of H I SGSs, while three are an ionized portion of a larger and more complex H I structure. All of the H SGSs are identified as such because they have OB associations along the periphery or in the center, with younger OB associations more often found along the periphery. After roughly 12 Myrs, if no new OB associations have been formed a SGS will cease to be identifiable at visible wavelengths. Thus, the presence and location of ionizing sources is the main distinction between shells seen only in H I and those also seen in H. Based on our analysis, H observations alone cannot unambiguously identify SGSs, especially in distant galaxies.
1 Introduction
Observations of the interstellar medium (ISM) of spiral and irregular galaxies have revealed complex filamentary structures indicative of a violent ISM (McCray & Snow, 1979). The largest of these structures are the supergiant shells (SGSs), with diameters approaching 1 kpc (Goudis & Meaburn, 1978). SGSs are thought to be formed by the fast stellar winds and supernova explosions of multiple OB associations; they require – ergs for their creation, the equivalent of tens to hundreds of supernova explosions (Meaburn, 1980). The diameter of these shells often exceeds the scale height of the galactic gas disk, allowing them to puncture the gas disk and vent their hot interior gas into the galactic halo. The expansion of SGSs may also cause further star formation. It has been suggested that the compression of the ISM on the rims of these shells and its subsequent gravitational collapse may be a significant cause of self-propagating star formation in galactic disks, thereby providing important insight into galactic evolution. To examine the impact of SGSs on their host galaxy, it is necessary to determine the physical structure of SGSs that have been identified based on their morphology alone, since some may be merely chance superpositions of unrelated filaments.
The Large Magellanic Cloud (LMC) is an excellent site to explore the nature of SGSs. With its low inclination there is little line-of-sight confusion, and its proximity (50 kpc; Feast 1999) allows us to probe its ISM in a detail impossible for most other galaxies. SGSs in the LMC were first identified by Goudis & Meaburn (1978), based on visual inspection of H images of the ionized ISM. This original paper tabulated four SGSs, a number that was later expanded to nine by Meaburn (1980). Later work on LMC SGSs, however, has also been done based on observations of H I, the neutral atomic ISM. Kim et al. (1999) examined the LMC in H I and tabulated 23 SGSs that have diameters greater than 360 pc. Curiously, there is not a one-to-one correspondence between the largest H I-selected SGSs and the nine H-selected SGSs.
To investigate the physical structure of the H-selected SGSs and their relationship with the H I-selected SGSs, we have examined the H I environment of the H-selected SGSs using the H images from the Magellanic Cloud Emission Line Survey (MCELS; Smith et al., 2005) and the H I synthesis maps made with combined observations from the Australia Telescope Compact Array and Parkes Telescope (Kim et al., 2003). In this paper we describe these data sets in §2 and our methodology in §3, and critically examine the physical structure of the nine H-selected SGSs in §4. We discuss the nature of the SGSs and compare the H I-selected and H-selected shells in §5. A summary is given in §6.
2 H and H I Observations
The MCELS H images were taken with a CCD camera on the Curtis Schmidt Telescope at Cerro Tololo Inter-American Observatory (CTIO). The images have an angular resolution of 3′′, and were taken with a narrow-band interference filter centered on the H line ( Å, Å). The detector was a front-illuminated STIS 2048 2048 CCD with 21 m pixels, giving a field of view of 11 11 (Smith & The MCELS Team, 1999). The H images were mosaicked to cover the central 8∘ 8∘ of the LMC. From the mosaic we extracted regions covering the neighborhoods of the nine H-selected shells of Meaburn (1980).
The neutral hydrogen data were obtained by Kim et al. (2003) using the Australia Telescope Compact Array (ATCA) and combining with single-dish observations using the Parkes Telescope. These observations cover 111 124 of the sky, and have an angular resolution of 10 and a resulting pixel size of . The observing band was centered on 1.419 GHz, corresponding to a central heliocentric velocity of 297 km s-1. The bandwidth used was 4 MHz, giving a complete velocity range of 33 to +627 km s-1 (Kim et al., 1998, 2003). Heliocentric velocities () are used throughout this paper.
3 Methodology
The first step in our analysis of the optically identified SGSs was to locate the nine shells identified by Meaburn (1980) within the H image of the LMC. Using the rough sketch provided by Meaburn (1980) as a guide, we found structures which resembled their representation on the drawing. Some of these structures were difficult to locate, such as SGS 7, 8 and 9, because they are faint, incomplete and irregular. For each SGS we then extracted regions with roughly twice the linear size of the optical shell from the H-mosaic and the H I data cube, with the exception of SGS 4 and 5 which were grouped together.
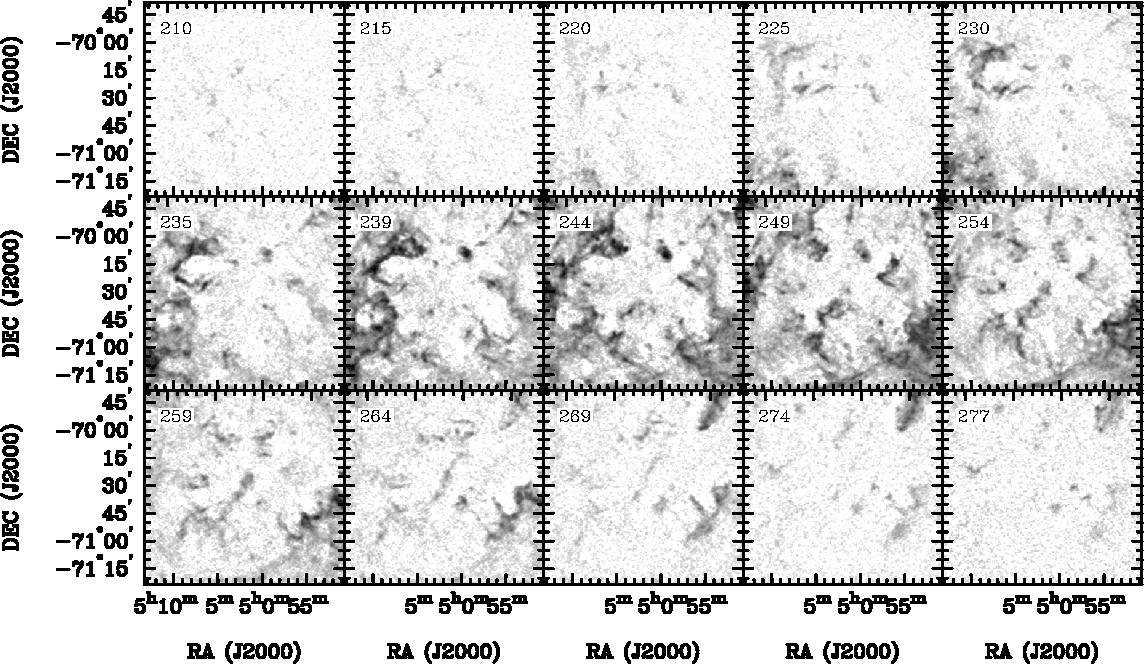
The H I data cube provides both column density and velocity information along each line of sight. We began our investigation into the structure of a SGS by examining its H I column density map, which is integrated over all velocities. We then examined the kinematics of the gas using a series of isovelocity images, or channel maps, to show the distribution of gas at different velocities. The channel maps typically spanned a range of 100 km s-1, at intervals of 4 - 5 km s-1. We used the channel maps to estimate the systemic velocity of a shell and used the map for the systemic velocity to determine whether the structure has a central cavity and whether the rim has brighter emission than the surroundings, indicating a shell structure rather than a hole.
Once the general kinematic structure of a shell was ascertained from the channel maps, we used this information to guide the selection of positions for position-velocity (P-V) diagrams. The P-V diagrams are produced by collapsing a narrow strip of the H I data cube along its short axis to show the distribution of velocities along the longer axis of the strip, equivalent to an optical long-slit spectrum. These P-V diagrams are ideal for quantitative expansion velocity measurements, and also tell us whether the shell has a blowout structure.
Images of these data were created and overlaid using the plotting task CGDISP in MIRIAD, a radio interferometry data reduction package, and WIP, a graphics software package, both created for the Berkeley-Illinois-Maryland Association (BIMA) Radio array. Analysis of the data was also done using the astronomical data processing package SAOimage DS9, developed by Smithsonian Astrophysical Observatory, which provided a user-friendly interface for explorations of datasets.
4 Analysis of Individual SGSs
The nine SGSs cataloged by Meaburn (1980) were identified based on a shell-like structure in H, and they have been commonly referred to as LMC 1-9. To distinguish this sample from the 23 H I-selected shells (Kim et al., 1999), we will call the latter SGS 1-23. The H II region names cited in this section are “N” from Henize (1956) and “DEM L” from Davies et al. (1976). The “LH” designation of OB associations is from Lucke & Hodge (1970).
4.1 LMC 1
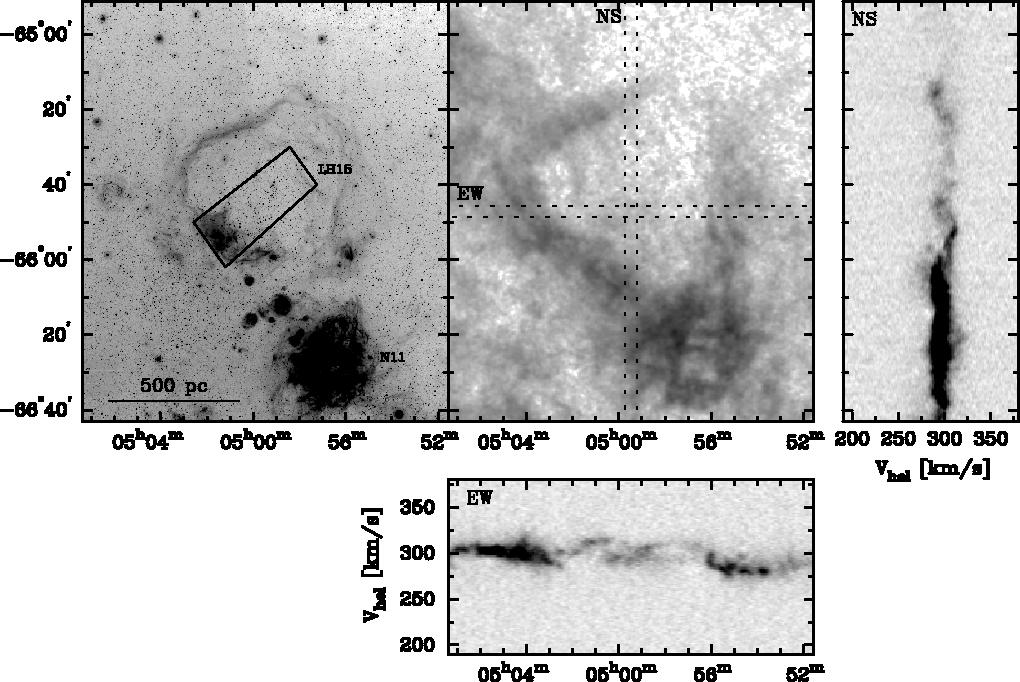
The SGS LMC 1 is located in the northwest corner of the LMC, with central coordinates 5h00m, 65∘40′ (J2000). The optical shell of LMC 1 has a diameter of 50′, corresponding to 750 pc (see Fig. 1). The H image shows that the southeast and northeast edges of the shell are brighter than the western side, indicating a density gradient of ionized hydrogen from east to west over the shell. The H I shell, which is larger than the H shell and lies outside of it, also shows this density gradient, with the southeast wall much brighter than the other sides. The H I column densities at the northwest corner of LMC 1 are so low that the gray-scale image appears to show a gap.
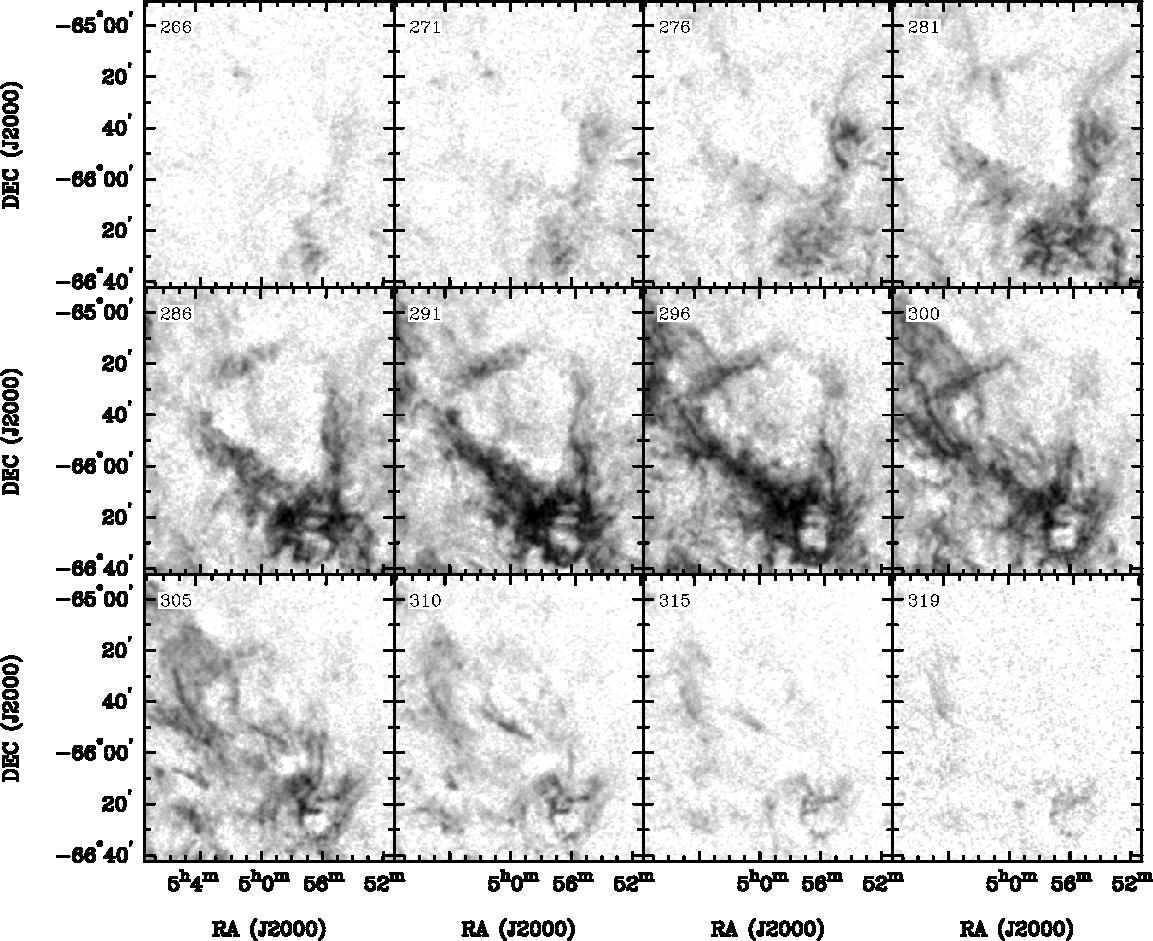
LMC 1 is detected in channel maps (Fig. 2) in the velocity range of 265 to 315 km s-1 with a systemic velocity of 295 km s-1. The channel maps near the systemic velocity show that the rim of LMC 1 is complete with no gap in the northwest corner. The north and west sides of the shell appear to be blueshifted by up to 20 km s-1 relative to the systemic velocity, while the south and east sides are redshifted by a similar amount. In the 310–315 km s-1 channel maps, a bright H I filament is visible within the shell interior, and this filament is spatially coincident with the surface of the bright ionized southeast rim of LMC 1. The channel maps also show a small shell to the southwest of LMC 1, corresponding to the H II complex N11.
To determine the expansion velocity and kinematic structure of LMC 1, we use P-V diagrams along the north-south and east-west cuts passing through the shell center (see Fig. 1). In the north-south P-V diagram, we see irregular expansion with a maximum velocity offset of 15 km s-1 on the receding side of LMC 1, but detect no counterpart on the approaching side. The east-west P-V diagram shows a more complex velocity structure. It shows a similar irregular expansion on the receding side, but within the central region there is an additional broad component near the systemic velocity. The spatial distribution of this turbulent, low-velocity material can be seen in the channel maps near the systemic velocity.
LMC 1 appears to be a real, physical shell, corresponding to the ionized inner wall of the H I shell SGS 3. The H I shell appears to be one-sided, with irregular expansion of 15 km s-1. The OB association LH15 stretches from the southeast rim of LMC 1 northeast into its interior, and is responsible for the ionization of the shell. The supernovae and fast stellar winds from this OB association are most likely responsible for the kinematic structure of the H I shell. A blow-out in the approaching side of LMC 1 must have occurred, as indicated by a lack of H I at blueshifted velocities within the central cavity. Blow-outs prevent the build-up of hot gas and thermal pressure in shell interiors. Without a hot pressurized surrounding, supernova remnant shocks are less likely to be thermalized; instead, they may advance outwards, impact the shell walls, and accelerate interstellar gas only locally. This explains LMC 1’s irregular expansion and accelerated material at peculiar velocities.
4.2 LMC 2
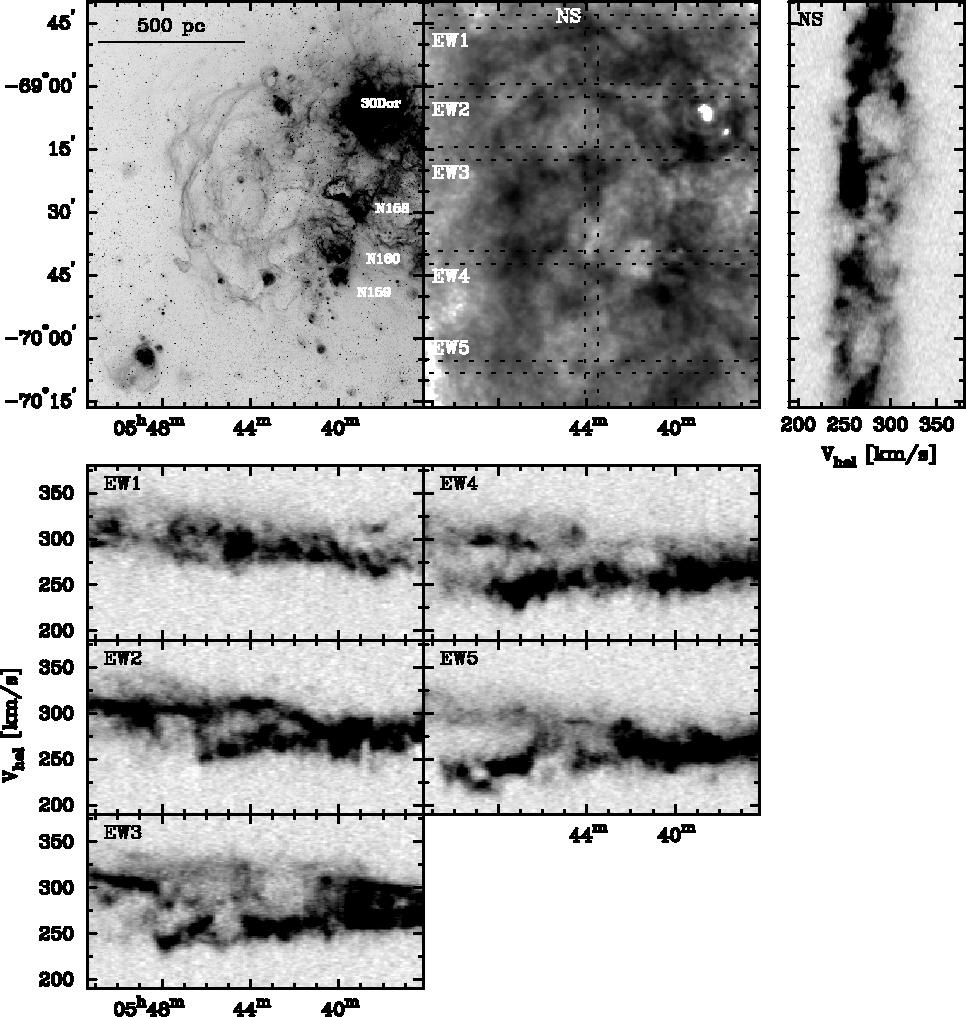
LMC 2 is a large structure on the southeast of the 30 Doradus Nebula, with central coordinates 5h44m, 69∘20′ (J2000) and a diameter of 900 pc (see Fig. 3). It is the brightest SGS in the LMC in H. The shell consists of a set of long H filaments along its northern, eastern and southern edges, and a ridge of active star formation regions on its western edge, including N158, N159, and N160. Many studies have been made on the structure and kinematics of LMC 2, some finding the existence of a three-dimensional expanding structure (Caulet et al., 1982) and others concluding that the ionized gas is confined between two sheets of H I gas and expands only eastward (Points et al., 1999). Diffuse X-ray emission has been detected from the interior of LMC 2, based on which Wang & Helfand (1991) concluded that the shell was blowing out of the disk.
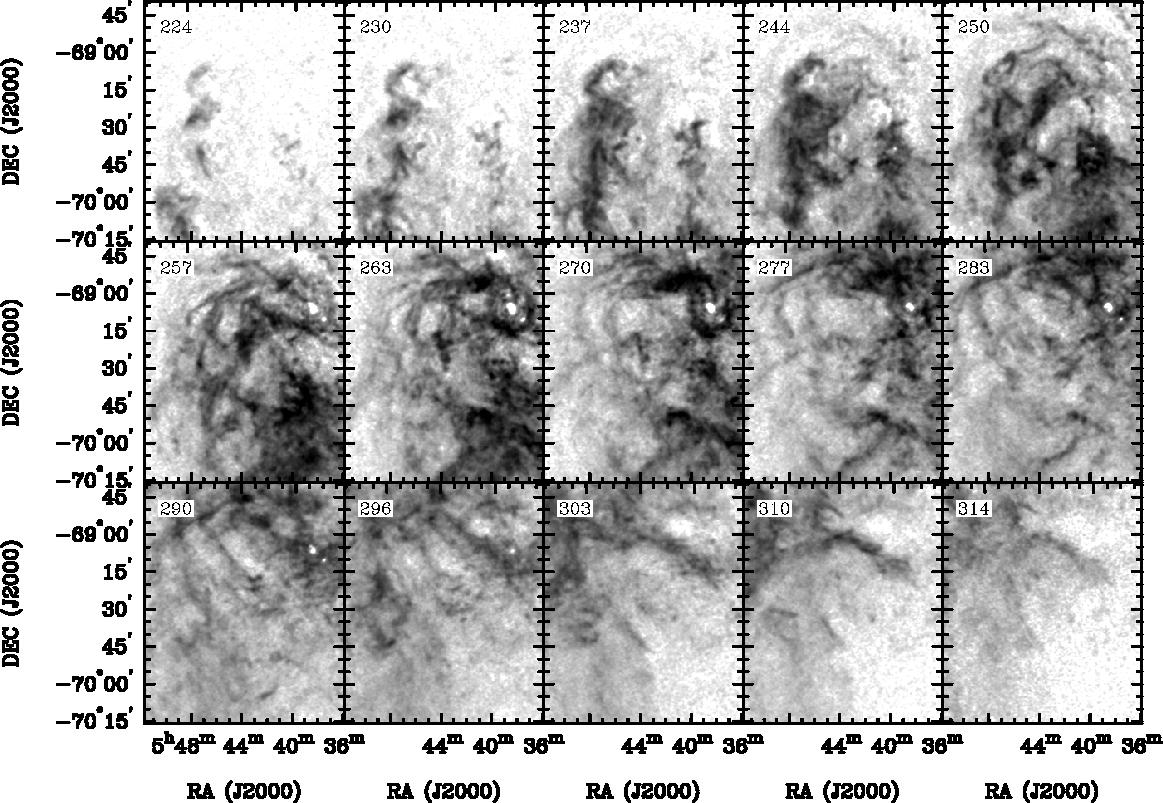
The H I column density map shows a very complex structure, both within LMC 2 and in the surrounding region. There is significant structure interior to LMC 2 both in H and H I images. Upon closer examination, H I enhancements often coincide with H enhancements in the form of filaments, H II regions, or diffuse emission. The H I image does not show a contiguous cavity throughout LMC 2, but rather several localized cavities. The channel maps confirm the general correspondence between H I enhancements and H filaments and the lack of a single central cavity within LMC 2 (figure 4 Points et al., 1999).
The physical structure of LMC 2 is best seen in P-V diagrams. The north-south P-V diagram passing through the center of LMC 2 (see Fig. 3 NS) shows an expanding shell consisting of the northern two-thirds of the optical shell, the southern boundary of which corresponds to a prominent curved east-west H filament. This expanding shell structure is justified because the H I gas converges to a single velocity component to the north and south, and the east-west P-V diagram through this region (see Fig. 3 EW2 and EW3) shows expansion and converges back to a single velocity component to the west. The southern third of LMC 2 shows a more complex structure, with a localized expanding cavity on the west (see Fig. 3 EW4 and EW5). To the south of LMC 2, the P-V diagrams still show an expanding shell structure (see Fig. 3 EW5 and NS), corresponding to a cavity in the H I column density map. It is not clear whether this cavity is an extension of LMC 2, since we do not see clear evidence for a wall between them.
We have made 20 east-west P-V diagrams in 5′ steps over LMC 2 and the surrounding region. Because of the large area covered, 7695′, we are able to see that the two H I sheets reported by Points et al. (1999) are part of an expanding structure. To the west, the two velocity components converge to 275 km s-1; to the east, they appear to diverge over the area of LMC 2 and beyond, but converge further to the east (see Fig. 3 EW2, EW3, EW4 and EW5).
We conclude that the optical SGS LMC 2 is not a simple expanding shell, but part of a more extended, complex H I expanding structure. On a large scale, the H I shows expansion over a region 1150 pc (N-S) 850 pc (E-W). Within this overall structure there are substructures, such as the two expanding structures we identified in the northern two-thirds of LMC 2 and to the south, which roughly correspond to the H I SGS 19 and 20, respectively.
4.3 LMC 3
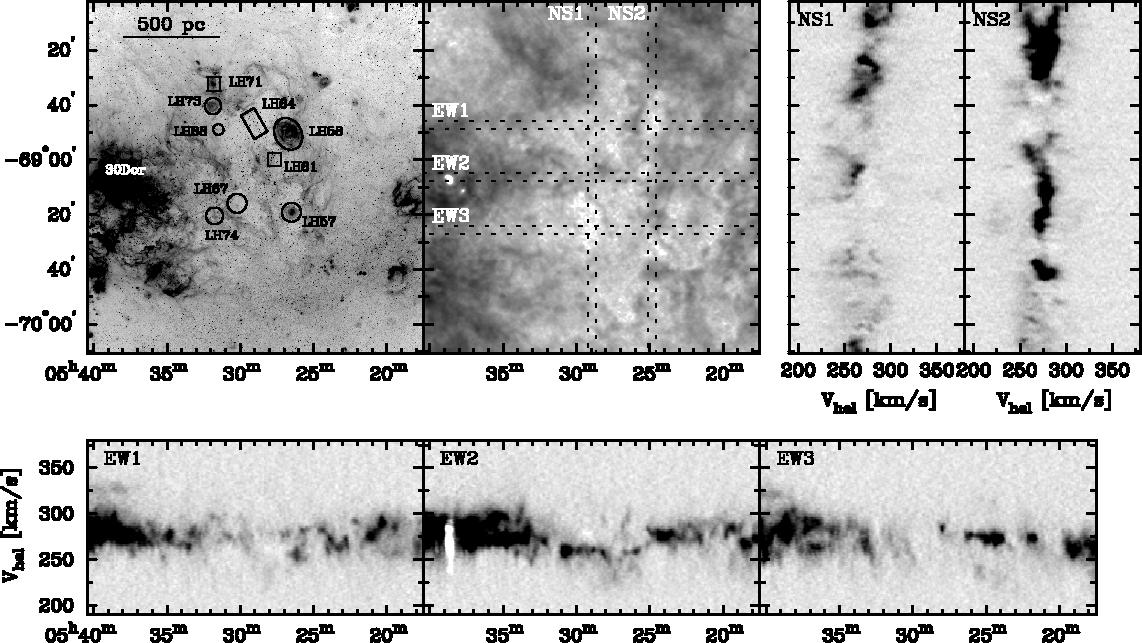
LMC 3 is located just to the northwest of the 30 Doradus complex, opposite of LMC 2. It is composed of several curved, interconnecting H filaments, forming a four-lobed shape with central coordinates 5h30m, 69∘00′ (J2000) and a diameter of 1 kpc (see Fig. 5). LMC 3 has a ‘waist’ dividing it into northern and southern lobes, and the region across the waist shows significant internal H and H I structure. The ionized shell lies on the interior of an H I structure along its northern lobes, although the southern ionized filaments lie along much less dense regions of neutral gas, which are nearly invisible in the H I column density image. The neutral shell extends significantly further to the south than the optical shell.
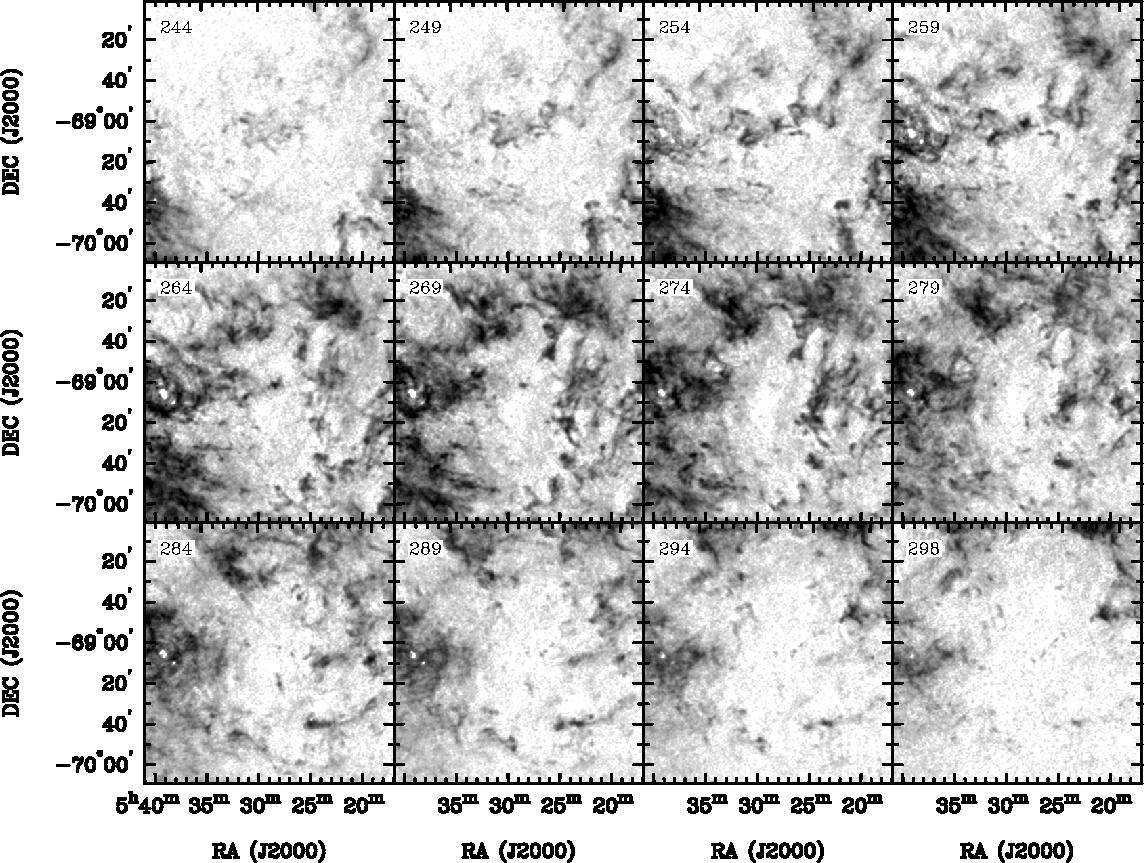
LMC 3 can be detected in channel maps (Fig. 6) in the range 255 km s-1 to 285 km s-1, with a systemic velocity of 270 km s-1. Faint H I structures along the southern border of the optical shell can be seen mostly at systemic and redshifted velocities. The wall between the two southern lobes, for example, appears clearly at 285 km s-1, redshifted by 15 km s-1 with respect to the shell’s systemic velocity. The structure along the waist of LMC 3 is seen in channel maps to be a broad filament stretching from east to west, blueshifted by 15 km s-1 with respect to the systemic velocity. A smaller additional shell structure to the west of the northern lobes of LMC 3 is clearly visible in channel maps. At velocities of 260 km s-1 and less the structure appears distinct from LMC 3, but appears connected at higher velocities.
We made two N-S and three E-W P-V diagrams passing through LMC 3. The E-W P-V diagram along the waist indicates blueshifted expansion at a rate of 15 km s-1 (see Fig. 5 EW2), corresponding to the blueshifted filament noted from the channel maps. This cut also shows significant highly blueshifted material, with velocities as low as 210 km s-1, i.e., with an expansion velocity of up to 60 km s-1 relative to the systemic velocity. This material is also observed in N-S P-V diagrams (see Fig. 5 NS1), and can be identified with the 220 to 230 km s-1 interstellar absorption components seen in the UV spectra of stars within LMC 3 (Chu et al., 1994). The E-W cut through the northern lobes shows evidence of expansion (see Fig. 5 EW1), while the cut through the southern lobes shows only tenuous indications of expansion (see Fig. 5 EW3). The northern P-V diagram does, however, show possible expansion of the smaller western shell, also at a rate of 15 km s-1 but with a lower systematic velocity of 260 km s-1. In this image the smaller shell appears unconnected to LMC 3. The N-S P-V diagrams also show evidence of two-sided expansion for the northern lobes (see Fig. 5 NS1) and the smaller western shell (see Fig. 5 NS2).
We conclude that LMC 3 is a physical shell with irregular shape and expansion pattern, whose H I shell extends significantly beyond the optical shell toward the south. The OB associations show a correlation between their ages and locations in the LMC 3 region. Older OB associations, that have already blown away their surrounding gas, are located in the interior of the shell and may be responsible for its irregular expansion pattern: LH67 in the southeast, LH61 along the waist, LH64 in the northwest, and LH68 in the northeast. Younger OB associations, that are still within dense H II regions, lie along the rim of the optical shell: LH58 near the waist on the western side, LH73 and LH71 in the northeast, and LH57 in the southwest. The exception to this rule is the older association LH74, which is located along the southeastern rim of LMC 3. We find LMC 3 to be the ionized interior of the H I shell SGS 12, whose greater southern extent may be explained as the result of the combined supernova explosions and fast stellar winds from the older OB associations LH74 and LH67 in the southeast of the optical shell. The northern lobes, which are significantly brighter in H I, are identified as a separate shell SGS 13, but we conclude that the northern and southern lobes are connected to form a single, while irregular, shell. Further, the smaller western shell we identified in channel maps and P-V diagrams is associated with SGS 8, although it has no optical counterpart.
4.4 LMC 4
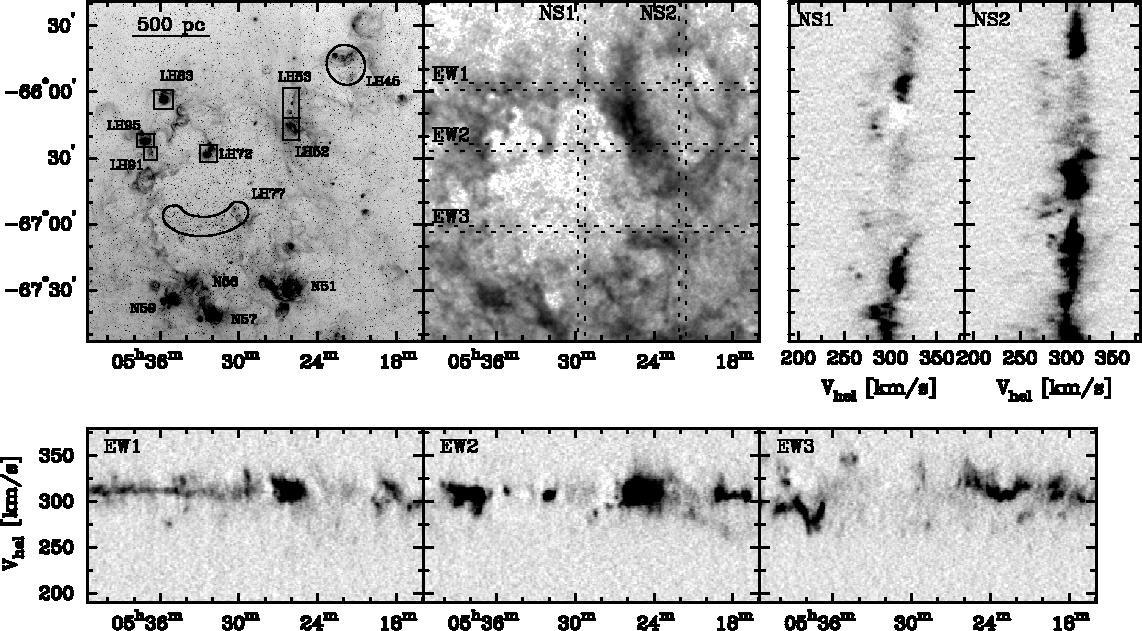
LMC 4 is the largest SGS in the LMC, and is located on the northern edge of the galaxy. It is roughly circular in shape, with central coordinates 5h32m, 66∘40′ (J2000) and a diameter of 1 kpc (see Fig. 7). One notable feature of LMC 4 is a filament of neutral and ionized hydrogen extending into the interior from the north and terminating in the OB association LH72. The optical shell LMC 4 lies along the interior of a larger H I shell. The density of the neutral shell structure is greater than that of the surrounding regions. The densest part of the neutral shell is the region to the northwest which forms the border between LMC 4 and 5.
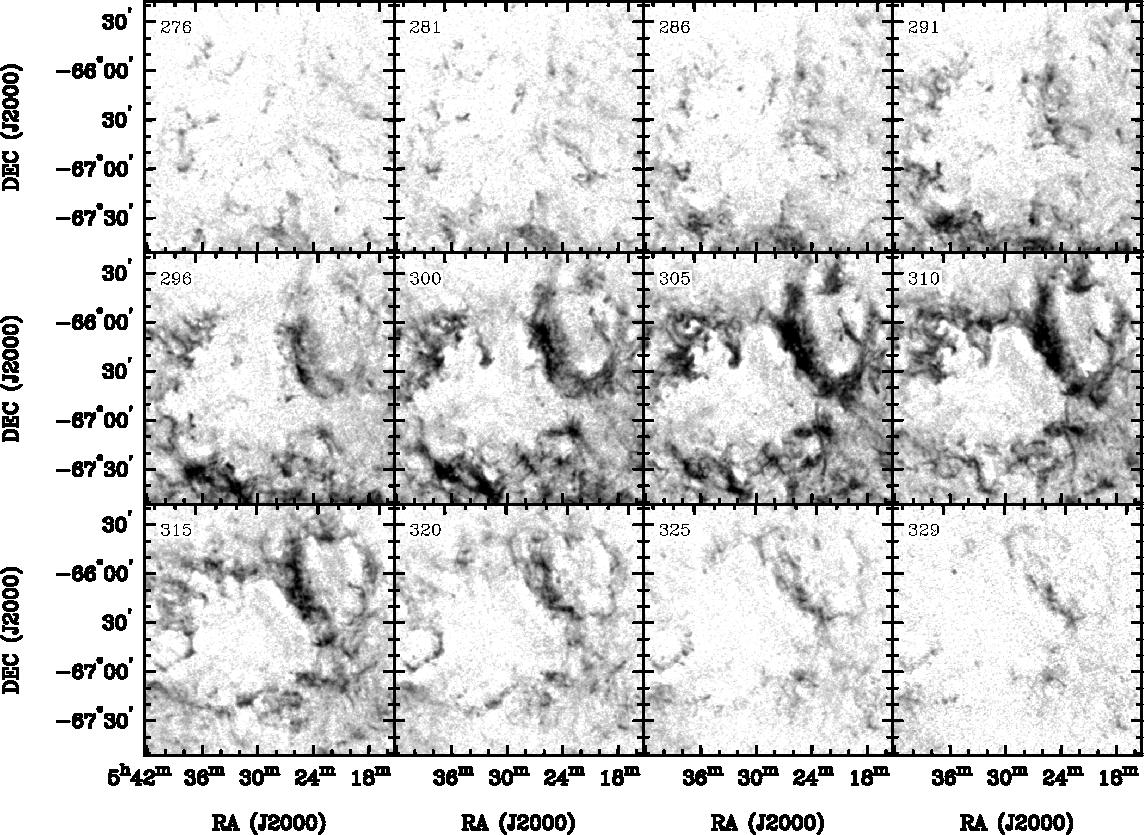
LMC 4 can be seen in channel maps (Fig. 8) in the range 285 km s-1 to 325 km s-1, with a systemic velocity of 305 km s-1. The southern and eastern edges of the shell are blueshifted 10 km s-1 with respect to the systematic velocity, while the northern and western edges are redshifted by a similar amount. The northwestern corner is the interaction region with LMC 5, and is visible in a wide velocity range, also slightly redshifted with respect to the range in which the rest of LMC 4 can be seen. We have made three E-W and one N-S P-V diagram passing through LMC 4 (see Fig. 7 EW1, EW2, EW3 and NS1). None of these diagrams show evidence of uniform expansion. The shell cavity is mostly evacuated, with the interior material present in small clouds with velocities blueshifted by up to 40 km s-1 with respect to the systemic velocity.
We observe that LMC 4 is a physical shell due to its central cavity and raised density in the rim. LMC 4 is the ionized inner wall of the H I identified SGS 11. The northeastern corner of this structure has been identified as SGS 14; however, the P-V diagram through this structure shows clouds only at the systemic velocity, and channel maps show that this structure is part of SGS 11. Within the central cavity, the most prominent OB association is LH77, also known as Shapley Constellation III, a large arc of stars in the southern shell interior. This association has an older stellar population, as it has already expelled its ambient gas, and has most likely contributed to the formation of LMC 4. Along the periphery of LMC 4 are several young OB associations still within H II regions. These include LH91, LH95, and LH83 in the northeast, LH52 and LH53 in the northwest along the interaction region with LMC 5, and the numerous OB associations in the H II complexes N51, N56, N57 and N59 extending southward from the southern rim of LMC 4. The age structure of these OB associations has been interpreted as triggered star formation (Elmegreen, 1998).
4.5 LMC 5
LMC 5 has a diameter of 800 pc, and is located directly to the northwest of LMC 4 in the north of the LMC with central coordinates 5h22m, 66∘00′ (J2000) (see Fig. 7). H filaments delineate LMC 5, with brighter filaments in the northwest and east as compared with the dimmer northeast and southwest optical filaments. Two distinct H filaments are observed interior to the shell. As in LMC 4, a shell of H I with nearly the same shape as the optical shell surrounds LMC 5, with a higher density in the neutral shell than in the surrounding regions. The densest part of the neutral shell around LMC 5 is the interaction region with LMC 4. Both interior filaments apparent in H are also present in the H I image.
LMC 5 can be seen in channel maps (Fig. 8) in the range 290 km s-1 to 325 km s-1, with a systemic velocity of 305 km s-1. There is no significant velocity gradient over the H I shell, and the interior structures are mostly seen around the shell’s systemic velocity.
We have made one E-W and one N-S P-V diagram passing through LMC 5 (see Fig. 7 EW1 and NS2), from which we find possible evidence of expansion (see Fig. 7). In the N-S P-V diagram, several blueshifted clouds are visible along the shell, which appear to connect to each other and to converge back to the systematic velocity at the southern edge of the shell. The E-W P-V diagram shows a similar convergence at the western edge, and indicates blueshifted expansion with a velocity of at least 50 km s-1. The receding side of LMC 5, however, is expanding at only 10 – 20 km s-1.
We conclude that LMC 5 is a physical expanding shell, although its approaching and receding sides are quite faint. We have determined that LMC 5 is the illuminated interior of H I-identified SGS 7. The OB associations LH45 in the northwest corner and LH52 and LH53 along the eastern edge explain the relative brightness of these areas in H as compared with the other sides. It has been suggested that the formation of LH52 and LH53 was caused by the compression of gas between LMC 4 and LMC 5 (Cohen et al., 2003).
4.6 LMC 6
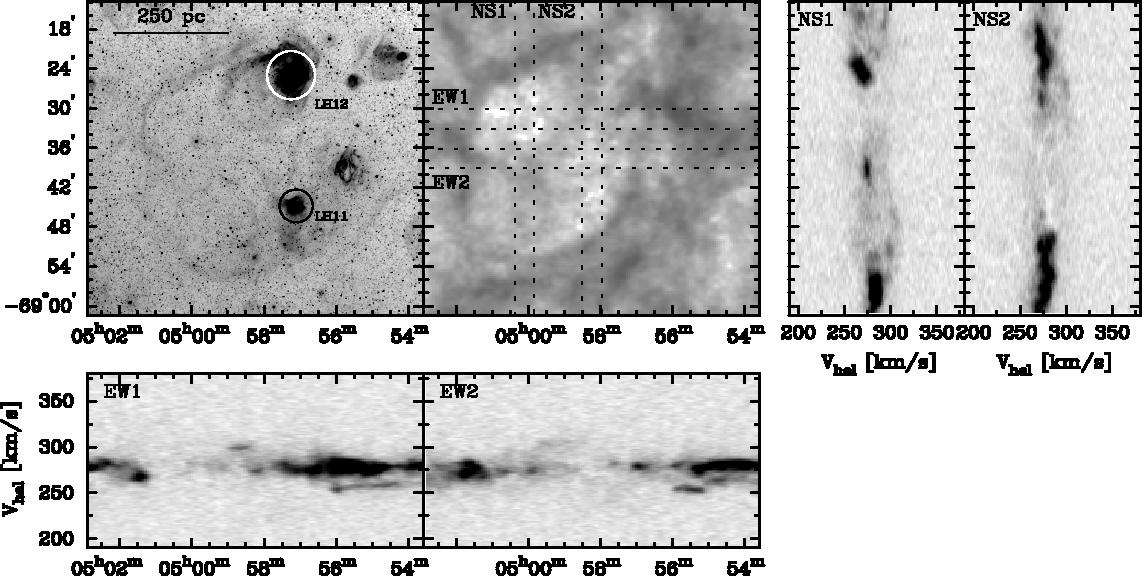
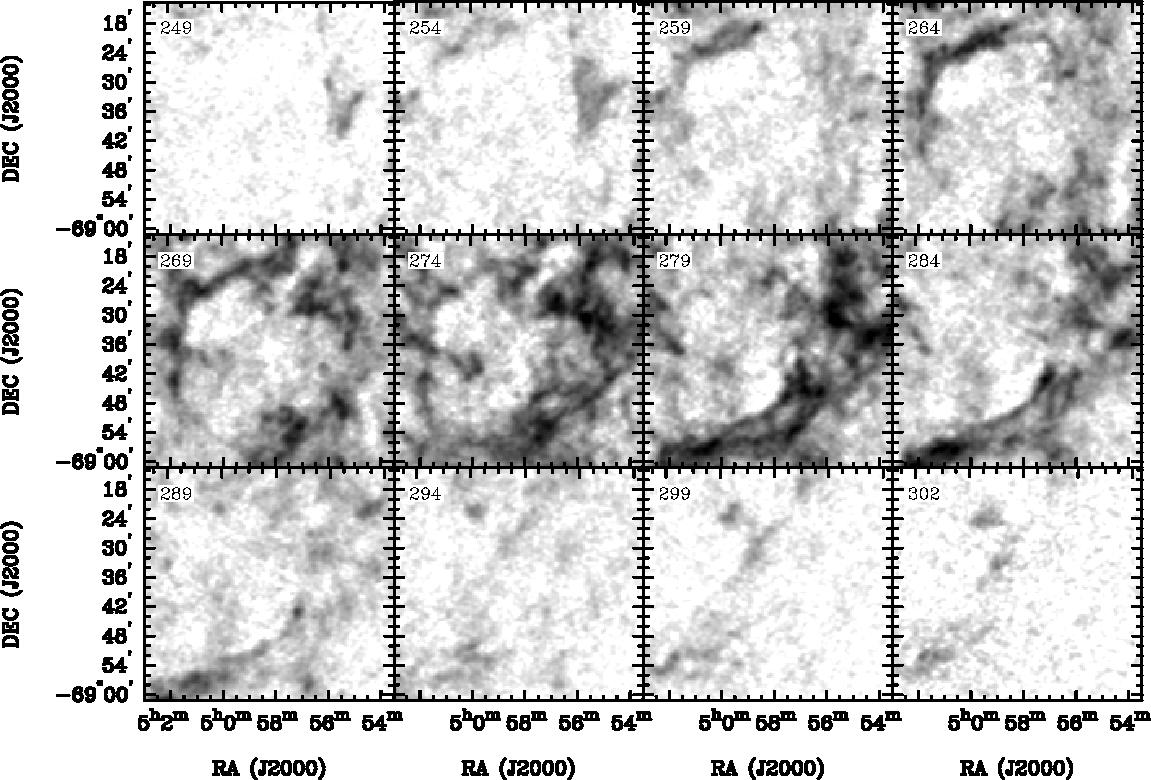
LMC 6 is a small, oblong shell with a radius of 600 pc in H, located in the southwest of the LMC with central coordinates 4h59m, 68∘36′ (J2000)(see Fig. 9). The OB association LH12, in the northeast corner of LMC 6, is in a bright, large H II region N91, from which tails of ionized gas arc to the east. The OB association LH11 is located south of LH12 and just below the southern edge of LMC 6. The shell is delineated by long ionized filaments stretching along its circumference. Meaburn (1980) considered only the ionized filaments, and not LH12, to make up LMC 6, and thus showed it as an ellipse open to the northwest. These H filaments lie along the interior of a fairly simple and well defined H I shell. The neutral shell has a dense rim, while the region of LH12 corresponds to an H I hole. There is some H I structure interior to the shell, running northeast to the southwest and from the east to the center.
LMC 6 is detected in channel maps (Fig. 10) in the range 260 km s-1 to 290 km s-1, with a systematic velocity of 275 km s-1. The northeast shell rim is blueshifted with respect to the systematic velocity by 10 km s-1, and the southeast shell rim is redshifted by a similar amount. The channel maps show that the H I structure interior to LMC 6 consists of two distinct filaments, one extending to the center of the shell from the eastern wall at the systemic velocity, and one stretching from northwest to southeast and redshifted 25 km s-1 with respect to the systemic velocity.
We have made two N-S and two E-W P-V diagrams passing through LMC 6 (see Fig. 9). The E-W diagrams both show possible expansion, with the receding side corresponding to the highly redshifted filament observed in the channel maps. We interpret this structure to indicate expansion rather than the chance superposition of this high-velocity filament over LMC 6 because the high-velocity gas appears to converge to the lower velocity gas at the rims of the shell. To the west of LMC 6, a region of blueshifted gas is observed which may or may not be connected to the rim of the shell. The N-S P-V diagrams show similar indications of expansion, while like the E-W diagrams they show that both approaching and receding sides of LMC 6 are quite rarefied. We measure typical expansion velocities of 20 km s-1, with some material moving at up to 40 km s-1 with respect to the systemic velocity. The eastern N-S P-V diagram (see Fig. 9 NS1) shows the dense filament at the systemic velocity within LMC 6.
These findings lead us to believe that LMC 6 is a physical, expanding shell, and that the ionized shell is the illuminated interior of a larger H I shell corresponding to the H I-identified SGS 2. The neutral shell appears to have an irregular two-sided expansion with a rate ranging between 20 and 40 km s-1.
4.7 LMC 7
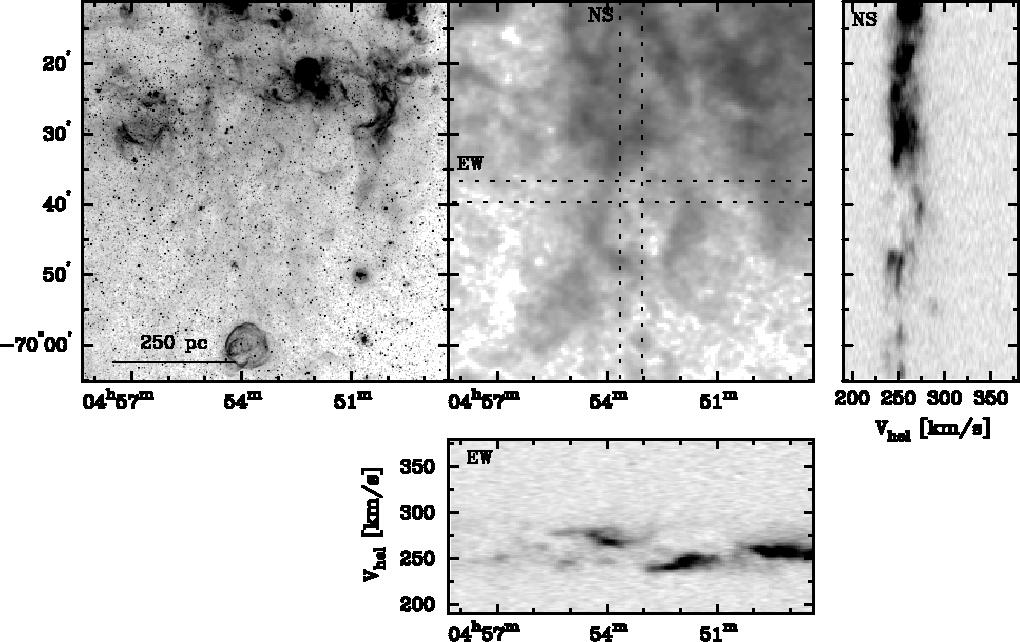
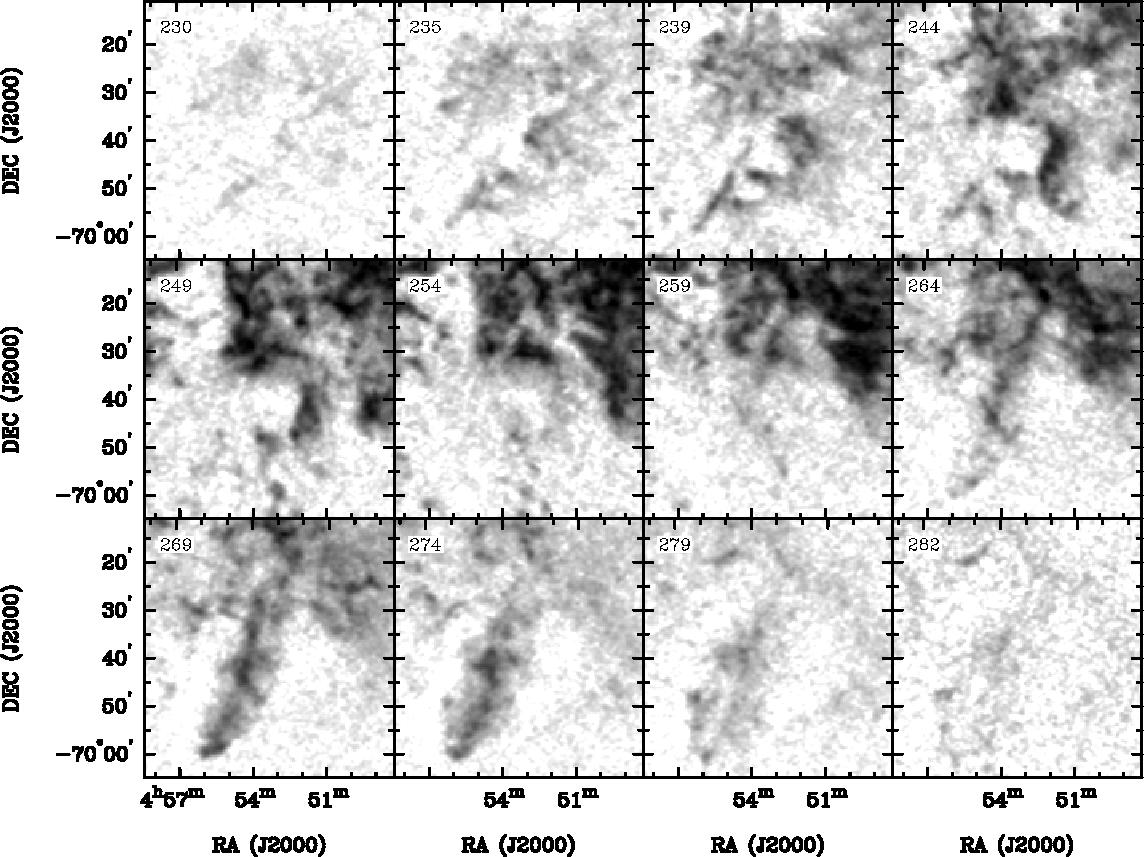
LMC 7 is suggested by Meaburn (1980) to be a possible shell open to the south with diameter 800 pc and center at 4h53m, 69∘35′ (J2000) (see Fig. 11). The H image of this region shows a dense ridge of ionized gas along the north, with faint interior structure which was interpreted to comprise a shell. The interior of LMC 7 contains many filaments and clouds of diffuse emission. Inspection of the H I image reveals little evidence for a shell corresponding to LMC 7. The northern rim of ionized gas corresponds to a similarly dense region of H I, but also apparent is a ridge of H I extending from the north through the center of LMC 7. Neutral hydrogen data does, however, indicate the existence of a 225 pc diameter shell located directly south of SGS 7 with center at 4h53m, 69∘45′ (J2000). There is no H emission associated with this structure.
Channel maps (Fig. 12) show no shell walls and central cavity for LMC 7. The smaller southern shell is shown to have a systemic velocity of 245 km s-1, and can be seen in the range 235 km s-1 to 260 km s-1. The ridge of gas passing through the center of LMC 7 is seen to be a redshifted structure at =275 km s-1. N-S and E-W P-V diagrams passing through the center of the smaller shell show an expansion velocity of 20 km s-1 from the bright emission, and up to 40 km s-1 from the faint emission on the receding side (see Fig. 11). An expansion velocity of 30 km s-1 is measured on the approaching side.
We conclude that LMC 7 is not a physical shell due to lack of visible H I shell structure or expansion. However, we note that a smaller H I shell with no optical counterpart and clear signs of expansion is located just to the south of LMC 7. Neither LMC 7 nor the smaller southern shell was identified by Kim et al. (1999), although 3-4 small H I shells along the northern rim were cataloged.
4.8 LMC 8
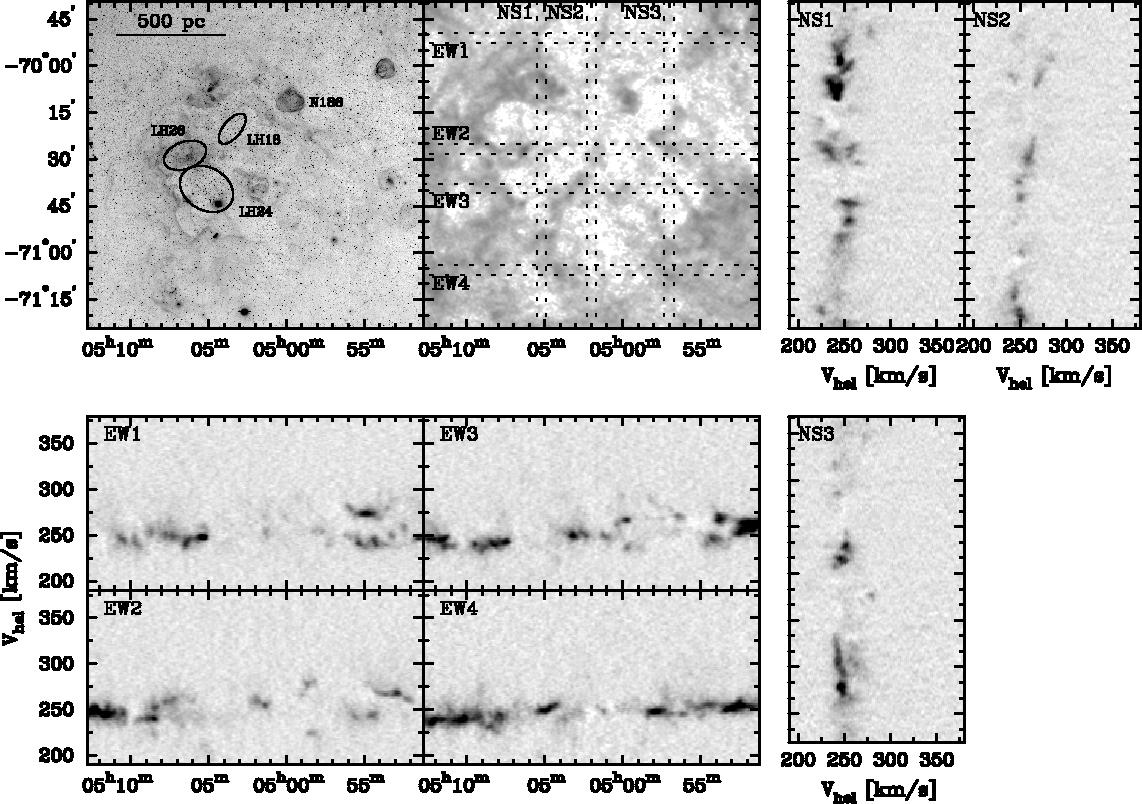
LMC 8 is a 900 pc diameter shell open to the southwest and located in the southwestern corner of the LMC, with central coordinates 5h03m, 70∘30′ (J2000) (see Fig. 13). The H structure is by no means a clean shell, consisting of filaments to the southeast and northwest, with significant amounts of internal diffuse emission in the east of the shell. The H I structure is significantly more complex, with a multi-lobed, ‘flower’ shape. The eastern lobe appears to have H emission interior to the neutral hydrogen, while the other lobes do not have obvious optical counterparts. Some H I filaments and clouds have optical counterparts; for example, an isolated spot of H I between the northern and northwestern lobes corresponds to the superbubble N186 (=DEM L50; Rosado et al., 1990; Oey et al., 2002).
LMC 8 is detected in H I channel maps (Fig. 14) between 225 km s-1 and 270 km s-1. The systemic velocity of the overall structure is 245 km s-1. The lobes of LMC 8 appear to be several interlocking shells with somewhat different systemic velocities. The northern lobe has a systemic velocity of 250 km s-1 and center located at 5h03m, 69∘50′ (J2000). The northeastern and eastern lobes have systemic velocities of 240 km s-1 and 250 km s-1, and centers located at 5h06m, 70∘20′ (J2000) and 5h06m, 70∘35′ (J2000), respectively. The southern and southwestern lobes have systemic velocities of 250 km s-1 and 240 km s-1, and centers located at 5h02m, 71∘00′ (J2000) and 4h58m, 70∘30′ (J2000), respectively. The channel maps show that the interiors of these separately expanding lobes are connected at 245 km s-1.
We have made 3 N-S and 4 E-W P-V diagrams to survey the expansion of the lobes of LMC 8. The cut NS1 (see Fig. 13) reveals that the eastern and northeastern lobes are expanding at a rate of up to 35 km s-1, and NS2 shows that the northern lobes are expanding at up to 30 km s-1 while the southern lobes have no distinct expansion. NS3 shows possible one-sided, redshifted expansion at a rate of up to 30 km s-1 for the southwestern lobe.
The E-W P-V diagrams give further information about the expansion structure of LMC 8. They reveal that the northern lobe extends much further to the west than is apparent in the column density image (see Fig. 13 EW1). The northern center of LMC 8 shows highly blueshifted material down to 200 km s-1 (see Fig. 13 EW2). The western lobes show a complicated expansion pattern with at least two distinct systemic velocities (see Fig. 13 EW3 and EW4).
We conclude that LMC 8 is comprised of several physical, expanding shells that are connected. The optical shell is associated with the H I-identified SGS 4, but covers only the eastern portion of the neutral shell. The shape of the optical shell may be explained by the positions of the OB associations LH26, LH18 and LH24 in the north and east of LMC 8, thus illuminating only the northern and eastern walls of the neutral shell and creating the optical appearance of a shell open to the southwest.
4.9 LMC 9
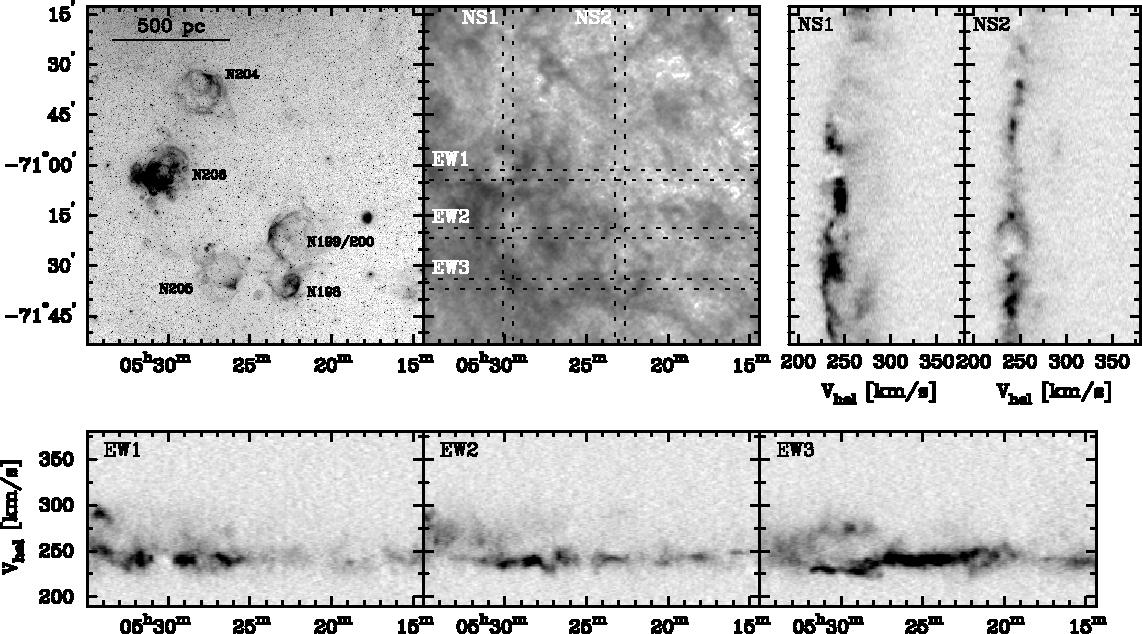
The optical shell LMC 9 is located in the southern part of the LMC, with central coordinates 5h25m, 71∘05′ (J2000) and diameter 890 pc (see Fig. 15). It is a collection of supershells situated in a semi-circle: N199/200, N198, N205, N206 and N204, from west to northeast along the periphery, connected with faint filaments and open to the northwest (Meaburn, 1980). The H I data shows generally higher column density toward the southeast quadrant of LMC 9. The supershells and their connecting filaments along LMC 9 have no corresponding H I shell rim, but rather H I holes near each of the supershells.
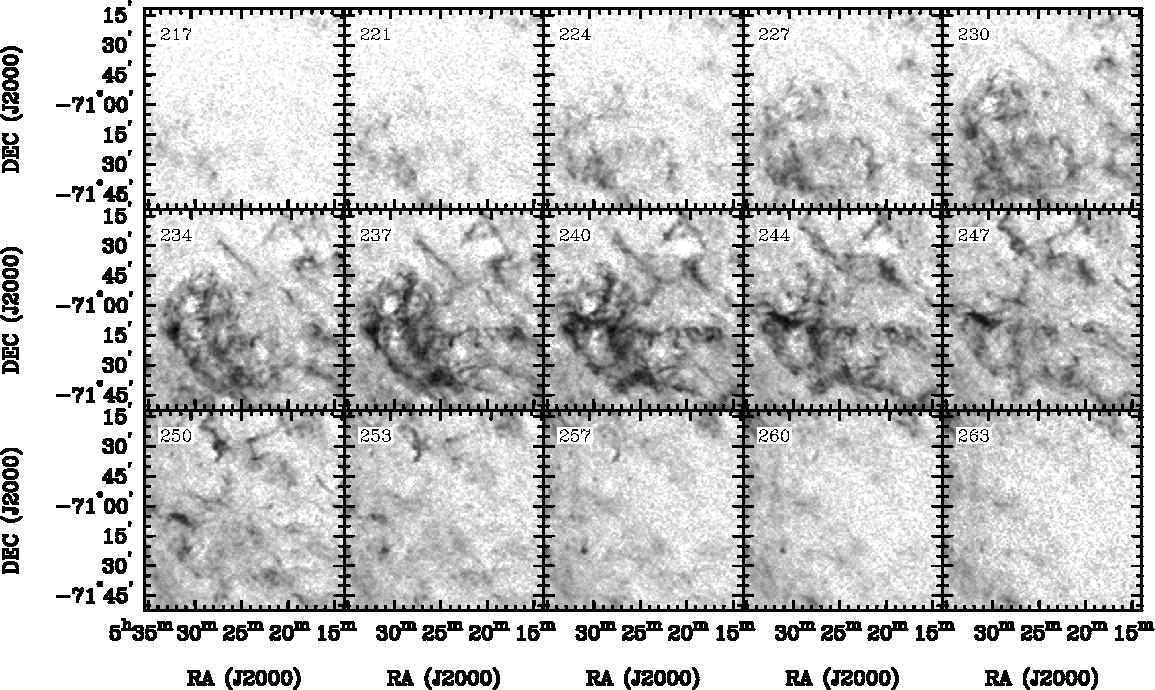
The region of SGS 9 is seen in channel maps (Fig. 16) to be full of H I diffuse emission and filaments, with no distinct central cavity. Several smaller cavities can be seen, at least two of which correspond to individual supershells: the supershell N206 whose H I cavity is detected in the range 225 km s-1 to 245 km s-1, and the supershell N199/200 whose H I cavity is detected in the range 225 km s-1 and 250 km s-1. Also visible is an oblong cavity to the southeast centered at 5h30m, 71∘20′ (J2000), which is detected in the range 230 km s-1 to 250 km s-1 but has no optical counterpart.
We have made two N-S and three E-W P-V diagrams in the LMC 9 region to investigate its expansion structure. The P-V diagrams indicate expansion of the southwest supershell (encompassing N198 and N199/200) at a rate of up to 20 km s-1 (see Fig. 15 EW2, EW3 and NS2), as well as possible expansion of the southeast oblong cavity at a rate of up to 20 km s-1 (see Fig. 15 EW2 and NS1). The most clearly expanding area in the LMC 9 region, however, is a region in the southeast corner of our frame, outside the boundary of LMC 9, where no cavity is visible in the H or H I column density maps. This expanding structure, centered at 5h32m, 71∘35′ (J2000), has an expansion velocity of up to 40 km s-1 (see Fig. 15 EW3 and NS1).
While Kim et al. (1999) identified the H I shell SGS 9 as the counterpart of LMC 9, we conclude that LMC 9 is not a physical, coherent shell since it has no well-defined H I counterpart or expansion pattern. Some of the supershells along the periphery of LMC 9 appear to be expanding shells.
5 Discussion
Comparison of neutral and ionized hydrogen images has allowed us to gain an understanding of the structure and kinematics of the optically identified SGSs. We have determined that these shells can be separated into three categories:
-
•
Simple Coherent Shells: These are neutral shells whose inner walls are photoionized. While the stars in the interior of the SGSs are responsible for the expanding structure, most of the ionizing sources are distributed along the periphery. Of the optically identified LMC SGSs, LMC 1, 4, 5 and 6 fall within this category.
-
•
Complex Shells: These are structures in which the ionized shell delineates only part of a larger or more complex neutral shell. The complex shells include LMC 2, 3 and 8. In the cases of LMC 2 and LMC 3, the optical shell illuminates only the northern portion of an larger neutral structure, while the single optically identified shell LMC 8 appears to contain multiple expanding neutral structures, of which only the eastern part is associated with ionized gas.
-
•
False Shells: These are those optically identified structures whose neutral H I counterpart does not show any of the following characteristics to indicate a shell structure: (1) expansion within the shell boundary, as expected from an expanding shell; (2) raised column densities along shell rims at the systemic velocity, showing a shell morphology; and (3) central cavity at the systemic velocity, or for an H I hole. A physical shell, even if it has been stalled, can still be recognized by the latter two characteristics. We found no evidence in neutral hydrogen to confirm the shell structure of LMC 7 and LMC 9, and characterize them as false shells. LMC 7 lacked any corroborating H I structure, while the optically identified shell LMC 9 was seen to be a chance superposition of ionized filaments and OB associations, with a neutral hydrogen structure in no way indicating a shell.
The nature of the optically identified SGSs can be understood as the result of the interplay between OB associations and the ISM. The fast stellar winds and supernova explosions from OB associations clear away the interstellar gas and form a large expanding shell structure. The initial OB associations will lose their ionizing power after 12 Myr, the lifetime of a 15 star, the least massive star whose UV flux still produces detectable H II gas. The recombination timescale of ionized gas is yr, where is the electron density in cm-3. The interstellar gas density in a SGS is most likely in the range of 0.1–1 cm-3, and the recombination timescale is much less than 1 Myr. Thus, a SGS with no new OB associations will cease to be observable in H soon after 12 Myrs, and only an H I shell will be detected.
A summary of the diameters (), average expansion velocities (), and maximum expansion velocities () of the optically identified SGSs in the LMC is given in Table 1. We estimate their ages from these data using the formula , where is 0.4 for a momentum-conserving bubble (Steigman et al., 1975), and 0.6 for an energy-conserving bubble (Castor et al., 1975; Weaver et al., 1977). We adopt an intermediate value . Examining the ages derived in Table 1, we find that all but one, SGS 8, are less than 12 Myr old. SGS 8, however, contains the OB associations LH18, LH24 and LH26 (see section 4.8), of which LH24 and LH26 are still young enough to contain H II gas. Those that are younger than 12 Myr all have young OB associations along their peripheries. These young OB associations explain the presence of an optical counterpart to this H I shell, regardless of their ages.
Of the H I-identified SGSs (Kim et al., 1999), 15 have average diameters 600 pc, the threshold used for the optical SGSs: SGS 1, 3, 4, 5, 6, 7, 9, 10, 11, 12, 17, 18, 19, 20, and 23. Some of these H I-identified SGSs are associated with the H-identified SGSs: SGS 3 with LMC 1, SGS 4 with LMC 8, SGS 7 with LMC 5, SGS 9 with LMC 9, SGS 11 with LMC 4, SGS 12 with LMC 3, and SGS 19 and 20 with LMC 2. As described in §4 and discussed earlier in this section, the H-identified SGSs may correspond to partial or complete walls of H I-identified SGSs, depending on the distribution of OB associations that provide ionizing fluxes. Among the other H I SGSs that are not associated with H shells, SGS 1 and 6 do not contain any OB associations, and hence have no ionized counterparts; SGS 5 and 23 have no OB associations or H II regions along the most well-defined shell rims; SGS 10 and 18 do not show obvious shell structures in either column density or channel maps, so they may not be physical shells; SGS 17’s northern rim is coincident with a long H arc that is likely to be ionized by massive stars in the 30 Doradus complex in the south (the H arc is sketched in dashes in Fig. 1 of Meaburn, 1980). These comparisons adequately illustrate the importance of the presence of young OB associations to photoionize the gas in H I SGSs to produce H-identified shell morphology.
Supergiant shells have been identified in distant galaxies based on H images (e.g., Hunter & Gallagher, 1997; Martin, 1998). However, from our analysis of the LMC H SGSs, it is clear that the H morphology alone is not sufficient to identify physically expanding shells and that the H SGSs represent only the SGS population that possess young OB associations. High-resolution H I position-velocity datacubes are needed to verify the shells’ structure and to reveal the entire population of SGSs.
6 Summary
Supergiant shells are the largest interstellar structures in galaxies. They can puncture the gas disk and vent hot gas into the halo, or may induce further star formation in the disk as they expand. Therefore, they play a very important role in the global structure and evolution of the ISM. We have chosen to study SGSs in the LMC because of its proximity, nearly face-on orientation, and small extinction.
Nine SGSs with diameters 600 pc have been identified in the LMC based on H images, and twenty-three SGSs with diameters 360 pc have been reported based on H I 21-cm line observations. Fifteen of these twenty-three have sizes 600 pc, of which eight are associated with H identified shells. Clearly, these sets do not always identify the same structures.
We have examined the physical structure of the optically identified SGSs using MCELS H images and ATCA+Parkes H I channel maps and P-V diagrams to analyze the gas distribution and kinematics.
Of the nine optically identified SGSs, seven appear to be true shells, where four are the ionized inner walls of H I SGSs and three are an ionized portion of a larger and more complex H I structure. All of the H SGSs have OB association along the periphery or in the center, with younger OB associations more often found along the periphery. After roughly 12 Myrs, if no new OB associations have been formed a SGS will cease to be identifiable at visible wavelengths. Thus, to be identified in optical wavelengths, a SGS must have recent star formation along its periphery. Based on our analysis, H observations alone cannot unambiguously identify SGSs, especially in distant galaxies. High resolution H I observations are needed to reveal the real population of SGSs.
References
- Castor et al. (1975) Castor, J., McCray, R., & Weaver, R. 1975, ApJ, 200, L107
- Caulet et al. (1982) Caulet, A., Deharveng, L., Georgelin, Y. M., & Georgelin, Y. P. 1982, A&A, 110, 185
- Chu et al. (1994) Chu, Y.-H., Wakker, B., Mac Low, M.-M., & Garcia-Segura, G. 1994, AJ, 108, 1696
- Cohen et al. (2003) Cohen, M., Staveley-Smith, L., & Green, A. 2003, MNRAS, 340, 275
- Davies et al. (1976) Davies, R. D., Elliott, K. H., & Meaburn, J. 1976, MmRAS, 81, 89
- Elmegreen (1998) Elmegreen, B. G. 1998, in ASP Conf. Ser. 148: Origins, ed. C. E. Woodward, J. M. Shull, & H. A. Thronson, Jr., 150–+
- Goudis & Meaburn (1978) Goudis, C. & Meaburn, J. 1978, A&A, 68, 189
- Henize (1956) Henize, K. G. 1956, ApJS, 2, 315
- Hunter & Gallagher (1997) Hunter, D. A. & Gallagher, III, J. S. 1997, ApJ, 475, 65
- Kim et al. (1999) Kim, S., Dopita, M. A., Staveley-Smith, L., & Bessell, M. S. 1999, AJ, 118, 2797
- Kim et al. (1998) Kim, S., Staveley-Smith, L., Dopita, M. A., Freeman, K. C., Sault, R. J., Kesteven, M. J., & McConnell, D. 1998, ApJ, 503, 674
- Kim et al. (2003) Kim, S., Staveley-Smith, L., Dopita, M. A., Sault, R. J., Freeman, K. C., Lee, Y., & Chu, Y.-H. 2003, ApJS, 148, 473
- Lucke & Hodge (1970) Lucke, P. B. & Hodge, P. W. 1970, AJ, 75, 171
- Martin (1998) Martin, C. L. 1998, ApJ, 506, 222
- McCray & Snow (1979) McCray, R. & Snow, Jr., T. P. 1979, ARA&A, 17, 213
- Meaburn (1980) Meaburn, J. 1980, MNRAS, 192, 365
- Oey et al. (2002) Oey, M. S., Groves, B., Staveley-Smith, L., & Smith, R. C. 2002, AJ, 123, 255
- Points et al. (1999) Points, S. D., Chu, Y. H., Kim, S., Smith, R. C., Snowden, S. L., Brandner, W., & Gruendl, R. A. 1999, ApJ, 518, 298
- Rosado et al. (1990) Rosado, M., Laval, A., Boulesteix, J., Georgelin, Y. P., Greve, A., Marcelin, M., Le Coarer, E., & Viale, A. 1990, A&A, 238, 315
- Smith et al. (2005) Smith, R. C., Points, S., Chu, Y.-H., Winkler, P. F., Leiton, R., & MCELS Team. 2005, in Bulletin of the American Astronomical Society, Vol. 37, Bulletin of the American Astronomical Society, 1403–+
- Smith & The MCELS Team (1999) Smith, R. C. & The MCELS Team. 1999, in IAU Symp. 190: New Views of the Magellanic Clouds, ed. Y.-H. Chu, N. Suntzeff, J. Hesser, & D. Bohlender, 28–+
- Steigman et al. (1975) Steigman, G., Strittmatter, P. A., & Williams, R. E. 1975, ApJ, 198, 575
- Wang & Helfand (1991) Wang, Q. & Helfand, D. J. 1991, ApJ, 379, 327
- Weaver et al. (1977) Weaver, R., McCray, R., Castor, J., Shapiro, P., & Moore, R. 1977, ApJ, 218, 377
| LMC SGS | Center (J200) | Diameter [pc] | [km s-1] | [km s-1] | Age [Myrs] |
|---|---|---|---|---|---|
| LMC 1 | 5h00m, 65∘40′ | 750 | 15 | 25 (red) | 11.7 |
| LMC 2 | 5h44m, 69∘20′ | 900 | 25 | 40 | 9 |
| LMC 3 | 5h30m, 69∘00′ | 1000 | 25 | 40 (blue) | 10 |
| LMC 4 | 5h32m, 66∘40′ | 1000 | - | - | - |
| LMC 5 | 5h22m, 66∘00′ | 800 | 30 | 50 | 6.7 |
| LMC 6 | 4h59m, 68∘36′ | 600 | 20 | 40 | 5 |
| LMC 7 | 4h54m, 69∘33′ | 800 | - | - | - |
| LMC 8 | 5h04m, 70∘30′ | 900 | 15 | 40 | 15 |
| LMC 9 | 5h26m, 71∘00′ | 890 | - | - | - |
