The Fine-Structure of the Net-Circular Polarization in a Sunspot Penumbra
Abstract
We present novel evidence for a fine structure observed in the net-circular polarization (NCP) of a sunspot penumbra based on spectropolarimetric measurements utilizing the Zeeman sensitive Fe I 630.2 nm line. For the first time we detect a filamentary organized fine structure of the NCP on spatial scales that are similar to the inhomogeneities found in the penumbral flow field. We also observe an additional property of the visible NCP, a zero-crossing of the NCP in the outer parts of the center-side penumbra, which has not been recognized before. In order to interprete the observations we solve the radiative transfer equations for polarized light in a model penumbra with embedded magnetic flux tubes. We demonstrate that the observed zero-crossing of the NCP can be explained by an increased magnetic field strength inside magnetic flux tubes in the outer penumbra combined with a decreased magnetic field strength in the background field. Our results strongly support the concept of the uncombed penumbra.
1 Introduction
The asymmetry of the Stokes parameters with wavelength is a powerful diagnostic tool to probe the relation between flows and the magnetic field in the atmosphere of sunspots. Line asymmetries convey information about lateral (within one resolution element) and the line-of-sight (LOS) gradients and discontinuities of physical parameters. Since the first systematic characterization and interpretation of these asymmetries and their spatial distribution throughout a sunspot by Sánchez Almeida & Lites (1992, and references therein) the complementary improvements achieved in both observational techniques and theoretical modeling, have advanced our understanding of particularly the penumbral inhomogeneities. It is general consent that a combination of non-trivial magnetic field and flow topologies along the LOS are the cause of the observed penumbral Stokes asymmetries. A simple and instructive way to characterize the asymmetry of Stokes V profiles is through the net-circular polarization (NCP), defined as , where the integral is performed over one spectral line only. The sum of the NCP of individual lines than leads to the well-known broad-band circular polarization (BBCP) first noticed by Illing et al. (1974a, b). The appearance of the NCP is very distinct in the penumbra and shows a peculiar difference when between observations in the visible or in the near infrared wavelength region: in the visible at Fe I 630.2 nm the NCP maps tend to be symmetric about the disk center and sun center connection line (Sánchez Almeida & Lites, 1992; Westendorp Plaza et al., 2001; Müller et al., 2002) while infrared NCP maps at Fe I 1564.8 nm reveal an antisymmetric distribution (Schlichenmaier & Collados, 2002; Bellot Rubio et al., 2004). Schlichenmaier et al. (2002) and Müller et al. (2002) demonstrate that the uncombed penumbral atmosphere (Solanki & Montavon, 1993) mimicked by the moving tube model (Schlichenmaier et al., 1998) reproduces the azimuthal behavior of the NCP and, furthermore, convincingly show that the incisive discrepancy between the visible and the near infrared can be understood when the effects of anomalous dispersion (Landolfi & Landi degl’Innocenti, 1996) are included.
So far penumbral NCP maps of the Fe I 630.2 nm line have been only presented before by Sánchez Almeida & Lites (1992) (in form of a contour line map), Westendorp Plaza et al. (2001), Müller et al. (2002) and Müller et al. (2006). These maps visualize very well the symmetric behaviour of the NCP but lack the spatial resolution to reveal the presence of any potential fine structure.
In this Letter we focus on high-spatial resolution spectropolarimetric measurements of a sunspot to investigate inhomogeneities in the penumbral magnetic field and flow field. Instead of utilizing inversion techniques we calculate the NCP and line-of-sight (LOS) velocities and elaborate on the properties of the same. In order to interpret the observational results we use the 3D geometric flux tube model VTUBE (Müller et al., 2006) and perform subsequent radiative transfer calculations from which NCP and Doppler maps can be synthesized.
2 Observations and Data Reduction
The spectropolarimetric observations were obtained on 2005 June 30, with the Diffraction Limited Spectro-Polarimeter (DLSP, Sankarasubramanian et al., 2004) 222The DLSP was built in collaboration with the High-Altitude Observatory. located at the NSO Dunn Solar Telescope (DST), Sacramento Peak, New Mexico. The DLSP was operated in its high-resolution mode (00893 pixel-1 along the slit) and in conjunction with the high-order adaptive optics system (Rimmele, 2004). The slit width of 12 microns is matched to the detector image scale along the spectrograph slit. In spectral direction the instrument samples the solar spectrum from 630.0 nm to 630.4 nm with 2.1 pm pixel-1. A two-dimensional map was generated by moving the slit across the leading sunspot (positive polarity) of AR NOAA 10781 located at (corresponding to a viewing angle of 42∘) with a step size of 0089 covering a total field-of-view of 589 (660 steps). The slit was oriented along solar North-South and the scan direction of the DLSP was solar West-East. At each slit position 16 images of 30 ms exposure time each were accumulated for each of the four individual modulation states leading to a total integration time of 2 sec. A full map is accomplished within 56 min. The measurements are compensated for polarization effects caused by the telescope and the polarimeter following the calibration procedure developed by Skumanich et al. (1997). The very good seeing in conjunction with the high-order AO system led to exceptional stable observing conditions while scanning the solar image. We estimate our effective spatial resolution in the DLSP map to be about 04.
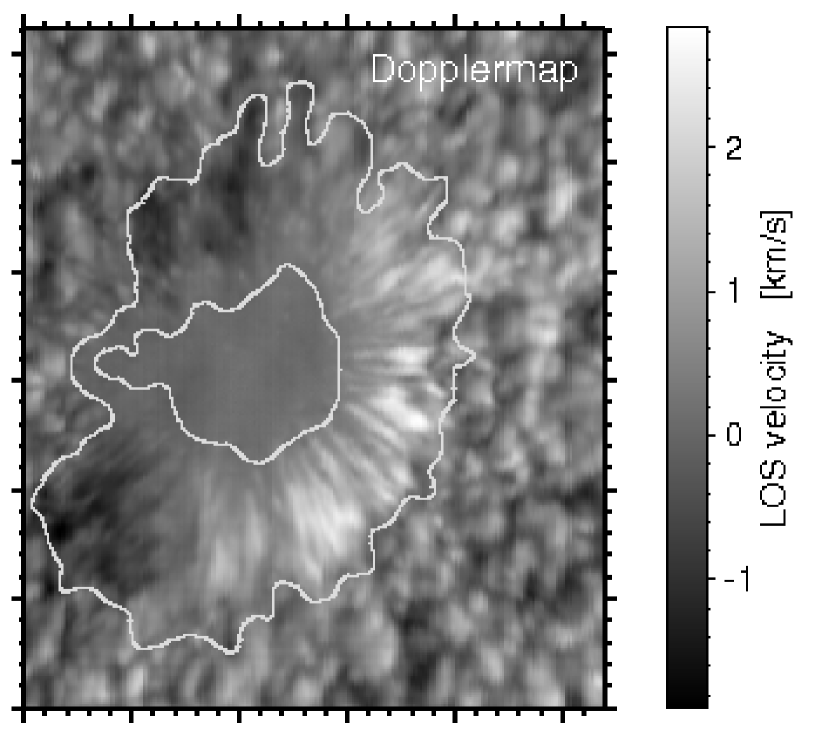
We calculate maps of the net circular polarization by integrating the Stokes signal over the Fe I 630.25 nm line. Because of its relatively minor contamination by one of the two telluric lines the Fe I 630.15 nm line is used to derive line-of-sight (LOS) Doppler velocities. We apply a Fourier phase method (Schmidt et al., 1999) to the and profile of the Fe I 630.15 nm line to calculate line shifts. An absolute velocity calibration is performed by taking advantage of the telluric O2 lines (see e.g. Martinez Pillet et al., 1997) present in the recorded spectrum. In contrast to the astrophysical convention we assign a negative sign to redshifts and a positive sign to blueshifts: dark areas in the Dopplergram move away from the observer, while bright areas move towards the observer.
3 Results
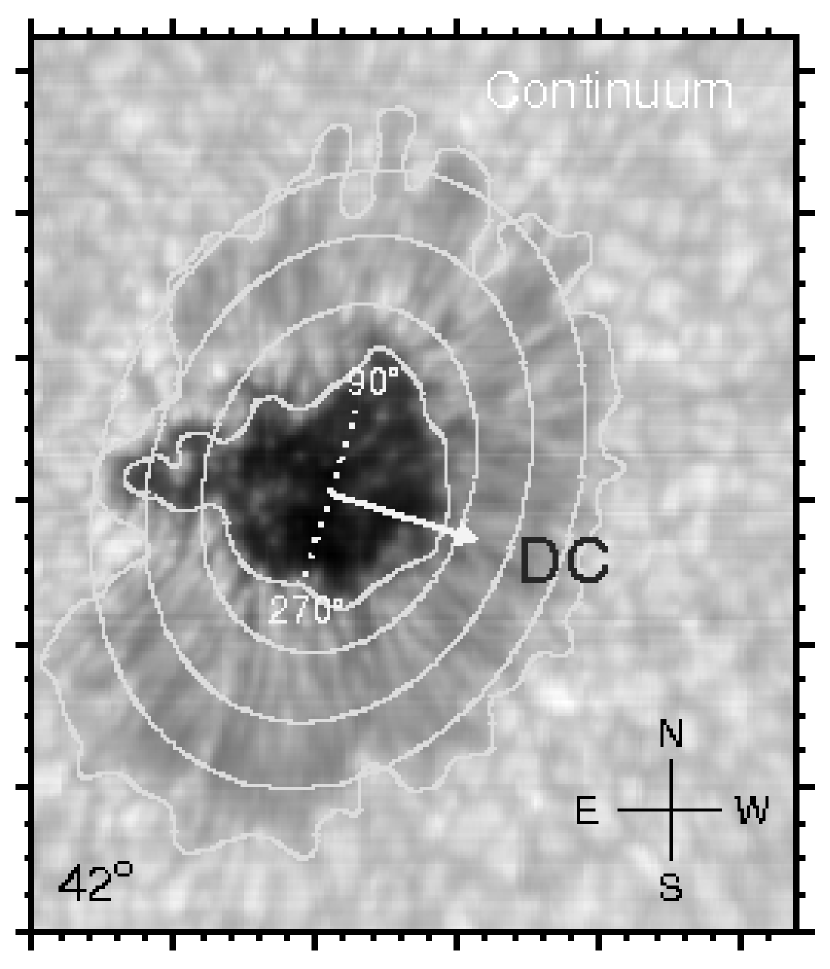
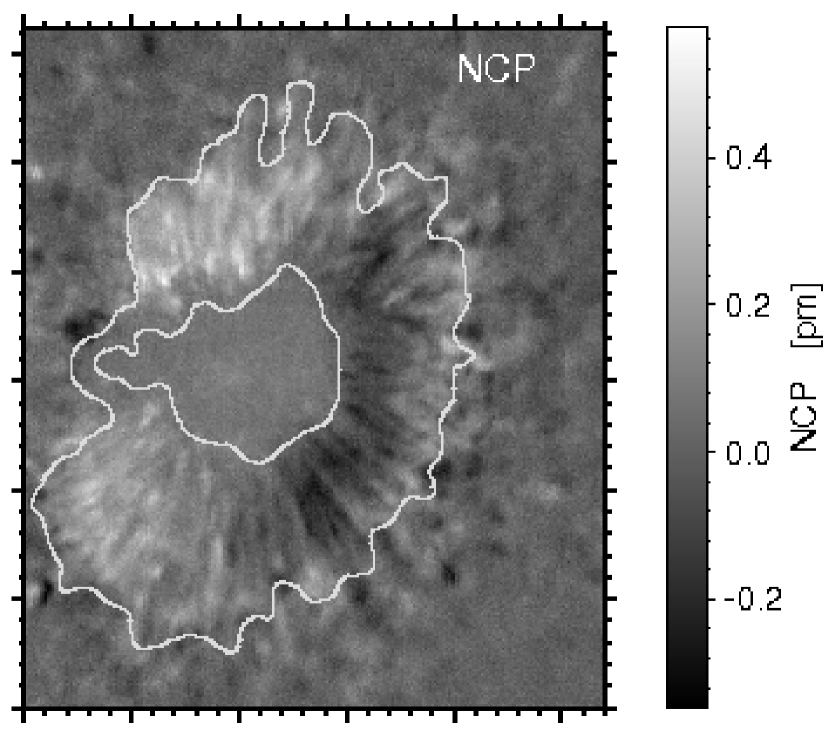
Well-reported properties of the penumbral NCP (see Sánchez Almeida & Lites, 1992; Solanki & Montavon, 1993) are the sign change along azimuthal cuts centered around the spot center and an increased magnitude on the limb side. Based on spectropolarimetric data with much higher spatial resolution than utilized before (Figure 1) we additionally find (a) evidence for a fine-structure in the NCP and (b) a sign-reversal of the NCP as a function of radial distance from the spot center on the center-side penumbra which has not been recognized before.
Confirming previous results we find that the NCP is symmetric in the inner and middle penumbra w.r.t. the line that connects the disk center with the spot center. The same property applies to the LOS velocity map which indicates an intricate coupling between penumbral flows and the sign of the NCP. This is corroborated by the fine structure we detect in the NCP.
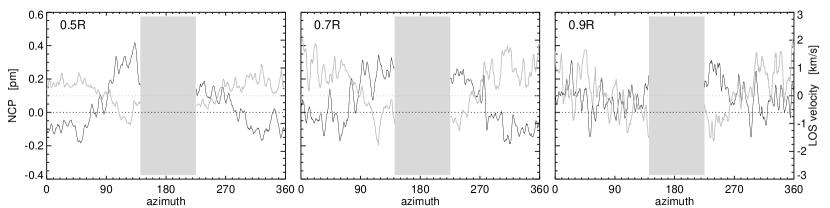
The spatial distribution of the NCP reveals filamentary organized inhomogeneities throughout the penumbra with very localized enhancements of elongated shape on a spatial scale of 03. Although we detect these enhancements with no preferred location inside the penumbra those with the largest value of the NCP appear on the limb-side penumbra in proximity to where the magnetogram (not shown) indicates an apparent neutral line. They are related to anomalous (multi-lobe) Stokes V profiles (see also Sánchez Almeida & Lites, 1992) and thus do not necessarily show up in the flow signal (Figure 1, right). Anomalously shaped Stokes V profiles indicate either spatially unresolved contributions to the resolution element or LOS effects of at least two differently inclined magnetic components with opposite polarity that are shifted w.r.t. each other and viewed upon under an oblique angle. The NCP on the center-side penumbra is correlated with normal 2-lobe antisymmetric Stokes V profiles. On smaller spatial scales related to the flow channels (Figure 1, right) that carry most of the Evershed flow we are unable to state conclusively that there is a good overall correlation between the NCP and the flow signatures. Figure 2 exemplifies this statement along three azimuthal cuts through the penumbra representative for three different radial distances from spot center (as indicated by the ellipses in Figure 1, left).
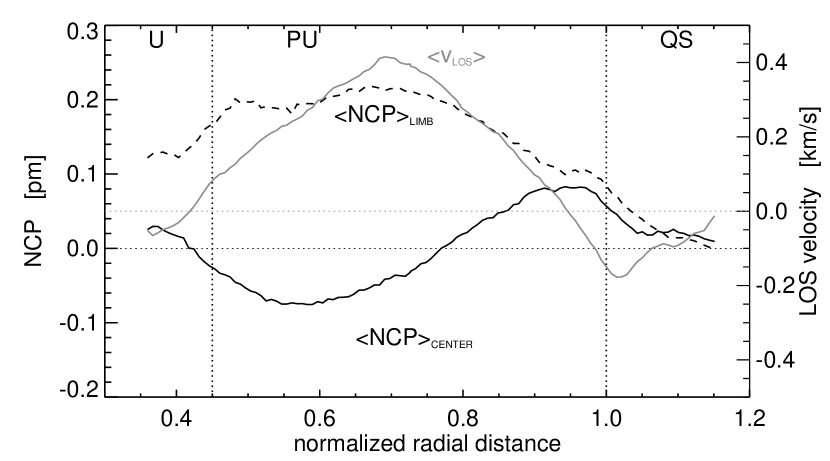
Furthermore, we detect for the first time a difference in the symmetry properties of the NCP observed between the outer limb- and center-side penumbra, namely a sign reversal of the NCP in the outer center-side penumbra. 333Beyond the penumbra crossing the visible boundary of the sunspot the NCP shows a motley behavior which we attribute to the presence of moving magnetic features that are known to show asymmetric Stokes profiles. We verify the visual impression of the NCP zero-crossing on the center-side penumbra in Figure 3 by means of the radial dependence of the NCP when averaged over the limb-side (90∘-270∘) and center-side penumbra (270∘-90∘) separately. The limb-side segment without penumbra does not contribute to the averaging.
A comparison of the two curves clearly demonstrates the differences between the NCP on the limb- and center-side penumbra in radial direction. On the limb side the NCP has one sign only throughout the penumbra while on the center side the NCP reverses its sign at a radial distance of 0.75, (where denotes the sunspots radius) peaks at 0.95 and then falls off outside the visible penumbra. It should be noted that the course of the radial variation of the NCP and the exact location of the zero-crossing point within the penumbra depends also on the calibration for instrumental polarization, i.e. predominantly the crosstalk from Stokes to . We estimate that our calibration for this particular crosstalk is better than 0.1 %. The NCP averaged over areas where we see no significant Stokes signal is in the range of 1.510-2 pm. Significant changes of the radial variation of the NCP, however, take place only if the residual crosstalk from to is in the range of 1 % and larger.
4 Model Calculations
In order to understand the observed sign reversal of the NCP, we have carried out radiative transfer calculations from which synthetic maps of observable quantities are obtained. At first sight, one may conjecture that the observed radial sign reversal of the NCP is caused by downflows in the outer penumbra. While this is indeed a possible solution that is compatible with the observed NCP maps, the Doppler maps constrain the details of the model atmosphere even further.
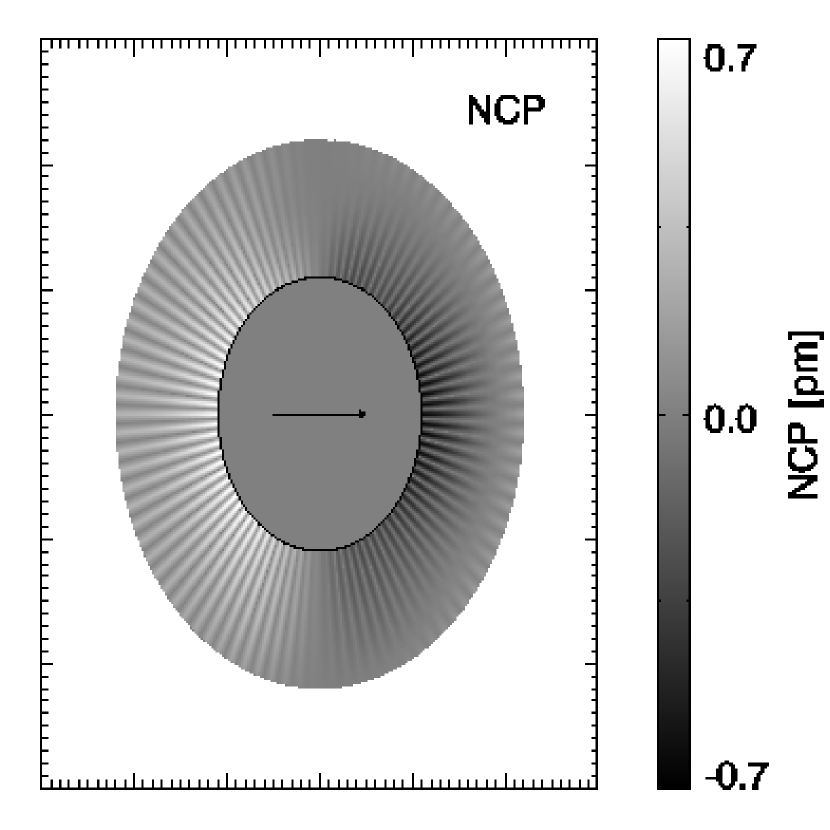
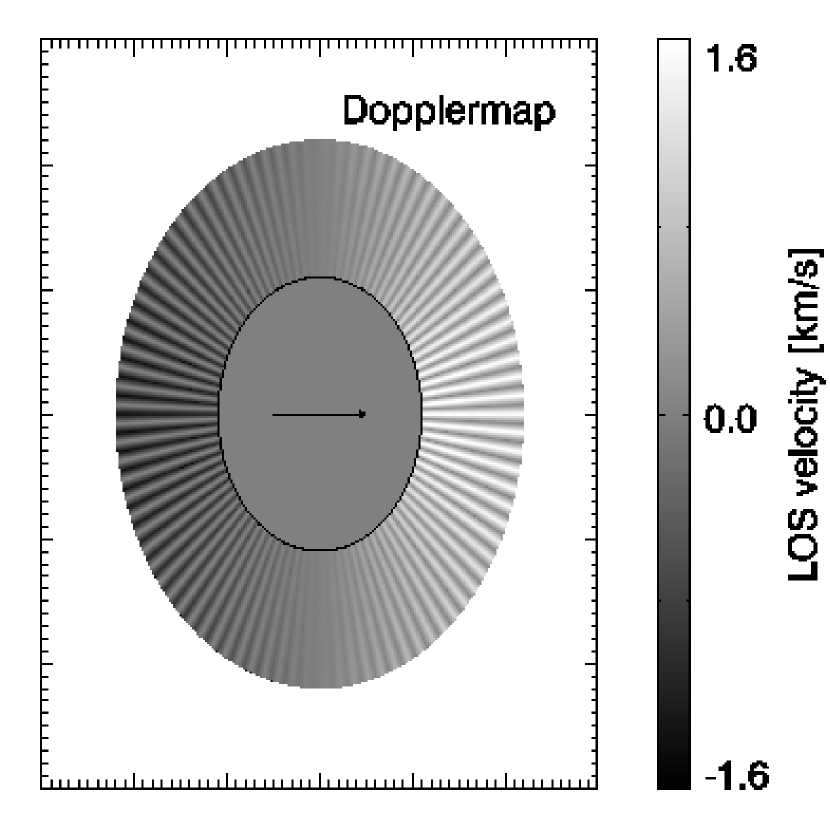
It turns out that a model atmosphere with strongly downwards inclined flux tubes in the outer penumbra is not able to explain simultaneously both the observed sign reversal of the NCP and the constant sign of the Doppler maps on the spot’s center side. However, we find that both features can be reproduced by magnetic flux tubes that have a magnetic field strength that is stronger than the background magnetic field in the outer penumbra while it is weaker in the inner part as visualized in Figure 4 (top left). The assumption is not unrealistic as two-component inversions of sunspots indicate a higher field strength in the tube component in the extreme outer penumbra (e.g. Bellot Rubio et al., 2004).
Figure 4 shows the synthetic NCP (middle) and Doppler (right) maps for a penumbral atmosphere, calculated with the VTUBE model of Müller et al. (2006). We adopt a very generic atmospheric configuration with horizontal magnetic flux tubes of 50 km radius with a flow velocity of 10 km/s, embedded in a radially symmetric background field as in Müller et al. (2006). We assume a magnetic field strength inside the flux tubes that increases linearly from the inner penumbra (where it is 500 G weaker than the background field) to the outer penumbra (where it is 500 G stronger than the background field). It turns out that this configuration is quite robust, and the details of the magnetic field strength affect primarily the radial location of the zero-crossing of the NCP. The axes of the flux tubes are placed at 30 km above . Raising the flux tubes mostly increases the absolute value of the NCP and would require a lower filling factor to explain the observed NCP values.
The effect of a jump in the magnetic field strength along the LOS on the NCP has been studied for a simpler atmospheric configuration by Landolfi & Landi degl’Innocenti (1996) who derived a sign rule for the NCP due to this so-called effect. This expression is proportional to the difference in the magnetic field strengths between the static background and the part of the atmosphere containing the flow. As a consequence the NCP changes sign when changes sign. When comparing this rule with both observational data and more realistic models, one should note that the effect is but one of several NCP generating effects at work. Therefore, the locations of the sign reversals of and the NCP do not necessarily coincide. In particular the sum of the effect and changes in the inclination ( effect) results in the different behaviour of the NCP on the limb and center side: on the limbside the NCP decreases with radial distance because of the increasing effect but does not change the sign because the effect contributes positive to the NCP. One should also bear in mind the assumptions on which the findings of Landolfi & Landi degl’Innocenti (1996) are based. A discussion of the results of Landolfi & Landi degl’Innocenti (1996) in the context of flux tubes in the penumbra is given by Müller (2001) and Müller et al. (2002).
Our model solution is in qualitative agreement with both the observed NCP and the observed LOS velocity. It should be pointed out though that while the simultaneous agreement between the NCP and Doppler maps places a strong constraint on the possible atmospheric models our solution may not necessarily be unique.
5 Discussion and Conclusions
In this paper, we have presented novel evidence for a spatial fine structure in the visible NCP of the Fe I 630.25 nm line. We find for the first time that the NCP is structured in radial filaments very much alike maps of other line parameters, e.g. the intensity, equivalent width and line width (see e.g. Johannesson, 1993; Rimmele, 1995a, b; Tritschler et al., 2004). The spatial scales of the NCP filaments are similar to those found in the observed LOS velocity map although we cannot find a good overall correlation between the signals of the NCP and the LOS velocity. We conjecture that higher spatial resolution is needed to settle this issue. Martinez Pillet (1997) find a correlation between the azimuthal variation of the NCP and the magnetic field inclination on angular scales of . Although we cannot provide information about the inclination at this point we find that our observations show azimuthal variations of the NCP that are only of the order of .
Furthermore, we have observed a zero-crossing of the NCP on the outer center-side penumbra and have demonstrated that this signature can be explained by an increased magnetic field strength inside magnetic flux tubes in the outer penumbra, while the magnetic field strength is decreased in the background field (-effect). To this end, we have compared high-resolution observations with maps of the NCP and the LOS velocity that have been synthesized from a 3D geometric sunspot model that has been coupled with a 1D radiative transfer code (see Müller et al., 2006, for details). We point out that the space of possible atmospheric models that can reproduce the observations is significantly constrained by taking into account the information contained in Doppler maps in addition to the NCP maps. This paper extends the work by Solanki & Montavon (1993), Martínez Pillet (2000), Müller et al. (2002), and Müller et al. (2006) and clearly demonstrates the need to model the ”uncombed” penumbra of sunspots in greater detail. This would include also taking into account the effect of field line curvature around flux tubes as considered by Borrero et al. (2007).
References
- Bellot Rubio et al. (2004) Bellot Rubio, L. R., Balthasar, H., & Collados, M. 2004, A&A, 427, 319
- Borrero et al. (2007) Borrero, J. M., Bellot Rubio, L. R., & Mueller, D. A. N. 2007, ArXiv e-prints, 707
- Illing et al. (1974a) Illing, R. M. E., Landman, D. A., & Mickey, D. L. 1974a, A&A, 35, 327
- Illing et al. (1974b) —. 1974b, A&A, 37, 97
- Johannesson (1993) Johannesson, A. 1993, A&A, 273, 633
- Landolfi & Landi degl’Innocenti (1996) Landolfi, M., & Landi degl’Innocenti, E. 1996, Sol. Phys., 164, 191
- Martinez Pillet (1997) Martinez Pillet, V. 1997, in ASP Conf. Ser. 118, Advances in Physics of Sunspots, ed. B. Schmieder, J. C. del Toro Iniesta, & M. Vazquez, 212
- Martínez Pillet (2000) Martínez Pillet, V. 2000, A&A, 361, 734
- Martinez Pillet et al. (1997) Martinez Pillet, V., Lites, B. W., & Skumanich, A. 1997, ApJ, 474, 810
- Müller (2001) Müller, D. 2001, Polarisation von Linien im Spektrum einer Sonnenfleckenpenumbra. Diploma Thesis, University of Freiburg
- Müller et al. (2006) Müller, D. A. N., Schlichenmaier, R., Fritz, G., & Beck, C. 2006, A&A, 460, 925
- Müller et al. (2002) Müller, D. A. N., Schlichenmaier, R., Steiner, O., & Stix, M. 2002, A&A, 393, 305
- Rimmele (1995a) Rimmele, T. R. 1995a, A&A, 298, 260
- Rimmele (1995b) —. 1995b, ApJ, 445, 511
- Rimmele (2004) —. 2004, ApJ, 604, 906
- Sánchez Almeida & Lites (1992) Sánchez Almeida, J., & Lites, B. W. 1992, ApJ, 398, 359
- Sankarasubramanian et al. (2004) Sankarasubramanian, K., Gullixson, C., Hegwer, S., Rimmele, T. R., Gregory, S., Spence, T., et al. 2004, Proceedings SPIE, 5171, 207-218
- Schlichenmaier & Collados (2002) Schlichenmaier, R., & Collados, M. 2002, A&A, 381, 668
- Schlichenmaier et al. (1998) Schlichenmaier, R., Jahn, K., & Schmidt, H. U. 1998, ApJ, 493, L121
- Schlichenmaier et al. (2002) Schlichenmaier, R., Müller, D. A. N., Steiner, O., & Stix, M. 2002, A&A, 381, L77
- Schmidt et al. (1999) Schmidt, W., Stix, M., & Wöhl, H. 1999, A&A, 346, 633
- Skumanich et al. (1997) Skumanich, A., Lites, B. W., Martinez Pillet, V., & Seagraves, P. 1997, ApJS, 110, 357
- Solanki & Montavon (1993) Solanki, S. K., & Montavon, C. A. P. 1993, A&A, 275, 283
- Tritschler et al. (2004) Tritschler, A., Schlichenmaier, R., Bellot Rubio, L. R., the KAOS Team, Berkefeld, T., & Schelenz, T. 2004, A&A, 415, 717
- Westendorp Plaza et al. (2001) Westendorp Plaza, C., del Toro Iniesta, J. C., Ruiz Cobo, B., Martínez Pillet, V., Lites, B. W., & Skumanich, A. 2001, ApJ, 547, 1130