D.V. Bugg111email address: D.Bugg@rl.ac.uk,
Queen Mary, University of London, London E1 4NS, UK
Abstract
A summary is given of the main sets of data requiring the existence of . Crystal Barrel data on contain a visible peak and require at least a contribution. This alone is sufficient to demonstrate its existence. More extensive data on at rest contain delicate interferences which determine the mass and width independently in and annihilation and agree within 5 MeV for both mass and width. The peak in is at MeV, but the rapid increase in phase space with mass displaces the peak to 1360 MeV. BES II data for contain a visible signal . In all cases, a resonant phase variation is required.
PACS: 13.25.Gv, 14.40.Gx, 13.40.Hq
The plays a vital role in the spectroscopy of light mesons. Several authors have questioned its existence, though these criticisms are based on fits to very limited sets of data. To answer those questions, the best available data have been refitted critically. Full details of the analysis are given in [1]. Here essential points are summarised.
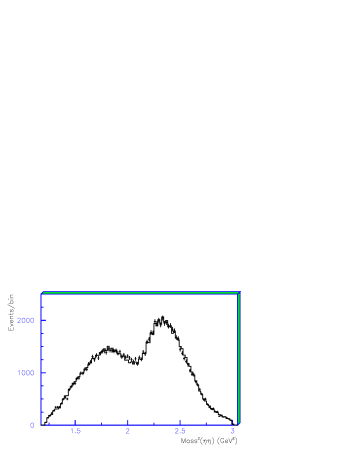
Crystal Barrel data on at rest in liquid and gaseous hydrogen show two clear peaks in at and MeV [2], see Fig. 1. The low mass peak cannot be due to , whose branching ratio to is very small. A fit without is worse by 19 standard deviations, because the peak at 1330 and the dip at 1430 MeV cannot be fitted by and alone. These data alone are sufficient to demonstrate the existence of .
The data which determine resonance parameters best are Crystal Barrel data on at rest in liquid and gaseous hydrogen [3]. There is a conspicuous signal at low mass due to the pole and high mass peaks due to and . The hides beneath the , but is clearly separated by angular analysis. Interferences between the three combinations determine the mass and width of in a very delicate way. The two sets of data allow a clean separation of annihilation from and initial states. The is at least a 32 standard deviation signal in and 33 standard deviations in .
The opening of the channel plays an important role. The phase space for and are shown in Fig. 2. Relative contributions are poorly known, so the fit to data finds the best compromise: a Fermi function going to 1 at high mass. Half-height is at GeV, and inelasticity is small at 1.3 GeV, ultimately the best mass.

The full form of the Breit-Wigner resonance formula,
| (1) |
contains a real dispersive term [4], which for the channel reads
| (2) |
The slope of near resonance is larger than . This point was not realised in earlier work. Nevertheless, a good solution emerges naturally. Loop diagrams for production of the system behave like vacuum polarisation and lead to strong renormalisation effects. In consequence, only the ratio of and widths is well determined: the absolute values can be varied through a wide range, leaving the line-shape almost unchanged.

Fig. 3 shows the essential points. The peak is at MeV and is cut off towards higher massese by the opening of the channel. The Breit-Wigner denominator is the same for data, but phase space displaces the peak upwards by MeV. This explains confusion in the Particle Data tables, where the mass is quoted as 1200–1500 MeV. One must distinguish between experiments fitting (a) two-body channels and (b) data. The centre of the peak at half-height is at 1390 MeV, in close agreement with extensive Crystal Barrel fits [5]. The three dashed curves above 1500 MeV illustrate uncertainty in .
A remarkable feature of the new analysis is shown in Fig. 3(c). Despite the strong dispersive effect of the channel, the amplitude follows a circle very closely. The left-hand side of the loop is suppressed by coupling to . The phase shift goes through at MeV, but the circle can be reproduced well with an effective mass of 1282 MeV and a constant width of MeV.

Fig. 4 displays the Argand diagram for the S-wave in . There are successive loops due to the pole, , and . The third loop is the crucial one identifying , or to give it a new and improved mass. An important test is to fit 40 MeV bins from 1100 to 1460 MeV freely in magnitude and phase. Real and imaginary parts of the amplitude move from the fitted curve only by of the radius of the loop, consistent with experimental errors. This shows that the loop is definitely required.
A vital point in the new analysis is the inclusion of . This cannot account for the loop, as illustated on Fig. 4(b). There is a loop near 1500 MeV due to this process, but it is higher and much wider than . A weakness of all current fits to data is the omission of the amplitude.
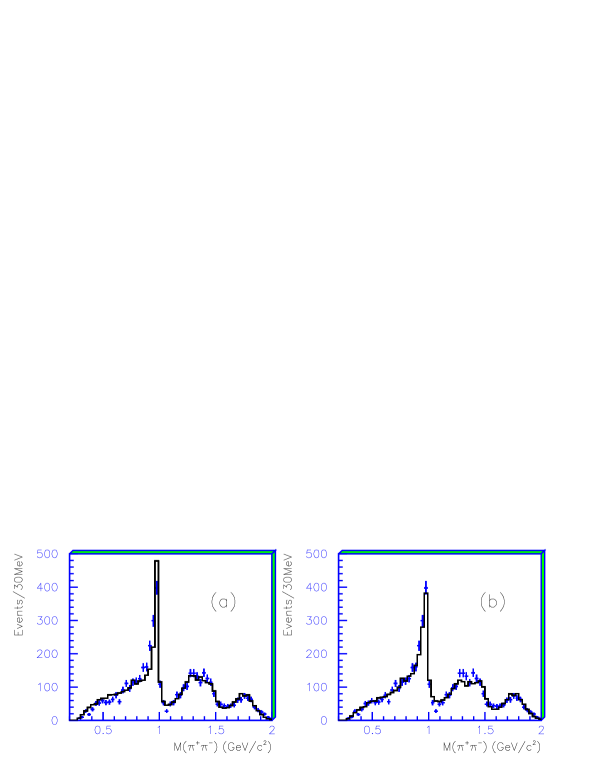
The and combine to produce a visible peak in BES data for [6]. That publication fitted the mass and width freely. These data have now been refitted using parameters fitted to the and data. The fit of Fig. 5(a) is acceptable. If the is removed, Fig. 5(b) shows the fit is visibly poor. Incidentally, the is well separated by angular analysis from in these data; the latter optimises with mass and width consistent with PDG values.
All the three sets of data discussed so far require a resonant phase variation for . If the resonance is replaced with a peak of the same line-shape but no phase variation (despite the fact that this is non-analytic), is significantly worse in every case.
The also appears in GAMS data for at large [7] and in central production of with parameters close to those found here [8]. Historically, it was first identified as in data from the Argonne and Brookhaven labs on [9]. That identification was not clear-cut because parameters of and were not known accurately at that time. Using modern values for those parameters, these early data are entirely consistent with those fitted here [10].
The new fit includes the BES data for [11] as an important constraint on the line-shape of the up to 1050 MeV; it is clearly visible by eye in the mass projection in those data. The phase shifts predicted by Caprini et al. [12] using the Roy equations are also included. The moments for Cern-Munich data on [13] are also refitted. Up to the threshold, these data determine phases with errors of . However, above the threshold, real and imaginary parts of the amplitude become very strongly correlated because differential cross sections alone do not separate magnitude and phase. The fit requires inclusion of some mixing between , and . The Argand diagram for the S-wave is shown in Fig. 6. There is a loop due to , crossing the Argand plot rapidly at 1230 MeV. The fit to Cern-Munich data gives MeV. The following branching ratios are also determined: , , .

In summary, the is definitely required and can be approximated for most purposes with a Breit-Wigner denominator with MeV, MeV, and appropriate phase space in the numerator for each channel. Together with , , and , one can complete a nonet together with the glueball which mixes with the states. The observed in BES data for (and several other sets of data) makes the first member of the next nonet. The exotic peak observed by BES in [14] is consistent with the upper half of , suggesting it is locked to this threshold at 1801 MeV, similar to the way is locked to the threshold [15].
References
- [1] D.V. Bugg, Eur. Phys. J C52 55 (2007); arXiv: hep-ex/0706.1341
- [2] C. Amsler et al., Phys. Lett. B 291 347 (1992)
- [3] A. Abele et al., Nucl. Phys. A 609 562 (1996)
- [4] A.V. Anisovich et al., Nucl. Phys. A 690 567 (2001)
- [5] A. Abele et al., Eur. Phys. J. C19 667 (2001) and 21 261 (2001)
- [6] M. Ablikim et al., Phys. Lett. B 607 243 (2005)
- [7] D. Alde et al., Eur. Phys. J. A3 361 (1998)
- [8] D. Barberis et al., Phys. Lett. B 474 423 (2000)
- [9] V.A. Polychronakos et al., Phys. Rev. D 19 1317 (1979); D. Cohen et al., Phys. Rev. D 22 2595 (1980); A.D. Martin and E.N. Ozmutlu, Nucl. Phys. B 158 520 (1979) A. Etkin et al., Phys. Rev. D 25 1786 (1982)
- [10] D.V. Bugg, Euro. Phys. J C 47 45 (2006)
- [11] M. Ablikim et al., Phys. Lett. B 598 149 (2004)
- [12] I. Caprini, I. Colangelo and H. Leutwyler, Phys. Rev. Lett. 96 032001 (2006)
- [13] W. Ochs, Ubiversity of Munich Ph.D. thesis (1974)
- [14] M. Ablikim et al., Phys. Rev. Lett. 96 162002 (2006)
- [15] C.A. Baker et al., Phys. Lett. B467 147 (1999)