From DNA sequence analysis to modelling replication in the human genome
Abstract
We explore the large-scale behavior of nucleotide compositional strand asymmetries along human chromosomes. As we observe for 7 of 9 origins of replication experimentally identified so far, the skew displays rather sharp upward jumps, with a linear decreasing profile in between two successive jumps. We present a model of replication with well positioned replication origins and random terminations that accounts for the observed characteristic serrated skew profiles. We succeed in identifying 287 pairs of putative adjacent replication origins with an origin spacing –, that are likely to correspond to replication foci observed in interphase nuclei and recognized as stable structures that persist throughout subsequent cell generations.
pacs:
87.15.Cc, 87.16.Sr, 87.15.AaDNA replication is an essential genomic function responsible for
the accurate transmission of genetic
information through successive cell generations. According to the
“replicon” paradigm derived from prokaryotes un ,
this process starts with the binding of some
“initiator” protein to a specific “replicator” DNA sequence
called origin of replication (ori).
The recruitement of additional factors initiates the bidirectional
progression of two divergent replication forks along the chromosome.
One strand is replicated continuously from the origin (leading strand),
while the other strand is replicated in discrete steps towards the origin
(lagging strand).
In eukaryotic cells, this event is initiated
at a number of ori
and propagates until two converging forks
collide at a terminus of replication (ter)
trois . The initiation
of different ori is coupled to the cell cycle
but there is a definite flexibility in the usage of the ori
at different developmental stages quatre ; six .
Also, it can be strongly influenced by the distance and timing
of activation of neighbouring ori, by the transcriptional
activity and by the local chromatin structure quatre .
Actually, sequence requirements for an ori vary significantly
between different eukaryotic organisms. In the unicellular
eukaryote Saccharomyces cerevisiae, the ori spread over
100–150 and present some highly conserved motifs
trois .
In the fission yeast Schizosaccharomyces pombe, there is no
clear consensus sequence and the ori spread over at least
800 to 1000 trois . In multi–cellular
organisms, the ori are rather poorly defined
and initiation may occur at multiple sites distributed over
thousands of base pairs cinq .
Actually, cell diversification may have led higher eukaryotes to develop various
epigenetic controls over the ori selection rather than to conserve
specific replicator sequences huit . This might explain
that only very few ori have
been identified so far in multi–cellular eukaryotes,
namely around 20 in metazoa and only about 10 in human trentecinq .
The aim of the present work is to show that with an appropriate
coding and an adequate methodology, one can challenge the issue
of detecting putative ori directly from the
genomic sequences.
According to the second parity rule lobry95 ,
under no–strand bias conditions, each genomic DNA strand
should present equimolarities of A and T and of G and C.
Deviations from intrastrand equimolarities have
been extensively studied in prokaryotic, organelle and viral
genomes for which they have been used to detect
the ori treize .
Indeed the GC and TA skews abruptly switch sign at the ori
and ter displaying step like profiles, such that the leading strand
is generally richer in G than in C, and to a lesser
extent in T than in A. During replication, mutational events
can affect the leading and lagging strands differently, and an
asymmetry can result if one strand incorporates more mutations
of a particular type or if one strand is more efficiently
repaired treize .
In eukaryotes, the existence of compositional biases has been debated
and most attempts to detect the ori
from strand compositional asymmetry have been inconclusive.
In primates, a comparative study of the –globin ori has
failed to reveal the existence of a replication–coupled mutational
bias dixsept .
Other studies have led to rather opposite results.
The analysis of the yeast genome
presents clear replication–coupled strand asymmetries
in subtelomeric chromosomal regions seize .
A recent space–scale analysis vingtquatre of the
GC and TA skews in long human contigs has
revealed the existence of compositional strand asymmetries in
intergenic regions,
suggesting the existence of a replication bias.
Here, we show that the skew profiles of the
22 human autosomal chromosomes, display a remarkable serrated
“factory roof” like behavior that differs from the crenelated
“castle rampart” like profiles resulting from the prokaryotic
replicon model treize . This observation will lead us to propose an
alternative model of replication in higher eukaryotes.
Sequences and gene annotation data were downloaded
from the UCSC Genome Bioinformatics site and correspond to the assembly
of July 2003 of the human genome.
To exclude repetitive elements that might have been inserted
recently and would not reflect long–term evolutionary patterns,
we used the repeat-masked version of the genome leading to a homogeneous
reduction of of sequence length.
All analyses were
carried out using “knowngene” gene annotations. The TA and GC skews
were calculated as and .
Here, we will mainly consider , since
by adding the two skews, the sharp transitions of interest are significantly
amplified.
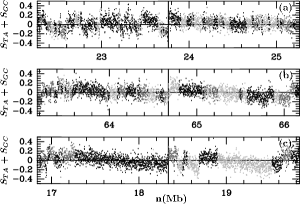
In Fig. 1 are shown the skew profiles of 3
fragments of chromosomes 8 and 20 that contain 3
experimentally identified ori.
As commonly observed for eubacterial genomes treize ,
these 3 ori correspond to rather sharp (over
several ) transitions from negative to positive values that
clearly emerge from the noisy background. The leading strand is
relatively enriched in T over A and in G over C. The investigation
of 6 other known human ori trentecinq
confirms the above observation for at least 4 of them (the 2 exceptions,
namely the Lamin B2 and –globin ori, might well be inactive
in germline cells or less frequently used than the adjacent ori).
According to the gene environment, the amplitude
of the jump can be more or less important and its position more or
less localized (from a few to a few tens ).
Indeed, it is known that transcription generates positive
TA and GC skews on the coding strand vingttrois ; vingtdeux ,
which explains that larger jumps are observed when the sense genes
are on the leading strand and/or
the antisense genes on the lagging strand, so that
replication and transcription biases add to each other.
On the contrary to the
replicon characteristic step like profile observed for
eubacteria treize , is definitely not
constant on each side of the ori location making quite elusive the
detection of the ter since no corresponding
downward jumps of similar amplitude can be found in Fig. 1.

In Fig. 2 are shown the profiles of
long fragments of chromosomes 9, 14 and 21,
that are typical of a fair proportion of the profiles
observed for each chromosome.
Sharp upward
jumps of amplitude () similar to the ones
observed for the known ori in Fig. 1,
seem to exist also at many other locations along the human
chromosomes. But the most striking feature is the fact that in between two
neighboring major upward jumps, not only the noisy
profile does not present any comparable downward sharp transition,
but it displays a remarkable decreasing linear behavior.
At chromosome scale, one thus gets jagged profiles
that have the aspects of “factory roofs” rather than
“castle rampart” step like profiles as expected for the
prokaryotic replicon model treize .
The profiles in Fig. 2 look somehow
disordered because of the extreme variability in the distance
between two successive upward jumps, from
spacings 50– (–
for the native sequences) up to 2–3
(– for the native sequences) in agreement with
recent experimental studies that have shown that mammalian replicons
are heterogeneous in size with an average size ,
the largest ones being as large as a few trentedeux .
We report in
Fig. 3 the results of a systematic detection of upward and
downward jumps using the wavelet–transform (WT) based methodology described
in Ref. [12(b)]. The selection criterium was to
retain only the jumps corresponding to discontinuities in the profile
that can still be detected with the WT
microscope up to the scale which is smaller than the typical
replicon size and larger than the typical gene size.
In this way, we reduce the contribution of jumps associated with
transcription only and maintain a good sensitivity to replication induced jumps.
A set of 5100 jumps was detected
(with as generally expected an almost equal proportion of upward and downward jumps).
In Fig. 3(a) are reported the histograms of the amplitude
of the so–identified upward () and downward
() jumps respectively, for the repeat–masked sequences.
These histograms do not superimpose, the former being
significantly shifted to larger values.
When plotting
vs in Fig. 3(b),
one can see that the number of large amplitude upward jumps overexceeds
the number of large amplitude downward jumps.
These results confirm that most of the sharp upward transitions in the
profiles in Figs 1 and 2, have no sharp
downward transition counterpart. This demonstrates that these jagged
profiles are likely to be representative of a general asymmetry
in the skew profile behavior along the human chromosomes.

As reported in a previous work vingtdeux , the analysis of a complete set of human genes revealed that most of them present TA and GC skews and that these biases are correlated to each other and are specific to gene sequences. One can thus wonder to which extent the transcription machinery can account for the jagged profiles shown in Figs 1 and 2. According to the estimates obtained in Ref. vingtdeux , the mean jump amplitudes observed at the transition between transcribed and non–transcribed regions are and respectively. The characteristic amplitude of a transcription induced transition is thus significantly smaller than the amplitude of the main upward jumps in Fig. 2. Hence, it is possible that, at the transition between an antisense gene and a sense gene, the overall jump from negative to positive values may reach sizes that can be comparable to the ones of the upward jumps in Fig. 2. However, if some co–orientation of the transcription and replication processes may account for some of the sharp upward transitions in the skew profiles, the systematic observation of “factory roof” skew scenery in intergenic regions as well as in transcribed regions, strongly suggests that this peculiar strand bias is likely to originate from the replication machinery. To further examine if intergenic regions present typical “factory roof” skew profiles, we report in Fig. 4 the results of the statistical analysis of 287 pairs of putative adjacent ori that actually correspond to 486 putative ori almost equally distributed among the 22 autosomal chromosomes. These putative ori were identified by (i) selecting pairs of successive jumps of amplitude , and (ii) checking that none of these upward jumps could be explained by an antisense gene — sense gene transition.
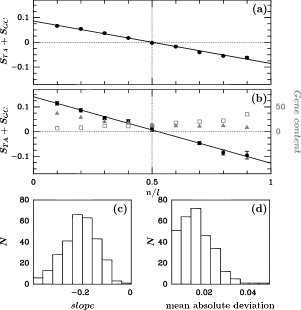
In Fig. 4(a) is shown the profile obtained after
rescaling the putative ori spacing to 1 prior to computing the average
values in windows of width that contain more than 90%
of intergenic sequences. This average profile is linear and crosses
zero at the median position , with an overall upward jump
. The corresponding average profile
over windows that are now more than 90% genic is shown in
Fig. 4(b). A similar linear profile is obtained
but with a jump of larger mean amplitude .
This is a direct consequence
of the gene content of the selected regions.
As shown in Fig. 4(b),
sense (antisense) genes are preferentially on the left (right) side
of the 287 selected sequences, which implies that the replication
and – when present – transcription biases tend to add up.
In Fig. 4(c) is shown
the histogram of the linear slope values
of the 287 selected skew profiles after rescaling their length to 1.
The histogram of mean absolute deviation
from a linear decreasing profile reported in
Fig. 4(d), confirms the linearity of each selected skew
profiles.
Following these observations, we propose in Fig. 5 a rather crude model for
replication that relies on the hypothesis that the ori are
quite well positioned while the ter are randomly
distributed. In other words, replication would proceed in a
bi–directional manner from well defined initiation positions,
whereas the termination would occur at different positions from
cell cycle to cell cycle trentequatre . Then if one assumes
that (i) the ori are identically active and (ii)
any location in between two adjacent ori has an equal probability
of being a ter, the continuous superposition of step–like profiles
like those in Fig. 5(a) leads to the anti–symmetric
skew pattern shown in Fig. 5(b), i.e. a
linear decreasing profile that
crosses zero at middle distance from the two ori.
This model is in good agreement with the overall properties of the
skew profiles observed in the human genome and sustains the hypothesis
that each detected upward jump corresponds to an ori.

To summarize, we have proposed a simple model for replication in the
human genome whose key features are (i) well positioned ori and
(ii) a stochastic positioning of the ter.
This model predicts jagged skew profiles as observed around
most of the experimentally identified ori as well
as along the 22 human autosomal chromosomes.
Using this model as a guide, we have selected 287 domains
delimited by pairs of successive upward jumps in the
profile and covering 24% of the genome.
The 486 corresponding jumps are likely to mark 486 ori
active in the germ line cells.
As regards to the rather large size of the selected sequences
( on the native sequence),
these putative ori are likely to correspond
to the large replicons that require most of the S–phase
to be replicated trentedeux .
Another possibility is that these ori
might correspond to the so–called replication foci observed
in interphase nuclei trentedeux . These stable
structures persist throughout the cell cycle and
subsequent cell generations, and likely represent
a fundamental unit of chromatin organization.
Although the prediction of 486 ori seems a significant
achievement as regards to the very small number of experimentally
identified ori,
one can reasonably hope to do much better relatively to the
large number (probably several tens of thousands) of
ori.
Actually what
makes the analysis quite difficult is the extreme variability
of the ori spacing from to several ,
together with the necessity of
disentangling the part of the strand asymmetry coming from
replication from that induced by transcription, a task
which is rather delicate in regions with high gene density.
To overcome these difficulties, we plan to use the WT with
the theoretical skew profile in Fig. 5(b)
as an adapted analyzing wavelet.
The identification of a few thousand putative ori in the human genome
would be a very promising methodological step
towards the study of replication in mammalian genomes.
This work was supported by the Action Concertée Incitative IMPbio 2004, the
Centre National de la Recherche Scientifique, the French Ministère de la Recherche
and the Région Rhône-Alpes.
References
- (1) F. Jacob, S. Brenner and F.Cuzin, Cold Spring Harb. Symp. Quant. Biol. 28, 329 (1964).
- (2) S.P. Bell and A. Dutta, Annu. Rev. Biochem. 71, 333 (2002).
- (3) S.A. Gerbi and A.K. Bielinsky, Curr. Opin. Genet. Dev. 12, 243 (2002); D. Schubeler et al., Nat. Genet. 32, 438 (2002); D. Fisher and M. Mechali, EMBO J. 22, 3737 (2003); M. Anglana et al., Cell 114, 385 (2003).
- (4) O. Hyrien and M. Mechali, EMBO J. 12, 4511 (1993).
- (5) D.M. Gilbert, Science 294, 96 (2001).
- (6) J.A. Bogan, D.A. Natale and M.L. Depamphilis, J. Cell. Physiol. 184, 139 (2000); M. Méchali, Nat. Rev. Genet. 2, 640 (2001); C. Demeret, Y. Vassetzky and M. Méchali, Oncogene 20, 3086 (2001); A.J. McNairn and D.M. Gilbert, Bioessays 25, 647 (2003); D.M. Gilbert, Nat. Rev. Cell. Biol. 5, 1 (2004).
- (7) V. Todorovic, A. Falaschi and M. Giacca, Front Biosci. 4, D859 (1999); E.M. Ladenburger, C. Keller and R. Knippers, Mol. Cell. Biol. 22, 1036 (2002); C. Keller et al., J. Biol. Chem. 277, 31430 (2002); S.M. Cohen et al., J. Cell. Biochem. 85, 346 (2002); L. Hu, X. Xu and M.S. Valenzuela, Biochem. Biophys. Res. Commun. 313, 1058 (2004).
- (8) J.W. Fickett, D.C. Torney and D.R. Wolf, Genomics 13, 1056 (1992); J.R. Lobry, J. Mol. Evol. 40, 326 (1995).
- (9) J. Mrazek and S. Karlin, Proc. Natl. Acad. Sci. USA 95, 3720 (1998); A.C. Frank and J.R. Lobry, Gene 238, 65 (1999); E.P. Rocha, A. Danchin and A. Viari, Mol. Microbiol. 32, 11 (1999); E.R. Tillier and R.A. Collins, J. Mol. Evol. 50, 249 (2000).
- (10) M.P. Francino and H. Ochman, Mol. Biol. Evol. 17, 416 (2000).
- (11) A. Gierlik et al., J. Theor. Biol. 202, 305 (2000).
- (12) S. Nicolay et al., Phys. Rev. Lett. 93, 108101 (2004); S. Nicolay et al., Physica A. 342, 270 (2004).
- (13) E. Louis, J. Ott and J. Majewski, Genome Res. 13, 2594 (2003).
- (14) M. Touchon et al., FEBS Lett. 555, 579 (2003); M. Touchon et al., Nucleic Acids Res. 32, 4969 (2004).
- (15) R. Berezney, D.D. Dubey and J.A. Huberman, Chromosoma 108, 471 (2000).
- (16) D. Santamaria et al., Nucleic Acids Res. 28, 2099 (2000).