A principal component analysis approach to the morphology of Planetary Nebulae
Abstract
Principal Component Analysis (PCA) is a well–known technique used to decorrelate a set of vectors. It has been applied to explore the star formation history of galaxies or to determine distances of mass–lossing stars. Here we apply PCA to the optical data of Planetary Nebulae (PNe) with the aim of extracting information about their morphological differences. Preliminary analysis of a sample of 55 PNe with known abundances and morphology shows that the second component (PC2), which results from a relation produced by the parameters log(N/O), initial and final mass of PNe, is depending on the morphology of PNe. It has been found that when log(N/O) the PNe’s nitrogen is low independently on the oxygen abundance for either Bipolar (B), Elliptical (E) or Round (R) PNe. An interesting result is that both E and R PNe have log(N/O) while only B PNe show negative and positive values. Consequently, B PNe are expected to have higher nitrogen values than the E and R PNe. Following that and a second sample of 35 PNe, ne is also found to be higher in B PNe. Also, in all PNe morphologies PC2 appears to have a minimum at 0.89 and PNe’s initial mass at 2.6 M⊙. 5–D diagrams between PCAs components and physical parameters are also presented. More results will follow while simple models will be applied in order to try to give a physical meaning to the components.
Keywords:
planetary nebulae: general1 Introduction
Planetary Nebulae (PNe) are powerful tools in the study of the evolutionary scenario of intermediate mass stars. They play an important role in the chemical enrichment history of the interstellar medium and many efforts have been devoted to determine the physical parameters of Galactic PNe (like Te, ne, T⋆, L⋆, distance, abundances; journal1 and references therein). For this study a number of methods have been used either by using the observational results directly or by developing simulation models like CLOUDY journal2 . Using the latter, the values of the physical parameters can be determined (i.e. journal3 ) but not any possible correlation among them. So far, only statistical methods had been used in order to find correlations between the parameters. However, there is a well–known technique (PCA) which can be used in order to study the possible correlation between these parameters. PCA technique uses a sample of observed parameters and creates a new sample of independent components which are linear combination from the previous parameters.
2 PCA methods and 5–D diagrams
PCA is a useful tool in statistical studies, especially when there are many observed parameters. It has been applied to explore the stars formation history or to describe and classify the stellar spectra. The basic idea of this method is that it minimizes a set of observed parameters to a new set of independent parameters. The number of these new components reveals the true dimension of the space generated by the observed parameters. Also, a 5–D diagram has been developed in order to study if there is any correlation between the new components and the measured parameters. These diagrams are like common 3–D diagrams with the difference that, they illustrate two more variables using different colours and sizes.
3 Preliminary results
In this work, we applied PCA method to a set of optical data of 55 PNe with known abundances and morphology journal4 , in order to extract information correlated to their morphological differences. The new principal components PC1, PC2 and PC3 ((1)-(3)) resulted by using a set of parameters (log(N/O), core Mass Mc and initial Mass Mi) which are correlated according to the star formation history (journal5 & journal6 ). It can be seen from (1)–(3) that the difference between PC1, PC2 and PC3 is that each one is strongly depended on one of these parameters only.
| (1) |
| (2) |
| (3) |
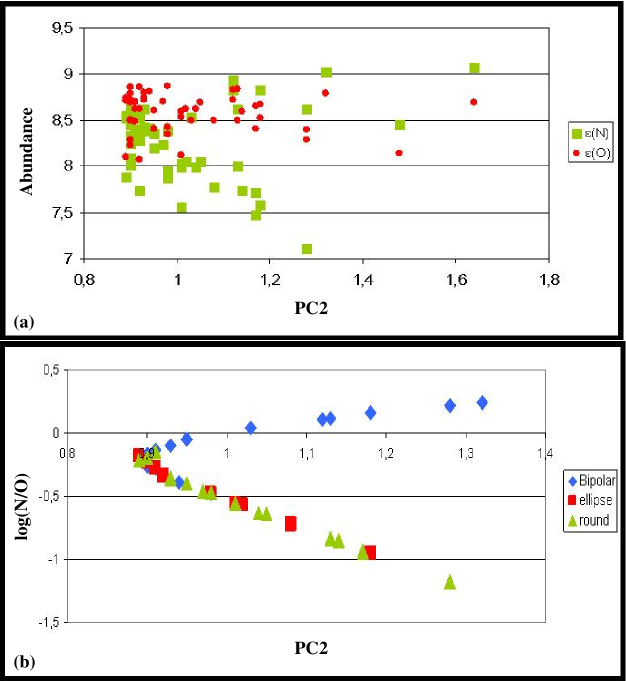
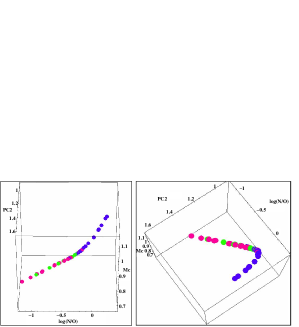
The PC1 and PC3 components do not provide any significant result, while PC2 shows that it depends on the morphology of PNe. From (2), we produced the diagrams shown in Figures 1(a),(b) & 2, where it can be seen that when log(N/O) 0.18, the PNe’s nitrogen abundance is low independently on the oxygen for either B, E or R morphology. Moreover, the log(N/O) is negative, if the PN morphological type is either E or R, while it takes both negative and positive values in the case of B morphology. PC2 component appears to have a minimum value at 0.89 for all morphological types, resulting to an initial mass for the progenitor star of 2.6 M⊙. PCA method was also applied to another sample of 35 PNe journal7 , using a set of different parameters (abundance (N), (S) and electron density ne) which are important to PNe’s study. In this case, the new principal components PC4, PC5 and PC6 ((4)–(6)) were calculated to:
| (4) |
| (5) |
| (6) |
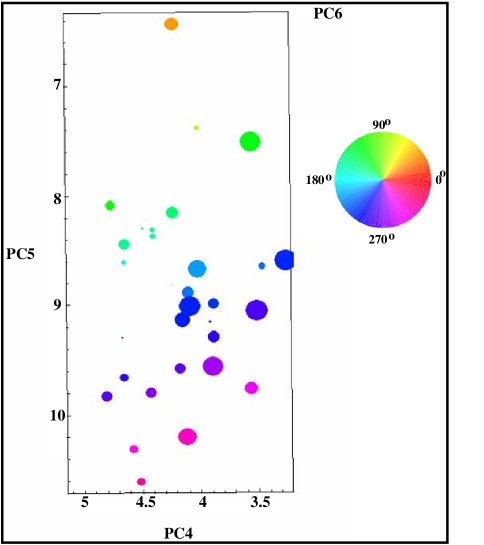
In Figure 3, we present a 5–D diagram with PC4, PC5 and PC6 on X,Y and Z axis respectively and (S), ne on different colours and sizes. In particular, it can be seen that (S) increases when PC5 increases (the circular colour bar on the right of Figure 3 shows the increase of (S) as we go from (4.2) to (7.7)). Also, it is clear that ne increases (larger size means higher value of ne) linearly with PC4 and PC5. This 5–D representation shows that there is a strong dependence between PC4 and PC5, and ne since for the same value of (same colour i.e. blue), we result to a linear equation (7). By using (4),(5) and (7) we produce the relationship (8). Since in that case is constant, then ne increases when increases. Following this result and the one from the previous sample, it appears that the B PNe must have higher ne values than either E or R PNe. These preliminary results show that the use of new components which are correlated with physical parameters can provide useful information therefore must be explored further in the future.
4 Acknowledgments
The authors would like to thank I. Ouranos for providing the 5–D model (animation). SA acknowledgments funding by the European Union and the Greek Ministry of Development in the framework of the programme ’Promotion of Excellence in Research Institutes ( Part)’.
References
- (1) Akras S., Boumis P., van Hoof P.A.M., Van de Steene G., Mavromatakis F., Papamastorakis J., Xilouris E.M., Goudis C.D., MNRAS, in preparation, (2007)
- (2) Cazetta J., & Maciel W.J., RevMexAA, 36, 3 (2000)
- (3) Escudero A.V., Costa R.D.D., & Maciel W.J., A&A, 414, 211 (2004)
- (4) Escudero A.V., & Costa R.D.D., A&A, 380, 300 (2001)
- (5) Ferland G.J., Korista K.T., Verner D.A., Ferguson J.W., Kindom J.B., & Verner E.M., PASP, 110, 761 (1998)
- (6) Phillips J.P., MNRAS, 340, 883 (2003)
- (7) Williams A.K.: In Proc. of the 15th European Workshop of White Dwarf, ASPC Ser., vol 370, astro-ph0610254 (2006)