An Imaging Fabry-Pérot system for the Robert Stobie Spectrograph on the Southern African Large Telescope
Abstract
We present the design of the Fabry-Pérot system of the Robert Stobie Spectrograph on the 10-meter class Southern African Large Telescope and its characterization as measured in the laboratory. This system provides spectroscopic imaging at any desired wavelength spanning a bandpass 430 – 860 nm, at four different spectral resolving powers () ranging from 300 to 9000. Our laboratory tests revealed a wavelength dependence of the etalon gap and parallelism with a maximum variation between 600 – 720 nm that arises because of the complex structure of the broadband multi-layer dielectric coatings. We also report an unanticipated optical effect of this multi-layer coating structure that produces a significant, and wavelength dependent, change in the apparent shape of the etalon plates. This change is caused by two effects: the physical non-uniformities or thickness variations in the coating layers, and the wavelength dependence of the phase change upon reflection that can amplify these non-uniformities. We discuss the impact of these coating effects on the resolving power, finesse, and throughput of the system. This Fabry-Pérot system will provide a powerful tool for imaging spectroscopy on one of the world’s largest telescopes.
1 Introduction
The Southern African Large Telescope (SALT) is a 10-meter class telescope owned and operated by an international consortium of partners. The telescope design (Stobie, Meiring & Buckley (2000); Swat et al. (2003)) is a modification of the Hobby-Eberly Telescope, employing a multi mirror spherical primary that is held fixed during an observation. A prime-focus tracker follows the image and contains a spherical aberration corrector and instruments. The Robert Stobie Spectrograph (RSS) Burgh et al. (2003); Nordsieck et al. (2003); Kobulnicky et al. (2003); Smith et al. (2006) is a prime-focus spectrograph providing long-slit, multi-object, and imaging spectroscopic modes, together with polarimetric capability. The RSS was designed, built and commissioned as a collaboration between groups from the University of Wisconsin and Rutgers University.
One of the goals of the RSS is to provide imaging spectroscopic capabilities for SALT, using Fabry-Pérot (FP) technology. The Rutgers group has extensive experience in this field, having provided the Rutgers Fabry-Pérot (RFP) instrument Schommer et al. (1993) at the Cerro Tololo Observatory for many years, and designing a new FP instrument, ARIES, for the SOAR telescope Cecil (2000). The RSS FP system represents an evolution of these designs, adapted for the characteristics of the SALT telescope and the scientific requirements of the SALT partners. The major design goals of the system are to provide spectroscopic imaging over the full field of view of the telescope, at a variety of spectral resolutions ranging from 500 to 12500, over the wavelength range from 430 to 860 nm.
The use of FP technology in astronomy for imaging spectroscopy has evolved over the years and is now being successfully employed on a regular basis by many groups around the world for galactic and extragalactic studies. The first use of the FP in astronomy was by Fabry himself (fabry) to study the Orion nebula. De Vaucouleurs developed the “galaxymeter” (galaxymeter) for measuring galaxy rotation curves. In the 1980s, a series of Taurus FP systems were developed and used at several large telescopes (atherton2). Other systems followed, including the Ohio state imaging FP spectrometer (richard), the Goddard FP imager (gelderman), the Hawaii imaging FP interferometer (tully), and the Wisconsin H-alpha imager (tufte). The Taurus tunable filter (jones) pioneered the use of FP techniques for lower resolution studies, followed by the NACO FP tunable filter at VLT (hartung) and the Magellan-Maryland tunable filter. The UNSWRIF system (ryder) extends FP technology into the near infrared.
This paper documents the design of the SALT RSS FP system and its characteristics as measured in our laboratory. It is organized as follows: in section 2 we review the basic properties of the FP interferometer; in section 3 we present the design of the FP subsystem for the SALT RSS; we present the results of our laboratory testing of the FP etalons in section 4; we discuss the unanticipated effects of the coatings in section 5 and conclude in section 6. In a subsequent paper we plan to describe the commissioning of the FP subsystem on SALT and document its performance characteristics in the observing environment.
2 Basic Principles and Characteristics of a Fabry-Pérot Interferometer
2.1 Ideal Fabry-Pérot
A FP etalon consists of a pair of parallel glass plates and works on the principle of multiple beam interference. High reflectivity coatings are applied to the inner surfaces of the plates, and anti-reflection coatings are applied to the outer surfaces. Light entering the etalon at an angle will undergo multiple reflections between the plates, resulting in an interference pattern, subject to the following condition:
| (1) |
where is the gap between the plates, is the incident angle relative to the plate normal, is the order of interference, and is the wavelength of the light in the gap medium (, where is the wavelength in vacuum and is the refractive index). The separation between any two consecutive orders of interference is called the free spectral range (FSR), which is related to the gap by
| (2) |
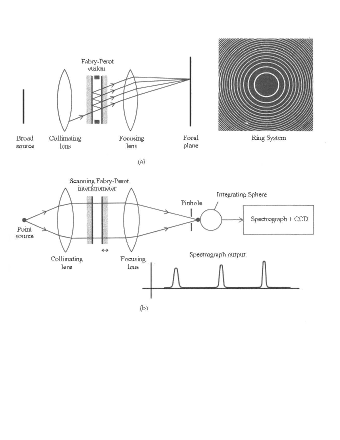
The transmission function of an ideal FP is an Airy function (left panel of Figure 1) given by
| (3) |
where is the intensity of the incident beam, and are the reflectance and transmittance of the high reflectance coatings, is the phase difference between two successive reflections, and . (Note that ideal coatings will have no absorption or scattering, so and the peak transmission of the etalon is 100%.)
Finesse is a measure of sharpness of the interference fringes and is measured experimentally by the ratio of the FSR to the full width at half maximum (FWHM) of the transmission profile. For an ideal etalon, the finesse is determined solely by the reflectance and is termed the “reflectance finesse”, :
| (4) |
The spectral resolving power of the FP is given by
| (5) |
Therefore the resolving power can be increased by either increasing the order of the interference () or by increasing the reflectance of the coatings.
In the case of an extended monochromatic light source the interference pattern takes the form of a ring of radius , with . If the illumination subtends a sufficiently large range of angles , then multiple concentric rings of successive orders are formed (right panel of Figure 1(a)). The transmitted wavelength can be selected by either changing the gap spacing (mechanical scanning) or by changing the index of the medium in the gap (pressure scanning). In this way the FP etalon acts as a tunable narrow band filter.

2.2 Practical Fabry-Pérot
Practical high-reflectance coatings will have some non-zero absorption coefficient , making the transmission . The expression for the etalon transmission is still given by equation 3, but the maximum transmission is no longer 100%. The effect of absorption is to lower the transmission of the fringes, but does not affect the finesse or spectral resolution of the etalon. To minimize the absorption , most current astronomical FP systems employ multi-layer dielectric coatings. A typical value of for such coatings is 0.005; for , the maximum transmission is reduced to 90%. It is usually desirable for the coatings to have as broad a spectral bandwidth as possible; current designs can achieve an octave in bandwidth, but typically degrade rapidly at longer or shorter wavelengths.
While the plates of the FP interferometer are highly polished, they are not perfectly flat. This non-flatness gives rise to a defect finesse (). The effective finesse, , of the etalon is then the combination of the reflectance finesse and the defect finesse given by
| (6) |
Three common types of defects are: (1) curvature in the plates (), (2) surface irregularities or plate roughness () and (3) departure from parallelism (). Atherton et al. (1981) give the following expressions for these defects:
| (7) | |||||
| (8) | |||||
| (9) |
where , , are measures of the deviations for their respective defects. The expression for assumes spherical curvature; in general, the curvature can have a complicated shape. The total defect finesse is the combination of all the above defects
| (10) |
In addition to physical defects, optical effects in multi-layered reflection coatings can produce additional apparent distortions of the plates. This effect is discussed in detail in later sections. Any departure from flatness, either physical or apparent, will lower the overall finesse, spectral resolution and transmitted intensity of the etalon.
3 FP System for SALT
The design goals for the SALT FP system are to provide spectroscopic imaging over a wide range of wavelengths and spectral resolutions, while fitting within the size, weight, and budget constraints of the RSS. A survey of the SALT user community showed there was interest in programs at wavelengths extending from the ultraviolet atmospheric limit to the near-infrared. We could not accommodate this wide spectral range with a single set of etalon coatings, and chose a bandwidth of nm, leaving the range of shorter wavelengths for a possible future set of etalons. The SALT user survey also showed interest in a wide range of spectral resolutions, so we decided on a system employing three etalons, with gap spacings of 5, 27, and 135 m, providing spectral resolutions at 650 nm of 500, 2500, and 12500, respectively. We shall subsequently refer to these etalons as SG, MG, and LG (for small, medium and large gap). The diameter of the collimated beam in the RSS is 150 mm, so etalons with this clear aperture are required. It is difficult to obtain etalon plates of this size with surface quality better than , so . We chose a reflectance for the coatings, giving , and the combined effective finesse .
A blocking filter is required to select the desired transmission order of the FP etalon. For the low resolution etalon SG, with larger FSR, a reasonable number of standard interference filters can be used to isolate the orders. We designed a set of filters to isolate each of the orders of the SG etalon within our wavelength range. The filters are 4-period designs to give relatively flat-topped transmission profiles with steep sides. The design goal is to choose filter central wavelengths and widths so that in the worst case, when the etalon is tuned to the cross-over wavelength between adjacent filters, the filter adequately suppresses the transmission of the neighboring order of the etalon. The filter set consists of 40 filters, whose measured transmission curves are shown in Figure 2.

The transmissions are typically 80% or better, less at the crossover wavelengths between adjacent filters. Since the etalon FSR increases with wavelength, the filters are narrower and more closely spaced at the short wavelength end of the range. Manufacturing tolerances have produced some gaps in the set where the transmission at the crossover wavelength is unacceptably low; additional filters will be purchased in the future to fill these gaps.
An example of the filter blocking for the SG etalon is shown in Figure 3, where the solid curve is the transmission of an ideal etalon of gap 11 m and the dashed curve is the measured transmission of one of the filters. The left panel shows the etalon tuned to the central wavelength of the filter, and the adjacent orders are highly blocked. The right panel shows the worst case when the etalon is tuned to the crossover wavelength to the next filter, and the “parasitic light” leakage of the adjacent order is a few percent.

For the higher resolution etalons with their smaller FSR, the blocking scheme discussed above becomes impractical, requiring a very large number of narrow (hence expensive and lower peak transmission) filters. We thus decided to employ a dual etalon system for the higher resolution modes. Either the MG or LG etalon is used in series with the SG etalon and one of the blocking filters discussed above. The SG etalon is tuned to the same wavelength as the higher resolution etalon, and suppresses its adjacent orders. As above, the filter suppresses the adjacent orders of the SG etalon. The scheme is illustrated in Figure 3, where an idealized MG etalon (27 m gap) transmission is shown by the dotted curve. The total transmission (not shown in the figure for clarity) is the product of the three curves. Parasitic light is highly suppressed in the medium resolution mode. In the highest resolution mode, the wings of the SG transmission do not fully block the adjacent orders of the LG etalon, producing parasitic light of typically 5%. The dual etalon design makes it possible to select any desired wavelength within the coating bandpass, and at any of the etalon resolutions, with a limited number (40) of interference filters.
We selected IC Optical Systems Ltd (ICOS) to supply the etalons and their controllers. Each etalon is controlled by a three-channel system that uses differential capacitance micrometers and piezo-electric actuators, incorporated into the etalon, to monitor and correct errors in plate parallelism and spacing. Two channels (X and Y) control the parallelism using capacitor pairs optically contacted to the etalon plates. The third channel (Z) sets and maintains the spacing between the plates by comparing another capacitor optically contacted to the plates to a fixed-gap reference capacitor. Since all the measurements are differences between air-gap capacitors within the ambient etalon environment, they are highly stable and relatively immune to the influence of changing temperature, humidity, etc. The system can move the plates over a range of 6 m with a resolution of 0.49 nm.
The range of the piezo-electric actuators is sufficient to change the gap of the SG etalon by a factor of two, allowing this etalon to be operated in two different spectral resolution modes. Thus the system provides four distinct spectral resolutions. Setting the SG etalon to its smallest gap (5 m) produces the Tunable Filter (TF) mode with , and setting it to its largest gap (11 m) produces the Low Resolution (LR) mode with . For the larger gap etalons, the piezo actuators cannot change the gap enough to produce significantly different resolutions, and we choose to operate the etalons near their largest gap settings for maximum resolution. Setting MG etalon to its largest gap (28 m) produces Medium Resolution (MR) mode, with . Setting LG to its largest gap (136 m) produces High Resolution (HR) mode, with . Details on these modes are presented in section 4.

4 Lab Testing
The characterization and calibration of the FP system was carried out in our lab at Rutgers University. The test setup, shown schematically in right panel of Fig. 1(b), consisted of a pair of telescopes, each with 1200 mm focal length and 150 mm aperture, used as a collimator and a camera. The etalons were mounted on a slide that allowed them to be positioned into and removed from the collimated beam. The light source used was a 100 W quartz halogen lamp. The transmitted light was fed into an integrating sphere that illuminated the entrance slit of a 0.5m spectrograph with a CCD detector. The spectrograph allows to measure the transmission profile of the FP over several orders in a single spectrogram. A typical output transmission profile as shown in Figure 4 was fit very well by a Voigt function, providing the central wavelength and FWHM of each individual order. The spectrograph used three gratings that provided spectral resolutions of 0.25 nm, 0.08 nm, and 0.04 nm. The TF and LR modes, with 13 and 26 orders respectively, were measured with the 0.25 nm resolution. The MR mode with 72 orders was measured with a combination of the 0.25 nm and 0.08 nm resolution. The HR mode with 330 orders was measured with a combination of the 0.08 nm and 0.04 nm resolution. The measured characteristics of all modes and orders are listed in Table 1.
We do not have the facilities in our lab to measure directly the properties of the etalon coatings. Figure 5 shows the measurements supplied by ICOS of the high reflection coatings at the etalon gaps and the anti-reflection coatings on the outer surfaces for each of the three etalons. The coatings meet our specifications of and , respectively.

4.1 Results
| wavelength | FWHM | FSR | finesse | resolution | gap (d) | X offset | Y offset |
|---|---|---|---|---|---|---|---|
| (nm) | (nm) | (nm) | (m) | ||||
| TF Mode | |||||||
| 440.875 | 1.595 | 23.270 | 14.60 | 276 | 4.18 | -112 | 40 |
| 464.144 | 1.823 | 24.810 | 13.60 | 255 | 4.34 | -100 | 25 |
| 490.500 | 1.663 | 28.040 | 16.90 | 295 | 4.29 | -112 | 33 |
| 520.218 | 1.888 | 31.160 | 16.50 | 276 | 4.34 | -112 | 33 |
| 552.812 | 1.912 | 34.410 | 18.00 | 289 | 4.44 | -120 | 40 |
| 589.043 | 2.353 | 37.440 | 15.90 | 250 | 4.63 | -112 | 45 |
| 627.701 | 1.973 | 38.380 | 19.50 | 318 | 5.13 | -165 | 85 |
| 665.800 | 2.033 | 35.040 | 17.20 | 327 | 6.33 | -250 | 140 |
| 697.783 | 1.874 | 32.830 | 17.50 | 372 | 7.42 | -290 | 180 |
| 731.461 | 1.847 | 36.280 | 19.60 | 396 | 7.37 | -280 | 160 |
| 770.346 | 2.093 | 42.060 | 20.10 | 368 | 7.05 | -245 | 140 |
| 815.590 | 2.514 | 47.930 | 19.10 | 324 | 6.94 | -255 | 150 |
| 866.214 | 3.093 | 50.620 | 16.40 | 280 | 7.41 | -220 | 150 |
| LR Mode | |||||||
| 426.480 | 1.173 | 8.930 | 7.60 | 364 | 10.18 | -30 | -85 |
| 435.412 | 0.621 | 9.310 | 15.00 | 701 | 10.18 | -30 | -85 |
| 444.605 | 0.660 | 10.000 | 15.20 | 674 | 9.88 | 0 | -110 |
| 454.946 | 0.703 | 10.650 | 15.10 | 647 | 9.72 | 0 | -110 |
| 465.886 | 0.699 | 11.220 | 16.10 | 667 | 9.67 | -10 | -110 |
| 477.368 | 0.612 | 11.760 | 19.20 | 780 | 9.69 | -10 | -110 |
| 489.406 | 0.630 | 12.360 | 19.60 | 777 | 9.69 | -10 | -110 |
| 502.079 | 0.677 | 13.010 | 19.20 | 742 | 9.69 | -10 | -110 |
| 515.371 | 0.710 | 13.690 | 19.30 | 726 | 9.70 | -10 | -110 |
| 529.743 | 0.706 | 14.380 | 20.40 | 750 | 9.76 | -20 | -95 |
| 544.213 | 0.698 | 15.080 | 21.60 | 780 | 9.82 | -10 | -105 |
| 559.896 | 0.751 | 15.840 | 21.10 | 746 | 9.90 | -20 | -95 |
Note. — Table 1 is published in its entirety in the electronic edition of the Astronomical Journal. A portion is shown here for guidance regarding its form and content.
4.1.1 Parallelism, FSR and Effective Gap


The two plates of the etalon should be as parallel to each other as possible in order to achieve maximum resolution and transmission. The parallelism is adjusted by changing the X and Y offsets of the controller, the optimal values of which are obtained when the transmission profiles are most symmetric and sharpest222The control system settings can be affected by environmental conditions like temperature and humidity. More testing will be carried out in the telescope environment during the commissioning of the instrument to check its stability.. These values of X and Y are listed in Table 1 and plotted in Figure 6. The precision of our determination of the optimum parallelism setting is units. For an ideal etalon, the parallelism settings will be wavelength independent. However, we found that in all four modes the parallelism settings are constant at shorter wavelengths, vary between 600 – 750 nm, and are again constant (but at different values) at longer wavelengths. As seen in Figure 6, the shapes of the parallelism setting curves are remarkably similar for all three etalons and all four resolution modes.
The effective gap of the etalon can be determined by measuring the FSR between a pair of consecutive transmission orders, and applying equation 2. The results, displayed in the left panels of Figure 7, show that in all four modes, the effective gap increases by about 3 m in the same 600 – 750 nm wavelength range in which the parallelism settings change. Plotting the FSR as a function of wavelength, shown in the right panels of Figure 7, illustrates the same effect. The dashed and dot-dashed curves are plots of equation 2 for the best-fit values of the gap at short and long wavelengths, respectively. In all four modes at short wavelengths the FSR exhibits the quadratic increase with wavelength characteristic of a fixed gap. Between 600 nm and 750 nm the curves show inflections. At longer wavelengths the FSR curve again becomes quadratic, but with a larger fixed gap. Again, the shape of the change of the effective gap is remarkably similar for all the etalons.


The variation of effective gap and parallelism with wavelength is most likely due to the complex structure of the high reflective coatings that are required to achieve the broad bandwidth from 430 nm to 860 nm of our specification. Similar wavelength dependent effects were also seen by ryder with 70 mm aperture etalons. This unexpected behavior of the coatings will have effects on other properties of the etalon as well and is discussed in detail in section 5.
4.1.2 Plate Flatness
As discussed in section 2.2, the finesse and resolution can be affected by deviations from plate flatness. We measured the effective shape of the plates along the X and Y axis of the etalon by reducing the illuminating aperture of the collimated beam to 25 mm diameter and recording spectra of the etalon transmission at a series of positions across the etalon. The measuring positions were spaced by steps of approximately 20 mm, producing 7 locations along the axis. The etalon was then physically rotated to measure along the other axis. The effective gap at each position was determined using equation 1. The shape of the plates is expressed as the change in the gap from that at the center of the plates. The measurements are plotted in Figure 8.
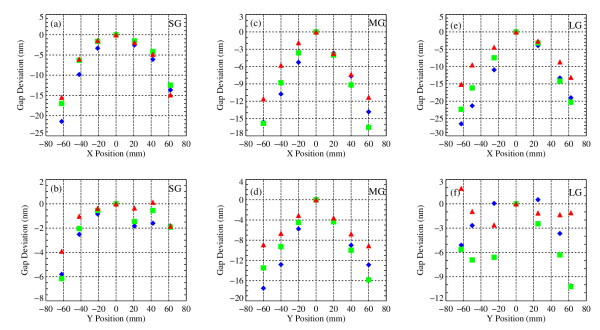
For all three etalons, the effective gap decreases away from the center. Moreover, this trend is generally wavelength dependent with the plates somewhat flatter in the red than in the blue.
For the SG etalon, the plates exhibit roughly spherical curvature of approximately 15 nm along the X-axis, but are flat along the Y-axis to within nm over most of the aperture, with a turned-down edge of about 6 nm on one side. The weighted RMS deviation from the center (weighting by the area of annular sectors) is about 8 nm at 650 nm (). For the MG etalon, the effective shape along both the X and Y axes is more conical (i.e. the gap decreases roughly linearly with radius), with a weighted RMS deviation of 12.2 nm (). Finally for the LG etalon, the deviation along the X-axis is greater and more conical in the blue, smaller and more spherical in the red. Along the Y-axis the plates are effectively flat and show no distinct shape. Therefore the overall shape of the plates resembles that of a half cylinder. The weighted RMS deviation at 650 nm is 13 nm ().
The effective shape measured here is not representative of the actual physical flatness of the plates since interferograms of the plates taken by ICOS after polishing but before coating showed flatness of or better for all the plates. As discussed in Section 5, this apparent curvature is likely due to an optical effect of the reflection coatings.
4.1.3 Finesse and Resolving Power
The significant deviations from flatness discussed in the previous section produce lower than expected finesse and spectral resolution. If the only contribution to the total finesse comes from , then using (the average value from the coating curves in Figure 5) and equation 4 we would expect a finesse of . But the measured finesse is less than the expected finesse because of the contribution of defect finesse. The measured finesse for each of the three etalons is plotted as a function of wavelength in Figure 9.

For each etalon, we calculate a finesse curve using from the measured reflectivity, for spherical curvature, and equation 6. We assume the amplitude of the curvature defect is constant with wavelength. Then we either use the measured weighted RMS value discussed in the previous section, producing the dotted curves in the figure, or adjust the amplitude to optimize the fit, producing the solid curves.
For the SG etalon, the curve based on the measured defect amplitude of has the correct shape, but overestimates the actual finesse values. Adjusting to be 10.8 nm ( at 650 nm) in equation 7 yields the solid curve that fits the measured finesse very well. This is our best definition of the effective flatness of the plates for this etalon.
For the MG and LG etalons the shapes of the calculated curves do not agree as well with the measured finesse distributions. As noted in the previous section, both the shape and the amplitude of the surface defects change with wavelength, and these complications are not included in the calculations. For both etalons the solid curve is calculated with a flatness of at 650 nm, which is very close the measured weighted RMS deviations of and .
The spectral resolution listed in Table 1 is calculated using . It is related to the total finesse by equation 5. Thus the lower than expected total finesse produces lower resolving power for all three etalons. Figure 10 shows the spectral resolution as a function of wavelength for all four resolution modes. The spectral resolution for the LR, MR and HR modes is 780, 1500 and 8500 at 650 nm, respectively. Because these modes operate at their largest possible gap setting, there is no way to increase the resolving power. The lowest resolution TF mode has a resolving power of 350 at 650 nm. Since it is unwise to operate the etalon with a smaller gap (to avoid bringing the plates into contact and damaging the plates and/or their coatings), this is the lowest resolution available.

4.1.4 Transmission
| R | ||||
|---|---|---|---|---|
| (nm) | (m) | () | () | |
| 440.0 | 0.892 | 4.18 | 68 | 66 |
| 455.2 | 0.886 | 4.34 | 72 | 68 |
| 505.0 | 0.912 | 4.29 | 64 | 57 |
| 555.0 | 0.916 | 4.44 | 65 | 58 |
| 579.0 | 0.888 | 4.63 | 79 | 72 |
| 641.5 | 0.914 | 5.13 | 72 | 63 |
| 665.1 | 0.896 | 6.33 | 80 | 63 |
| 705.2 | 0.880 | 7.42 | 86 | 75 |
| 735.2 | 0.892 | 7.37 | 84 | 77 |
| 783.5 | 0.896 | 7.05 | 85 | 78 |
| 815.2 | 0.885 | 6.94 | 88 | 81 |
The deviation of the plates from flatness also produces a decrement of the peak transmission. For an ideal FP interferometer, the transmitted amplitude can be written as:
| (11) |
where in absence of absorption. The product gives the following transmitted intensity (Vaughan 1989):
| (12) |
assuming and . This is basically the Airy function shown in Figure 1 (left panel). For a deviation from flatness in the form of spherical curvature, the transmitted amplitude has the following form discussed by Mahapatra & Mattoo (1986):
| (13) |
where is the maximum deviation from a plane surface. Multiplying this by its complex conjugate gives the following transmitted intensity:
| (14) | |||||
where
| (15) |
equation 14 reduces to equation 12 for . Figure 11 shows the decrement in the transmitted intensity as increases. Notice that the plate curvature also broadens and shifts the transmission peak.
We measure the transmission from the ratio of two spectra: one with the etalon in the collimated beam and the other with the etalon replaced by a 150 mm clear aperture. The measured transmitted intensities for selected orders in the TF mode are listed in column 5 of Table 2. The theoretical transmitted intensity is calculated using equation 14 with nm at 650 nm (taken from section 4.1.2 for the SG etalon) and is listed in column 4 of Table 2. Although equation 14 does not account fully for the complicated effective curvature of the etalon plates, the calculated transmissions compare reasonably well with those observed. The difference between the measured and calculated transmitted intensity can be used to estimate the value of absorption, , of the coatings. We find , a typical value for multi-layer dielectric high-reflection coatings.
4.1.5 Wavelength Calibration
The etalon is scanned in wavelength by changing the controller offset value, which causes the gap size, , to change. In the lab, we take spectra of the etalon’s transmission at a range of settings to calibrate the – wavelength relation. (At the telescope, a different calibration procedure is used, where the etalon is tuned to the wavelengths of several emission lines from spectral lamps and the resulting ring patterns are measured.) We find that a low-order polynomial provides an excellent fit to the wavelength calibration:
| (16) |
where
| (17) |

The scanning range of the offset ( to ) is sufficient to cover several FSRs of an etalon. For the MG and LG etalons we use this to limit the number of orders calibrated for operational simplicity while retaining the ability to tune to any desired wavelength within the available bandpass (430 to 900 nm). We calibrate 12 orders of MG and 54 of LG. Over the full range a cubic polynomial fits best, with residuals of less than 1/40 of the FWHM. We operate the SG etalon in two modes: TF and LR, near the minimum and maximum gap, respectively. To maintain these extremes, we limit the range to that required to scan a single order ( to and to respectively) and calibrate every order: 13 in TF and 27 in LR. Over these restricted scanning ranges a quadratic polynomial provides an excellent fit, with residuals less than 1/50 of the FWHM.
The coefficient is the wavelength ‘zero point’ and can vary with time, temperature, humidity and other environmental factors. Its stability will be studied extensively in the telescope environment during commissioning. We expect that a single zero point calibration will be required on hourly time scales while observing. Our experience suggests that the , and coefficients will be very stable, requiring no more than weekly or monthly recalibration.
4.1.6 Stability

The wavelength stability, which is essentially the stability of the zero point , of the etalons was measured by taking a series of spectra over a period of more than 24 hours. During this period the etalon and the controller were undisturbed mechanically and electrically and the environmental conditions (like temperature) were held approximately constant. The measurements, plotted in Figure 12, were carried out for the TF, LR and MR modes only. The wavelength drift for these modes were smooth and typically nm per hour. Over the entire period of measurement the RMS wavelength fluctuations in the TF, LR and MR modes were 0.24 nm, 0.22 nm, and 0.071 nm, respectively. Note an abrupt jump of 0.3 nm in the zero point of LR mode between hour 2 and 3; there was a power failure in the lab which caused the controller to reset.
Additionally, the RMS FWHM fluctuations over the entire period were 0.075 nm in TF, 0.033 nm in LR and 0.021 nm in MR modes. For the MR mode, we also measured the parallelism stability over a 7-day period. The RMS variations in the and offsets over this period were 4.1 units and 2.4 units, respectively. These drifts are insignificant because the uncertainty in determining the optimum parallelism is at least 5 units. The wavelength and parallelism stability may change with variable environmental conditions and hence will be tested at the telescope during commissioning.
5 Discussion: Effect of Phase Dispersion on Multi-layer Broadband Coatings
Our laboratory testing uncovered three unexpected results: wavelength-dependent parallelism changes, wavelength-dependent gap changes, and significant apparent plate curvature. We believe that all of these phenomena arise from effects in the multi-layer broadband reflection coatings of the etalons.
5.1 Broadband Multi-Layer Coating Design
Although the exact coating structure of our etalons is proprietary information and we are unable to present it here, we have been given access to some of the design details to simulate the properties of the real coating using multi-layer design software. The coatings comprise 16 layers of Zinc Sulphide and Cryolite and are deposited without heating the substrates. The total thickness of the coating is 1331 nm.
The evolution of coating design from the simple quarter-wave layer AR coating to the fully optimized broadband multi-layer has been facilitated by the advent of proprietary and commercial coating design algorithms. Nevertheless, coating design and deposition is still an art as well as a science, requiring experience and an intimate knowledge of the performance and properties of the coating vendor s deposition chamber.
An early scheme for extending the spectral range of coatings was to combine two quarter-wave stacks on top of each other, with the two stacks optimized for different wavelength bands. To minimize scattering effects, which are usually more severe at shorter wavelengths, the upper stack was designed to reflect the shorter wavelengths, while the lower stack reflected the longer wavelengths. Thus longer wavelengths penetrated deeper into the coatings, giving rise to a larger effective gap at these wavelengths. While such design techniques are no longer necessary, it appears that the fully optimized coating covering our spectral range of 430–860 nm shows relics of this approach. Our measurements indicate that the transition occurs in the 600 to 720 nm wavelength region with the additional path as large as that due to the optical thickness of 2.6 m of coating material. We have simulated this effect for our coating designs with a 5 m air gap, producing the curve in Figure 13. Comparison with Figure 7 shows an excellent agreement of this prediction with our measurements of the effective gap. ryder observe similar effects for etalons coated for the near infrared.

5.2 Phase-Dispersion
In multi-layer dielectric reflectors, a wavelength-dependent phase shift () occurs upon reflection. Ramsay & Ciddor (1967) investigated the effect of phase-shift dispersion () in multi-layer dielectric reflectors on the apparent shape of the reflecting surface. They report an experiment where a plate with a physical surface of concave, when coated with a standard multi-layer reflector, showed an effective surface shape of concave at wavelength 546 nm, flat at 588 nm, and convex at 644 nm! The phase-shift dispersion can amplify the effects of slight irregularities in the coating thickness or the substrate surface to produce a significant, and wavelength dependent, change in the apparent shape of the surface. Ramsay & Ciddor (1967) present a result from Giacomo (1958):
| (18) |
where is the geometrical thickness of a multi-layer stack, refers to the different layers and is the interference order related to gap by equation 1 of this paper. The term is the geometric effect, and is independent of the phase dispersion in the coatings. Figure 14 shows the expected phase-shift curve as a function of wavelength for our coating design. Using this phase dispersion and nm, Equation 18 is plotted in the right panel of Figure 14; for comparison, we also show the geometrical term alone.

It is apparent from Equation 18 that the phase dispersion term can reduce or cancel the geometrical term, decreasing the sensitivity to surface and coating imperfections. Ciddor (1968) discusses attempts to design coatings with phase dispersions that cancel the geometric effect, and thus eliminate or significantly reduce the apparent curvature of the plates. He comments that it is very difficult (if not impossible) to simultaneously maintain a uniform high reflectivity over a broad bandwidth while producing the desired phase dispersion cancelation. Figures 14 and 5 suggest that our coatings have partially achieved this goal. The sensitivity to imperfections is reduced throughout the bandpass except for very small range between 442 nm and 448 nm where the amplification is only slightly worse than the geometrical term alone (but of the opposite sign). Throughout the red half of the bandpass the sensitivity is reduced by about a factor of 3. These results are only approximate, since we do not have the as-built details of the coatings, but we believe that they are indicative.
The manufacturing tolerance in the individual layer thickness of coatings available commercially is often quoted as , but this is a conservative figure and today’s coatings are undoubtedly better. Netterfield et al. (1980) show that with great care, modern coating techniques can achieve . Our measured surface curvatures of RMS amplitude 8 – 13 nm are consistent with the amplification factors of -8 to +3 (from Figure 14) and coating thickness variations of . To keep the phase dispersion amplified distortions to be less than (the physical flatness of our plates) would require coating thickness variations of less than 0.3% - a demanding but achievable goal.
The change of parallelism with wavelength may also arise from a similar effect. This change occurs in precisely the same wavelength region as the apparent gap change, and so is presumably related to the same sub-structure in the coatings. The similarity of the shape of the parallelism curves for all three etalons, shown in Figure 6, suggests that this is a systematic, not random effect. Thus one might suspect that there is a systematic tip between the upper and lower layers of the coating. The measured amplitude of the parallelism changes is nm in X and nm in Y. The coating irregularities deduced in the previous paragraph were of order 9 nm, and the effect of Equation 18 could amplify these by factors , so it is possible that this could produce the amplitude of the effect. The shape of the amplification curve in Figure 14 (constant at short and long wavelengths and changing rapidly between 600 and 700 nm) is suggestive of the shape of the parallelism curves; however we do not observe any significant parallelism change around the steep peak at 440 nm of the amplification curve. The plates are marked and their orientation is preserved through the polishing, coating, and assembly processes, so the similarity of the shapes of the parallelism curves for all three etalons could well arise from reproducible irregularities inherent in the coating process. Thus we speculate that the phase dispersion amplification of a relatively small wedge in the coating layers may be the origin of the parallelism changes.
We conclude that it is critical to take into account the effects of phase dispersion when designing broadband coatings for high-finesse FP systems. In our system, the unanticipated effects of the coatings are the main factor that limit the performance of the system. While some specialized FP systems require no relative phase shift over a particular bandwidth (e.g. Lemarquis & Pelletier (1996)), it seems that for general use tailoring the phase dispersion to minimize the amplification effects of equation 18 is highly desirable. Although it is unlikely that the competing demands of uniform high reflectance over a broad band and a phase dispersion that cancels the coating effects over the bandwidth can be exactly satisfied, it should be possible to find designs that provide a reasonable compromise.
6 Conclusions
In this paper we have presented the design of the SALT FP system, and the laboratory measured characteristics of the as-built system. The system provides spectroscopic imaging at any desired wavelength from 430 to 860 nm in four resolution modes from 300 to 9000. We discovered that the plate parallelism and gap and are wavelength dependent with maximum variation between wavelengths 600 to 720 nm; there is more apparent plate curvature than expected, leading to lower resolution, finesse, and throughput. We believe that all these effects arise from the design of the broadband reflectance coatings of the etalons. It is unfortunate that the line falls within the wavelength region of maximum gap and parallelism variation. This will require more care in operating the etalons for many scientific programs, but will not seriously compromise the resulting data. The design goals for the system were based on surveys of the SALT user community, and represent typical but not mandatory requirements for a broad range of scientific investigations. The as-built etalons approach but do not fully meet these goals. The performance of the system is certainly sufficient to satisfy the needs of a very wide variety of programs for the SALT observers, and users will undoubtedly design future investigations to exploit the capabilities of the system.
The SALT FP system is presently in its performance verification phase at the telescope and the detailed on-sky performance of this system will be presented in a subsequent paper.
References
- Swat et al. (2003) Swat, Arek, O’Donoghue, Darragh, Swiegers, Jian, Nel, Leon, Buckley, David A. H. 2003, Proceedings of the SPIE, 4837, 564
- Atherton et al. (1981) Atherton, P.D., Reay, N.K., Ring, J. & Hicks, T.R. 1981, Optical Engineering, 806, 20
- Burgh et al. (2003) Burgh, Eric B., Nordsieck, Kenneth H., Kobulnicky, Henry A.,Williams, Ted B., O’Donoghue, Darragh, Smith, Michael P., Percival, Jeffrey W. 2003, Proceedings of the SPIE, 4841, 1463
- Cecil (2000) Cecil, G. N. 2000, Proceedings of the SPIE, 400, 83
- Ciddor (1968) Ciddor, P.E. 1968, Applied Optics, 7, 2328
- Fowles (1989) Fowles, G.R. 1989, Introduction to Modern Optics, (Dover Publications, INC., NY)
- Giacomo (1958) Giacomo, P. 1958, Le Journal De Physique Et Le Radium, 19, 307
- Kobulnicky et al. (2003) Kobulnicky, Henry A., Nordsieck, Kenneth H., Burgh, Eric B., Smith, Michael P., Percival, Jeffrey W., Williams, Ted B., O’Donoghue, Darragh 2003, Proceedings of the SPIE, 4841, 1634
- Lemarquis & Pelletier (1996) Lemarquis, F. & Pelletier, E. 1996, Applied Optics, 35, 4987
- Mahapatra & Mattoo (1986) Mahapatra, D.P., & Mattoo S.K. 1986, Applied Optics, 25, 1646
- Netterfield et al. (1980) Netterfield, R. P., Schaeffer, R. C. & Sainty, W. G. 1980, Applied Optics, 19, 3010
- Nordsieck et al. (2003) Nordsieck, Kenneth H., Jaehnig, Kurt P., Burgh, Eric B., Kobulnicky, Henry A., Percival, Jeffrey W., Smith, Michael P. 2003, Proceedings of the SPIE, 4843, 170
- Ramsay & Ciddor (1967) Ramsay, J.V. & Ciddor, P.E. 1967, Applied Optics, 6, 2003
- Schommer et al. (1993) Schommer, R.A., Bothun, G.D., Williams, T.B., & Mould, J.R. 1993, AJ, 105, 97
- Smith et al. (2006) Smith, Michael P., Nordsieck, Kenneth H., Burgh, Eric B.,Percival, Jeffrey W., Williams, T. B., O’Donohue, Darragh, O’Connor, James, Schier, J. Alan 2006, Proceedings of the SPIE, 6269, 62692A
- Stobie, Meiring & Buckley (2000) Stobie, Robert, Meiring, Jacobus, Buckley, David A. 2000, Proceedings of the SPIE, 4003, 355
- Vaughan (1989) Vaughan, J. M. 1989, The Fabry-Pérot Interferometer, (Adam Hilger, Philadelphia)