Final results on oscillation from the CHORUS experiment
Abstract
The final oscillation analysis of the complete set of data collected by CHORUS in the years 1994–1997 is presented. Reconstruction algorithms of data extracted by electronic detectors were improved and the data recorded in the emulsion target were analysed by new automated scanning systems, allowing the use of a new method for event reconstruction in emulsion. CHORUS has applied these new techniques to the sample of 1996–1997 events for which no muons were observed in the electronic detectors. Combining the new sample with the data analysed in previous papers, the overall sensitivity of the experiment to the appearance is thus improved. In a two-neutrino mixing scheme, a 90% C.L. upper limit of is set for large , improving by a factor 1.5 the previously published CHORUS result.
keywords:
Oscillation, neutrino , Tau lepton appearancePACS:
14.60.Pq1 Introduction
The CHORUS experiment was designed to search for oscillations through the observation of charged-current interactions followed by the decay of the lepton, directly observed in a nuclear emulsion target. The experiment aimed at achieving maximum sensitivity on the effective mixing angle for values of the mass parameter larger than . This particular choice was based on the hypothesis that the neutrino mass could contribute to the solution of the Dark Matter puzzle [1, 2]. A short-baseline experiment in the CERN SPS Wide Band Neutrino Beam [3] was well suited for this search. Another experiment, NOMAD, used the same beam and searched for appearance using a purely electronic technique [4].
The CHORUS experiment took data from 1994 to 1997. A first phase of data analysis (‘Phase I’) was performed and no evidence for oscillations was found [5, 6, 7]. Owing to several improvements in automated emulsion scanning and in the event recontruction, it was considered worthwhile to perform a new and more complete analysis (‘Phase II’) of the data collected in the 1996–1997 period.
In this paper, we report the analysis performed on the events for which no muons were observed in the electronic detector ( events). In particular, a dedicated search for decays into three charged hadrons was also performed. Combining this new sample with the data samples analysed and published in previous papers, i.e. with a muon observed in the electronic detector () for the whole period of data taking and a small sample collected in 1994–1995, leads to an improvement of the CHORUS sensitivity to appearance by a factor 1.5 and to appearance by a factor 1.2.
Although it is now established that oscillations occur at , this paper intends to show the capabilities of an hybrid emulsion experiment and that the goal for which CHORUS was designed has been reached.
2 The experimental setup
The CERN SPS Wide Band Neutrino Beam consists essentially of with a contamination of about 5.1% , 0.8% of , and 0.2% of , while the flux of is negligible [8]. The average neutrino energy is 26 GeV, well above the production threshold.
The CHORUS detector is a hybrid setup which combines a nuclear emulsion target with various electronic detectors such as trigger hodoscopes, a scintillating fibre tracker system, a hadron spectrometer, electromagnetic and hadronic calorimeters, and a muon spectrometer [9].
Thanks to its micrometric granularity, nuclear emulsion allows a precise three-dimensional reconstruction of the neutrino interaction vertex as well as of the decay vertices of associated short-lived particles. It is a powerful detector technique to directly observe decays which, in this experiment, occur on average at a distance of mm from the interaction vertex.
The scintillating fibre tracker system consists of two components: the target tracker (TT), which is the major tool for locating in the emulsion the region where a neutrino interaction has occurred, and the diamond tracker (DT), a set of trackers associated with the hadron spectrometer.
The hadron spectrometer measures the charge and momentum of charged particles using an air-core magnet. The calorimeter is used to determine the energy of electromagnetic and hadronic showers. The magnetized iron muon spectrometer determines the charge and momentum of muons.
The emulsion target has an overall mass of 770 kg and is segmented into four stacks. Each stack consists of eight modules with 36 plates of size 36 cm 71 cm. Each plate has a 90 plastic base coated on both sides with a 350 emulsion layer. Each stack is followed by three interface emulsion sheets having a 100 emulsion layer on both sides of a 800 thick plastic base, and by a set of TT planes. The TT predicts particle trajectories on the interface emulsion sheets with a precision of about 150 in position and 2 mrad in track angle.
The emulsion scanning is performed by computer-controlled, fully automated microscope stages equipped with a CCD camera and a read-out system called ‘track selector’ [10, 11]. The last generation of automated microscopes used in CHORUS experiment is the UTS (‘Ultra Track Selector’) [12]. In order to recognize track segments in the emulsion, a series of tomographic images is taken by focusing at different depths in the emulsion layer. The digitized images at different levels are shifted according to the predicted track angle and then added. The presence of aligned grains forming a track is detected as a local peak in the grey-level of the summed image. The track-finding efficiency is higher than 98% for track slopes less than 400 mrad [11].
3 The event reconstruction
The event reconstruction algorithms have been improved significantly with respect to the Phase I analysis described in detail in Ref. [7]. Here, we only summarize the essential points.
The event reconstruction starts with the pattern recognition in the electronic detectors. Tracks are found in the TT, in the calorimeter and in the muon spectrometer. If a muon is detected in the downstream detectors the event is classified as , otherwise it is called . Vertices are reconstructed by the electronic detectors using the points of closest approach of the tracks in the TT immediately downstream from the target. The main vertex is the most upstream one and is selected if it contains either a muon or a hadron surviving criteria which differed in the two phases 111 In Phase I, events, at least one hadron with a momentum less than 20 was required. In Phase II the most isolated hadron was selected regardless of its charge and momentum. . Such particles or the muon are used as so-called ‘scan-back’ tracks. The impact points of the scan-back tracks are predicted on the most downstream interface emulsion sheets, to initiate their follow back in emulsion.
As in previous analyses the event reconstruction in emulsion starts with a procedure called ‘vertex location’. As a first step, all the tracks in the interface emulsion sheets within an area of 1 centred on each scan-back track prediction are collected.
The correct association of emulsion tracks with TT tracks, both in position and direction, requires a precise alignment of the interface emulsions with respect to the fibre-trackers. The alignment parameters are obtained by finding the best match between the full set of TT predicted tracks and the full set of collected emulsion tracks. Once an emulsion track is associated to a scan-back track, mainly on the basis of their common direction, it is followed upstream from one emulsion plate to the next within a greatly reduced scanning area as the resolution improves. In the emulsion stacks, the scanning area reduces to a square of 50 side. The plate-to-plate alignment is first obtained by a coarse adjustment of reference marks, and, as the scanning procedure continues, is refined by aligning track maps measured in subsequent plates. For this alignment we used tracks of particles generated by neutrino interactions during the whole data taking, of cosmic rays and of muons coming from neighbouring beams. The scan-back procedure stops when a searched track is not found in two consecutive plates. The most downstream one is defined as the ”vertex plate”. This procedure for locating the vertex has an efficiency of 34% (Table 1).
Once the vertex plate is found, a new scanning technique is applied on the 1996–1997 data sample. Originally developed for the DONUT experiment [16], this technique, called ‘NetScan’ [17], is described in detail in Ref. [13, 18] together with the event location procedure. Its application to the sample is also described in the following section 222 The NetScan technique has been used also for the data sample, mainly to search for charmed particles decays [14, 15]. .
3.1 The NetScan technique
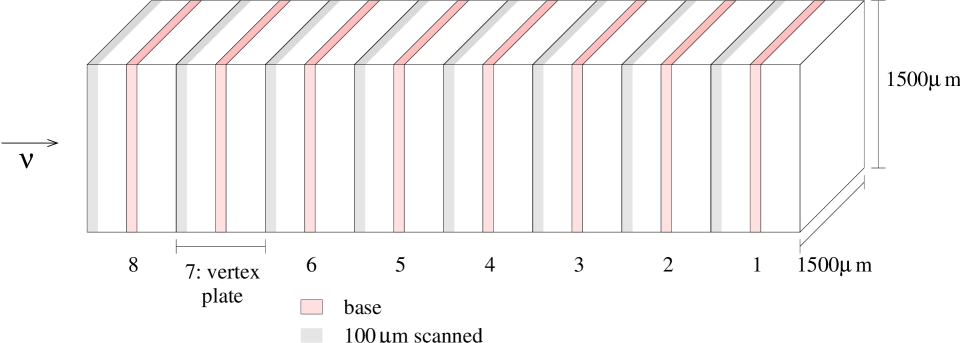
Once the vertex plate is identified, the UTS performs a scan of the emulsion volume around the vertex position, recording, for each event, all track segments within 400 mrad with respect to the orthogonal direction of the plates. In each plate only the most upstream 100 part is scanned. The scanned volume is wide and 6.3 mm long in the beam direction, corresponding to eight emulsion plates. This volume contains the vertex plate itself, the plate immediately upstream, and the six plates downstream the vertex plate. The plate upstream the vertex acts as a veto for passing through tracks. The six plates downstream from the vertex act as decay volume and are used to detect the tracks of the decay daughters. The scan area is centred on the scan-back track stopping point.
The number of track segments (coming from particles induced by neutrino interactions, cosmic ray particles and muons from neighbouring beams) found in each plate depends on the position of the NetScan volume with respect to the beam centre and on average is .
The task of the NetScan event reconstruction is to select the segments belonging to the neutrino interaction under study, out of this large number of background track segments. To this end, a first plate–to–plate alignment is performed by comparing the pattern of segments in a plate with the corresponding pattern in the next upstream plate. Each segment found in one plate is extrapolated to the next plate where a matching segment is looked for within about 4 in position (3 of alignment resolution) and 20 mrad in angle. If none is found, the straight-line extrapolation is tried one plate further upstream.
A second and more accurate inter-plate alignment is performed using tracks passing through the entire volume after the connection of all matched segments. These tracks come from muons associated with the neutrino beam or with charged particle beams in the same experimental area. After this fine alignment, the distribution of the residuals of the segment positions with respect to the fitted track has a standard deviation width of about 0.45 .
After rejection of isolated track segments, typically about 400 tracks remain in the volume. The majority of these are tracks (mainly Compton electrons and -rays) with a momentum less than 100 . These background tracks are rejected on the basis of the of a straight-line fit to the track segments. The final step is the rejection of the tracks not originating from the scan volume. After this filtering, the average number of remaining tracks is about 40. The number of connected tracks and the position and slope residuals provide a good measurement of the alignment quality. About 84% of the events passes the quality cuts (‘NetScan acquisition accepted’).
The reconstruction algorithm then tries to associate the tracks to vertices with a ‘pair-based’ method: after selecting pairs of tracks having minimal distance less than 10 , a clustering among them is performed and vertex points are defined. After this clustering, a track is attached to a vertex if its distance from the vertex point (called hereafter ‘impact parameter’) is less than 3 . At the end of the procedure, one defines a primary vertex (and its associated tracks) and in case one or more secondary vertices to which ‘daughter tracks’ are attached.
About 77% of the events, where the NetScan acquisition was accepted, have a vertex reconstructed in the NetScan volume. The loss is accounted for by the fact that a background track might have been selected for the scan-back procedure. The numbers of events at the various stages of the procedure are given in Table 1.
| Stage of reconstruction | number of events |
|---|---|
| Interface emulsion scanned | 102544 |
| Vertex plate found | 35039 |
| NetScan acquisition accepted | 29404 |
| Vertex reconstructed | 22661 |
3.2 The decay search
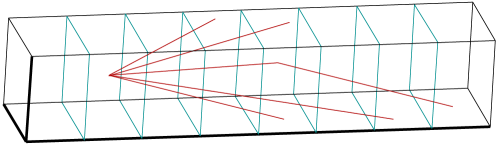
Once tracks and vertices are reconstructed in the NetScan volume, a search for decay topologies is performed. In Fig. 1 a sketch of a Monte Carlo event inside the NetScan volume is shown: a (not drawn) interacts producing a lepton and other particles. After three plates, the lepton decays producing one charged particle (kink topology, i.e. an observed abrupt change of direction in the track).
In the decay search an emulsion track is called a ‘TT-confirmed track’ if its trajectory matches that of a TT reconstructed track, or if it is connected to a sequence of TT hits. A reconstructed vertex is a ‘TT-confirmed vertex’ if it contains at least one TT-confirmed track.
The decay search is done in two stages:
-
i)
an automated search on the whole sample;
-
ii)
a computer-assisted visual inspection on the sample selected in the previous stage.
After the automated search, 754 events are selected as belonging to one of three categories:
-
•
Short decays. Events for which there is only one TT-confirmed vertex in the NetScan volume and at least one isolated TT-confirmed track having an impact parameter with the primary vertex inside the range .
-
•
Long decays. Events with a one-prong decay topology (‘kink’) directly observed in the NetScan volume. This occurs when the parent track is observed in at least one emulsion plate. The daughter track must be TT-confirmed and its minimal distance to the parent track is required smaller than . In case a primary vertex is reconstructed, it is required to be TT-confirmed and the parent track must have an impact parameter less than with this vertex.
-
•
Multiprong decays. Events in which NetScan reconstructs at least two vertices, the secondary vertices being candidates for multiprong decays. The quality of the vertices is ranked according to the number of TT-confirmed tracks originating from them and it is used as a parameter for the selection of multiprong decay topology. The parent angle, in the case of a neutral particle decay deduced from the line connecting the primary and secondary vertices, should be within 400 mrad from the beam direction.
The computer-assisted visual inspection aims at clearly establishing the topology of the primary and secondary vertices. To avoid ambiguous topologies, the flight length of the parent track is required to be larger than 25 . For vertices which are not both TT-confirmed, a more stringent cut, which is a function of the flight length of the assumed parent, is applied to remove the random association of two unrelated vertices.
An event is selected if one of the following topologies is detected:
-
•
C1 : a track with a kink (interaction or decay) of at least 50 mrad
-
•
C3 : a track with a three-prong (interaction or decay) topology
-
•
V2 : a two-prong neutral interaction (or decay) is detected
The numbers of events observed in these topologies are shown in Table 2. Decays of the lepton are characterized by either one or three charged particles in the final state, C1 or C3. The events with a V2 topology will be used for background calculations.
3.3 Background evaluation
Physical processes that can mimic a decay are:
-
•
decays of charmed charged particles like , and , if the primary is not identified and the charge of the charmed particle is not determined;
-
•
white interactions, i.e. interactions of hadrons without any other visible activity at the vertex (recoil or Auger electrons);
-
•
decays which affect only the C1 topology.
The charmed particle contribution to the background has been evaluated from production cross-section of , and in neutrino interactions and their decay branching fractions into one or three charged particles [19]. The rate of production in neutrino charged-current interactions has been measured in CHORUS [14]. Using as the normalization the observed number of events with a V2 topology given in Table 2, the number of one and three-prong decays from charm particles in the sample is given by
where or , is the ratio of charged charm and cross-sections [19] and , and are the efficiencies in detecting the specific topology, including the branching ratios, computed by a Monte Carlo simulation: , .
The number of V2 events has been corrected to account for and decays [18]. This yields a prediction of and .
One-prong interactions without visible activity (‘white kinks’, WK) were generated and processed through the full simulation chain assuming a hadron interaction length m [20]. In the sample, the ratio of three-prong to one-prong interactions, both with visible activity, was measured to be . This fraction was assumed to be the same also in absence of recoil or Auger electrons [18].
The results are summarized in Table 3.
3.4 Maximum number of detectable
We define as the number of events that would be observed if their detection efficiency and the oscillation probability would be equal to 1. It can be evaluated as:
where is the neutrino flux, (93807) is the number of charged-current (CC) neutrino interaction events (used only for the flux determination) detected in the 1996–1997 run for which NetScan acquisition is completed, and their detection efficiency. is the ratio between the average total and CC cross-sections. Efficiencies have been calculated by Monte Carlo. We define as the probability to locate a vertex and as the reconstruction and selection efficiencies for the various decay channels. For each topology, the number of events that would be observed if the oscillation probability would be equal to 1 is:
where the index runs over the various decay modes contributing to that topology. Branching ratios, efficencies and are given in Table 4. Note that muonic decays with a misidentified muon also contribute to the C1 topology.
3.5 Post-scan selection and final data sample
The signal to background ratio, hence the sensitivity to oscillation, can be improved if, in addition to the topology, other information is used, such as:
-
•
the angle between the parent track and the estimated direction of the hadronic shower
-
•
the length of the parent track
-
•
the mean angle of the daughter tracks with respect to the parent track
-
•
when available, the momentum and charge of a daughter particle
The purpose of the ‘post-scan’ analysis is to maximize the sensitivity to oscillation by an optimum combination of this information. The optimization was performed on Monte Carlo simulated samples of signal and background events [18] and led to the subdivision of the samples into different subclasses, depending on the observed topology.
3.5.1 The C1 topology
For the C1 topology, the transverse momentum with respect to the parent direction is useful for the rejection of WK background.
Two methods are available for momentum measurements: either with the DT of the hadron spectrometer or from the multiple Coulomb scattering (MCS) in the emulsion. The DT also measures the particle charge. The MCS method is used if no DT measurement is available and if the number of emulsion plates for the MCS measurement is greater than 6. The C1 sample has thus been divided into three subclasses:
-
•
momentum measurement from DT () which also yields a charge measurement of the sign of the charge which is important for the charm background rejection
-
•
momentum measurement from MCS ()
-
•
no momentum measurement
The first category has the highest sensitivity to search and the strongest background rejection. The events in which the daughter track has a positive charge are rejected. When the momentum is determined, a cut is applied on the transverse momentum ( ) of the daughter kink. A momentum-dependent cut on the flight length () is also applied. Fig. 2 shows a comparison between signal and background in the selected (I) and rejected (II) regions in the versus plane. All decay vertices beyond 3 mm or with a parent momentum below 2 were rejected because white kink interactions are likely to populate these regions. For a momentum between 2 and 5 step functions were used for simplicity. The effects of this selection on the background rejection and efficiency are shown in Table 5.
In addition, the samples have been further subdivided into three ranges, where is defined as the angle in the transverse plane between the parent track and the mean direction of the other primary tracks after exclusion of the one which makes the largest angle with the parent track (the track with a cross in Fig. 3). A comparison between the distributions of in charm and samples is shown in Fig. 4. The signal is characterized by a larger mean value of .
3.5.2 The C3 topology
For the C3 topology, the fraction of events for which the three daughter particles have their momentum measured is too small to lead to a useful discrimination. Instead, use is made of the fact that the mean angle of the daughter tracks relative to the parent is strongly correlated to the inverse of the Lorentz boost factor . Thus, the product of the parent flight length and is a good parameter to discriminate particles of different lifetimes (or apparent lifetime in the case of white interactions). The C3 sample has been divided into “short ” and “long ” subsamples, separated by a cut value . Fig. 5 shows a comparison of the charm and samples: the short sample is enriched in decays. These categories are further divided as above according to ranges. The sample most sensitive to a signal corresponds to events with short and large .
Once the different categories are defined the same subdivision is applied to the candidate events. This is done according to the ‘blind analysis’ prescriptions, in order to minimize the possibility of biases in the experimental result.
Table 6 shows the number of simulated and observed events in C1 and C3 topologies of the new sample, together with data from the Phase I analysis which consist of two samples [7]:
-
•
events from the 1994–1997 data taking. The background reduction is obtained by applying a cut on the transverse momentum ( ) of the kink daughter. The kink must occur within five plates downstream from the neutrino interaction vertex plate. The estimated background is events and the maximum number of events is (as reported in Table 2 of [7]). The background is much smaller than for the sample because of the low probability of a wrong measurement of the charge in the muon spectrometer. No candidate is observed.
-
•
one-prong events from the 1994–1995 data taking. Table 2 of [7] gives the background and the maximum number of oscillated events for the whole 1994–1997 sample. The 1996–1997 data has been reanalysed, as reported in this paper. The 1994–1995 data correspond to an estimated background of events and a maximum number of oscillated events of . No candidate is observed.
The errors on the expected background are evaluated by taking into account the limited statistics of the Monte Carlo sample and the errors on cross-sections and branching ratios.
4 Results
From the number of observed candidates, the expected background and the number of signal events expected for full oscillation it is possible to compute, for each subsample of Table 6, the 90% C.L. upper limit on the appearance probability using a frequentist statistical approach, the so-called Feldman and Cousins unified approach [21].
To evaluate the sensitivity of the experiment, we have simulated a large number of experiments taking into account Poisson fluctuations of the expected background. The sensitivity is then defined as the average of the 90% C.L. upper limits on the appearance probability of all these ”experiments”.
The last two columns in Table 6 show the sensitivities of each subsample and an index in decreasing order of sensitivity. The subsamples are then combined, with the same prescriptions used by the NOMAD Collaboration [4]. After including the 11th most sensitive subsample, the global sensitivity changes only at the percent level. Similarly for the search. In evaluating the global sensitivity, we thus consider only the 11 most sensitive subsamples for both searches.
4.1 oscillation
Fig. 6 (left) shows the distribution of the upper limits (at 90% C.L.) obtained by simulating 800 experiments. The average value, , corresponds to the CHORUS sensitivity to appearance.
The 90% C.L. upper limit on the appearance probability obtained from the data is
indicated by a vertical line in Fig. 6. It is in agreement with the expected sensitivity. In fact, in absence of signal events the probability to obtain an upper limit of or lower is , which means that the number of observed events is compatible with the estimated background. The above result improves by a factor the previously published limit [7].
In a two-neutrino formalism, the above upper limit corresponds to the exclusion region in the (, ) oscillation parameter plane shown in Fig.7 (left) and to the limit for large .
The upper limit obtained by NOMAD [4] is more stringent than the CHORUS one at large , whereas for lower than the upper limit is improved by CHORUS owing to its higher efficiencies at low neutrino energies.
4.2 oscillation
The SPS neutrino beam contains a 0.8% contamination. Assuming that all observable would originate from this contamination, the above result translates into a limit on the appearance probability. The difference in energy between the ( GeV) and ( GeV) components leads to a different shape of the exclusion plot in the oscillation parameter plane.
Fig. 6 (right) shows the upper limit distribution obtained by simulating 800 experiments. The average value, , corresponds to the sensitivity to the appearance probability.
The 90% C.L. upper limit on the appearance probability obtained from the data is
indicated by a vertical line in Fig. 6. In absence of signal events, the probability to obtain an upper limit of or lower is . The above result improves by a factor the previously published limit [7]. The improvement is smaller than in the case for two reasons. The first one is the variation of the expected contamination provided by a new simulation of the beam (reduced by a factor 0.85) [23]. Furthermore, in the case the efficiency improved predominantly at low neutrino energies and the harder spectrum makes this improvement less effective. This reason also explains the large difference in the limit relative to NOMAD. In a two-neutrino formalism, the above upper limit corresponds to the exclusion region in the (, ) oscillation parameter plane shown in Fig.7 (right) and to the limit for large .
5 Conclusions
The final result of the search for appearance with the CHORUS experiment has been presented. A 90% C.L. upper limit of was set for the appearance probability, improving by a factor 1.5 the previously published CHORUS result. In a two-neutrino mixing scheme, this result corresponds to the limit for large . With respect to previous CHORUS results, we have also improved by a factor 1.2 the upper limit on the () oscillation probability.
Acknowledgements
We gratefully acknowledge the help and support of the neutrino beam staff and of the numerous technical collaborators who contributed to the detector construction, operation, emulsion pouring, development, and scanning. The experiment has been made possible by grants from the Institut Interuniversitaire des Sciences Nucléaires and the Interuniversitair Instituut voor Kernwetenschappen (Belgium), the Israel Science Foundation (grant 328/94) and the Technion Vice President Fund for the Promotion of Research (Israel), CERN (Geneva, Switzerland), the German Bundesministerium für Bildung und Forschung (contract numbers 05 6BU11P and 05 7MS12P) (Germany), the Institute of Theoretical and Experimental Physics (Moscow, Russia), the Istituto Nazionale di Fisica Nucleare (Italy), the Promotion and Mutual Aid Corporation for Private Schools of Japan and Japan Society for the Promotion of Science (Japan), the Korea Research Foundation Grant (KRF-2003-005-C00014) (Republic of Korea), the Foundation for Fundamental Research on Matter FOM and the National Scientific Research Organization NWO (The Netherlands), and the Scientific and Technical Research Council of Turkey (Turkey). We gratefully acknowledge their support.
References
- [1] H. Harari, Phys. Lett. B216 (1989) 413.
- [2] J. Ellis, J.L. Lopez and D.V. Nanopoulos, Phys. Lett. B292 (1992) 189.
- [3] E. H. M. Heijne, CERN Yellow Report 83-06 (1983).
- [4] P. Astier et al., NOMAD Collaboration, Nucl. Phys. B611 (2001) 3.
- [5] E. Eskut et al., CHORUS Collaboration, Phys. Lett. B424 (1998) 202.
- [6] E. Eskut et al., CHORUS Collaboration, Phys. Lett. B434 (1998) 205.
- [7] E. Eskut et al., CHORUS Collaboration, Phys. Lett. B497 (2001) 8.
- [8] B. Van de Vyver and P. Zucchelli, Nucl. Instr. and Meth. A385 (1997) 91.
- [9] E. Eskut et al., CHORUS Collaboration, Nucl. Instr. and Meth. A401 (1997) 7.
- [10] S. Aoki et al., Nucl. Instr. and Meth. B51 (1990) 466.
- [11] T. Nakano, Ph.D. thesis, Nagoya University, Japan (1997).
- [12] T. Nakano, Proc. Int. Europhysics Conf. on High Energy Physics, Budapest, Hungary (2001).
- [13] M. Güler, Ph.D. thesis, METU, Ankara, Turkey (2000).
- [14] G. Onengut et al., CHORUS Collaboration, Phys. Lett. B613 (2005) 105.
- [15] G. Onengut et al., CHORUS Collaboration, Phys. Lett. B614 (2005) 155.
- [16] K. Kodama et al., Nucl. Instr. and Meth. A493 (2002) 45.
- [17] N. Nonaka, Ph.D. thesis, Nagoya University, Japan (2002).
- [18] L. Scotto Lavina, Ph.D. thesis, Universitá degli Studi di Napoli “Federico II” (2005).
- [19] A. Kayis-Topaksu et al., CHORUS Collaboration, Phys. Lett. B626 (2005) 24.
- [20] A. Satta, Ph.D. Thesis, University of Rome (2001).
- [21] G.J. Feldman and R.D. Cousins, Phys. Rev. D57 (1998) 3873.
- [22] M. Apollonio et al., CHOOZ Collaboration, Eur. Phys. J. C27 (2003) 331.
- [23] I.I. Tsukerman, CHORUS internal note 2000010 (2002).


