11institutetext: Department of Physics,
Lancaster University,
Lancaster,
LA1 4YB,
UK.
Studies of CP-conserving and CP-violating mixing
parameters with the D0 experiment
James Walder (for the D0 Collaboration)
Abstract
This paper summarises the recent results of the Run IIa D0 experiment at the
Tevatron Collider at Fermilab on the observable parameters of the meson.
A measurement of the branching fraction is reported, which provides an
estimate of the width difference .
Through the decay the width difference
is extracted,
and for the first time a constraint is set on the CP-violating phase ,
although a four-fold ambiguity remains. This result is combined with other D0
measurements to yield ,
.
pacs:
13.25.HwDecays of bottom mesons and 11.30.Er Charge conjugation, parity, time reversal, and other discrete
symmetries and 14.40.Nd Bottom mesons
1 Introduction
The standard model (SM) of particle physics, with three families of quarks
contains the CKM matrix which contains one complex phase that governs
CP-violation.
The system can be described by the Schrödinger equation:
(7)
where from CPT invariance: , and
.
The light and heavy mass eigenstates are defined as and
respectively, and relate to the flavour eigenstates through
,
, where
.
Under the assumption of no CP-violation, the light and heavy mass eigenstates
correspond to the CP-even and CP-odd eigenstates respectively.
The mass difference,
is sensitive to the effects of new physics, whereas the CP width difference
does not provide sensitivity to new physics, as is dominated by
tree-level processes. However, the width difference is highly sensitive
to possible effects of new physics through the CP-violating phase angle
, which in the SM is
expected to be small (), but may be enhanced through fourth
generation models to – Hou:2006mx .
The D0 detector is a general purpose spectrometer and
calorimeter dzerodet .
The significant components for these measurements are the muon chambers,
calorimeters and central tracking region. Enclosed within a 2 T superconducting
solenoid is a silicon micostrip tracker (SMT) and central fiber tracker (CFT)
for vertexing and
tracking of charged particles that extends out to a pseudorapidity of ,
where , and is the polar angle.
The three liquid-argon/uranium calorimeters provide coverage up to
. The muon system consists of one tracking layer and
scintillation trigger counters in front of 1.8 T iron toroids with two layers
after the toroids. Coverage extends to .
Results given here correspond to data samples recorded by the D0 detector of
integrated luminosities –fb-1.
2 Mass difference
In 2006 the D0 experiment made the first direct double-sided
constraint d0mixing on the
oscillation frequency of the meson in the semileptonic
decays111Charge-conjugate states are implied throughout. of , , .
A limit of ps-1 at CL was measured. A
more recent measurement cdfmixing , which includes hadronic modes of
meson decay, gives the precision value ps-1.
3 Width difference
3.1
The decay of mesons to produces a CP-even final
state cpeven , and under certain theoretical assumptions, the decay
is also predominately CP-even, up to222It
should be noted that some estimates consider a CP-odd fraction up to .dsdseven .
Under these assumptions, the branching fraction of this decay can be related to
the CP width difference
by:
(8)
The D0 experiment performed a measurement bsdsds using the decay chain , ,
, to extract the
branching fraction and the width difference
.
To reduce detector related systematics effects, the above process was
normalised to to the decay ,
, , which has a similar
final-state to the main process. From a fit to the invariant mass of the
mass peak, events were estimated for the normalisation data.
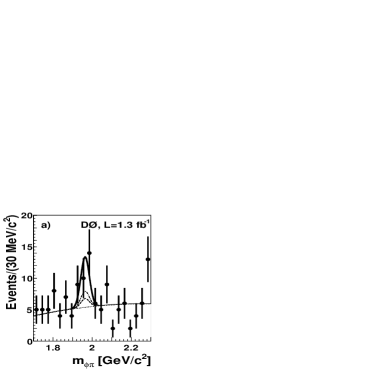
For the signal decay, events were estimated in data, from a
two-dimensional fit to the invariant mass of mesons from
, and mesons in the decay .
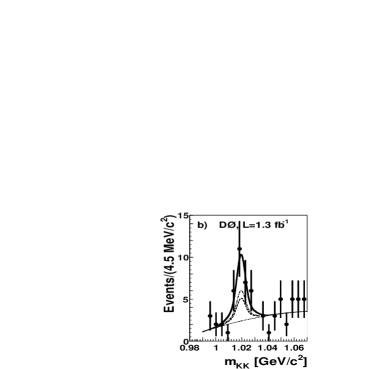
Figures 1 and 2 shows the result of the fitting
procedure projected onto the signal regions of the mass variable not plotted.
Using data and Monte Carlo
(MC) simulations, background events were estimated to contribute to the
signal number.
The difference between the efficiencies to reconstruct the signal and
normalisation processes is determined in MC, and corrections applied to the
in determination of the result.
Figure 1: Invariant mass distribution of the meson projected
onto the signal region of the fitting procedure. The curves are the projected
fit results for the: total fit (solid); polynomial background contribution
(dotted); non-peaking background component (dashed); background peaking in the
mass region of both the and mesons (dash-dotted).Figure 2: Invariant mass distribution of the meson from , projected
onto the signal region of the fitting procedure. The curves are the projected
fit results for the: total fit (solid); polynomial background contribution
(dotted); non-peaking background component (dashed); background peaking in the
mass region of both the and mesons (dash-dotted).
The branching fraction was measured to be:
Under the assumptions leading to Eq. 8, the width difference is
estimated to be:
(9)
3.2
The decay contains final states with both CP-even and
CP-odd components, which may be separated using a lifetime-dependent
angular analysis, leading to a measurement of the lifetime difference. If the
lifetime difference is sufficiently large, the CP-violating phase
can also be extracted.
The measurement jpsiphi was performed in the decay of untagged
mesons: , ,
with a set of data corresponding to an integrated luminosity of fb-1.
From events
in the final selection were estimated from the fitting procedure to
originate from the decay. The likelihood fitting procedure uses the
angle between the kaon and in the meson rest frame, and the
tranversity polar and azimuthal angles of the muon in the rest frame
to separate out the CP-eigenstates.
The background is separated into contributions of: prompt, from directly
produced mesons and additional track from hadronisation; and
non-prompt, where mesons are produced from mesons decays, but
combined with a meson from track from hadronisation or multi-body
decays of the meson.
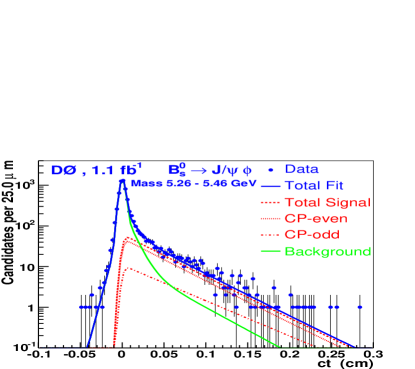
In Fig. 3 the contributions of the two CP-eigenstates and
backgrounds are shown for the proper decay-lengths of meson candidates.
Figure 3: Proper decay-length of the meson candidates in . The curves describe: the total fit in blue (solid); the total signal
contribution in red (dashed) with the CP-even (dotted) and CP-odd
(dash-dotted) separated; and the background in green (lower solid).
Under the assumption of no CP-violation , the maximum
likelihood fit yields
4 CP-violating phase
If there exists a sizeable width difference in the meson system, there is
sensitivity to the CP-violating phase angle through the untagged
time-dependent width
.
From the same analysis described above, the constraint on
was removed and this parameter allowed to float, and the fitting
procedure was repeated.
In this case there exists a four-fold ambiguity in the results, due to a
sign reversal of with the simultaneous
flip of the strong phase angles and which
appears in the likelihood fitting procedure.
The average lifetime extracted from the fit is
and for the case , :
(12)
and in the case , :
(15)
5 Combination results
Using the results from the analysis with the mixing measurement cdfmixing and the world-average flavour
specific lifetime, which includes a D0 measurment d0wafstau , and an
additional constraint described below,
an improved estimate of the CP-violating phase value was obtained combination .
Two charge asymmetry measurements by the D0 experiment are used in forming the
additional constraint.
In Ref. bsmumu , the same-sign di-muon charge asymmetry, defined as
was measured, and from this asymmetry value extracted:
(16)
In Ref. bsmuds the charge asymmetry value from semileptonic decays from
, was measured from which the value
extracted:
(17)
Together, Eqs. 17 and 16 are almost independent
and can be combined to provide the current best limits on :
(18)
This charge asymmetry value, with the measurement cdfmixing of , is used to provide the additional constraint Beneke:2003az :
(19)
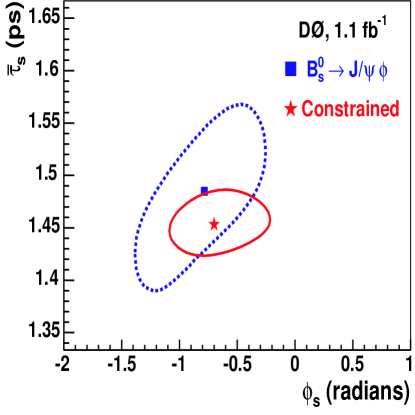
The fit to the data was repeated with this constraint, and
the results of which are shown as projections in Fig. 4
for the contour of versus and in
Fig. 5 for versus .
The contours are for the change in likelihood value , which corresponds to a CL.
Whilst the four-fold ambiguity on the sign of with
remains, the solution closest to the SM prediction yields:
Figure 4: Contours of ( CL) in the plane of
lifetime vs. CP-violating phase angle. In blue (dotted) the result from the
analysis, and in red (solid) the combination analysis
results, both shown for the sign combination whose result is closest to the SM
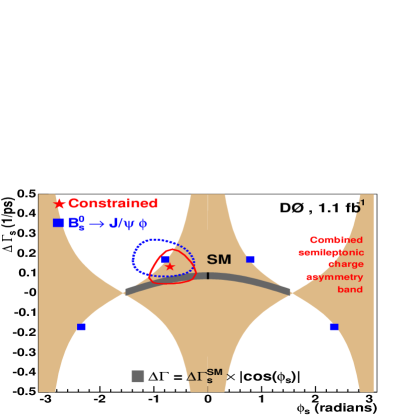
prediction.Figure 5: Contours of ( CL) in the plane of
width difference vs. CP-violating phase angle for solutions with sign
combination closest to the SM prediction of the analysis
(blue, dotted), and the results of the combination analysis (red, solid).
The four solid (blue) squares represents the central values from the showing the four-fold ambiguity.
The SM prediction is shown as the black vertical bar, and the dark band is the
result of ,
ps-1ul .
The lighter shaded area corresponds to the result of Eq. 19.
6 Summary
The meson now has information regarding all its observable parameters,
be that in precision measurements (i.e. , ), or a
constraint, such as in .
Whilst no evidence for beyond standard model effects are present, with
increased luminosity and improvements in analysis techniques, the
available parameter space in which it may manifest is certainly diminishing.
References
(1)
W. S. Hou, M. Nagashima and A. Soddu,
Phys. Rev. D 76 (2007) 016004, arXiv:hep-ph/0610385.
(2) V. M. Abazov et al. [D0 Collaboration],
Nucl. Instrum. Meth. A 565 (2006) 463.
(3)
V. M. Abazov et al. [D0 Collaboration],
Phys. Rev. Lett. 97 (2006) 021802.
(4)
A. Abulencia et al. [CDF Collaboration],
Phys. Rev. Lett. 97 (2006) 242003.
(5)
I. Dunuetz et al., Phys. Rev. D 63, (2001) 114015.
(6)
R. Alexan et al., Phys. Lett. B 316, (1993) 567.
(7)
V. M. Abazov et al. [D0 Collaboration],
arXiv:hep-ex/0702049.
(8)
V. M. Abazov et al. [D0 Collaboration],
Phys. Rev. Lett. 98, (2007) 121801.
(9)
V. M. Abazov et al. [D0 Collaboration],
Phys. Rev. Lett. 97, (2006) 241801.
(10)
V. M. Abazov et al. [D0 Collaboration],
arXiv:hep-ex/0702030.
(11)
V. M. Abazov et al. [D0 Collaboration],
Phys. Rev. D 74, (2006) 092001.
(12)
V. M. Abazov et al. [D0 Collaboration],
Phys. Rev. Lett. 98, (2007) 151801.
(13)
M. Beneke, G. Buchalla, A. Lenz and U. Nierste,
Phys. Lett. B 576, (2003) 173.