reaction: HPGe detector response function and gamma-ray relative yields
Abstract
The 6.1, 6.9 and 7.1 MeV photon yields in the reaction with protons in the 1.32 to 1.42 MeV energy range were determined from the comparison between experimental and simulated spectrum. The gamma-ray spectra were measured with a HPGe detector which was 72.5 mm in diameter and 60.5 mm in length. The reaction kinematics and the detector response function were simulated by different programs using the Monte Carlo method. The relative photon yields were obtained from the least-squares fit of the experimental gamma-ray spectra to the convolution of the detector response function with the photon energy distribution arising from the reaction kinematics.
1 Introduction
The reaction is used in many areas, from detector guldbakke:90 ; croft:91a and dosimeter duvall:88 ; rogers:83 calibration to non destructive analysis of fluorine trace with PIGE jarjis:78 ; dieumengard:80 . It was noted by many authors spyrou:97 ; fessler:00 ; dababneh:93 ; croft:91b ; ding:02 ; ajzenberg-selove:77 that the available data as reaction cross section, photon yields, resonance energies are insufficient and in some cases inconsistent.
The HPGe response function for photons presents a strong dependence on energy due to the different dominant interaction processes according to the energy region. In some studies, the photon detector response is described by means of empirical functions jin:86 ; lee:87 , but this method cannot be extended to energies above those used to fit the empirical parameters. Monte Carlo simulation, owing to the increasing computer power, is a method in growing adoption buermann:93 , because of the detailed accounting of the physical interaction processes. We use Monte Carlo N-Particle, version 5 (MCNP5) mcnp to calculate the HPGe photon detector response function.
Nuclear structure properties along with the reaction mechanism and kinematics lead to Doppler broadening and shift of the emitted photons. A computer program was developed to simulate the gamma-ray line profile. The convolution of the simulated profile with the detector response function was fitted to the experimental spectra; from this fit, the high-energy gamma-ray yields in the reaction could be deduced, and the adequacy of the detector response function was tested.
2 Experimental method
The experiment was performed with the 1.7 MV Pelletron tandem accelerator of the Laboratório de Análise de Materiais por Feixes Iônicos (LAMFI) LAMFI located at Instituto de Física da Universidade de São Paulo, Brasil.
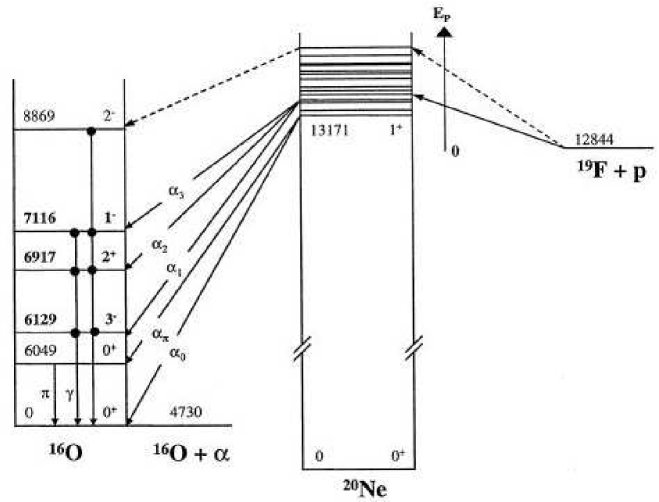
The target, consisting of about 260 g/cm2 CaF2 evaporated on a 0.1 mm Ta backing, was irradiated with protons in the 1.362 MeV to 1.416 MeV energy range. The proton energy loss in the target thickness is about 37 keV; hence, the proton resonances at 1.34 MeV and 1.37 MeV, with widths of 4.8(8) and 11.9(12) keV respectively, were excited spyrou:97 . Gamma-rays with energies: 6.1 MeV, 6.9 MeV and 7.1 MeV from transitions in the reaction product were observed; fig. 1 depicts the reaction mechanism.
The detector system consisted in a reverse-electrode closed-end coaxial HPGe detector, CANBERRA model GR6024, measuring 72.5 mm in diameter and 60.5 mm in length, and conventional electronics. The detector was placed with its axis along the beam direction, with the detector capsule at 12.2 cm from the target.
Thirteen measurements were done with incident proton energies varying from 1.362 MeV to 1.416 MeV, where the live counting time for each spectrum was 600 s. The proton irradiation current was around 50 nA and the beam size was about 3 mm.
3 Simulation
In order to calculate the observed photon spectrum in the HPGe detector, two different simulations were performed. First, the detailed reaction process was simulated to account for the Doppler broadening and shift of the photons emitted from the 16O. Then, a beam of photons with the energy distribution obtained in the first simulation was used in the MCNP5 source input card to determine the HPGE detector response function.
3.1 Reaction mechanism and emitted photon spectrum
In the reaction the gammas could be emitted in flight. In order to determine the direction and velocity of the 16O nuclei at the emission moment was made a Monte Carlo simulation of the reaction kinematics diogo .
The 20Ne resonant state fissions, with very short half life (s), populating different 16O excited states. The level energies, half-lives and gamma-ray transitions of the 16O excited states observed in the experiment are given in table 1 and, although much grater than 20Ne lifetime, are shorter than the time required for stopping the residual nuclei in the target. Hence, the observed gamma-ray peaks are Doppler shifted and broadened due to the 16O nucleus motion at the emission time.
| (keV) | Half life | (keV) |
|---|---|---|
| 6 129,89 (4) | 18,4 (5) ps | 6 128,63 (4) |
| 6 917,1 (6) | 4,70 (13) fs | 6 915,5 (6) |
| 7 116,85 (14) | 8,3 (5) fs | 7 115,15 (14) |
The reaction simulation starts by the random sorting of the target point where the interaction occurs, considering the reaction cross-section and the proton energy loss along its way through the target. In this point, 20Ne formation and prompt fission occurs; the resulting 16O oxygen nucleus, emitted in isotropically sorted direction in the center of mass reference frame, begins its trajectory along the CaF2 and tantalum target layers or into the irradiation chamber inner void. A different run is performed for each excited state, in order to follow the 16O kinetic energy loss and multiple scattering through its trajectory; this path is followed for a time interval whose length is sorted from the corresponding decay time distribution. Finally, the gamma-ray is emitted, assuming isotropic angular distribution, and the energy spectrum is obtained.
3.2 Detector response function
The HPGe detector response function was simulated using the tally F8:P (pulse height) of MCNP5, and a small (1 keV) channel width to compare this spectrum with the experimental one. A different photon source was used for each 16O gamma-ray transition, corresponding to the photon energy distributions calculated by the reaction simulation, as explained in the preceding sub-section. Therefore, the MCNP output tally is already the convolution of the detector response function with the reaction gamma-ray line profile, Doppler broadened and shifted.
The detector model included, besides the active Ge volume with its inner hole and the germanium crystal dead layers, many detector assembly elements: the beryllium window, aluminium internal and external capsules, the dewar filled with liquid nitrogen and the cold finger. Some details with low mass or placed away the incident radiation, like the pre-amplifier electronic circuits, were not considered. To achieve a good accuracy of the position and thicknesses of detector inner components, a radiography of the detector was taken. It was found that the detector symmetry axis was tilted relative to the detector capsule diogo , and the detector model was changed accordingly.
A simplified design of the irradiation chamber and its metallic support, with a detailed design of the target holder, were considered in the simulation. Scattered photons were followed inside a 3 m sphere centered in the target, covered by 5 cm concrete walls at all directions but the ground floor, which cut the bottom part of this sphere at 67 centimeters below the beam line.
The photon angular distribution was considered isotropic, but the small solid angle covered by the detector, about 0.3 sr, made a full isotropic simulation prohibitively time consuming. Therefore, the simulation was made in two steps:
-
1.
Spectrum simulation with the photons emitted with uniform angular distribution within the detector solid angle.
-
2.
Spectrum simulation with the photons emitted with uniform angular distribution in all directions outside those covered by the detector.
The 6.9 MeV and 7.1 MeV reaction gamma-rays calculated spectra did not change appreciably in the range of proton irradiation energies used in this experiment, because their short half-lives imply small paths in the target; therefore, the same simulated spectra were used in the comparison with the experimental data of all thirteen irradiations. On the contrary, the 6.1 MeV gamma-rays are emitted from a nuclear state with greater half-life, requiring detailed account of the target point where the interaction occurs, because the 16O nucleus can cross the boundaries of the CaF2 target layer either to the Ta backing or to the scattering chamber void. Since the distribution of the interaction point in the target changes with the proton incident energy, a spectrum for each one of the 13 different irradiation proton energies was calculated, for gamma-rays emitted inside the detector solid angle. For gamma-rays emitted outside the solid angle covered by the detector, whose contribution to the observed spectrum is secondary, a single simulation was performed.
4 Comparison between experiment and simulation
The electronics detector system contribution to the experimental gamma-ray spectrum resolution must be taken into account in the comparison with the experiment. The usual model for the dependence of the peak Full Width at Half Maximum (FWHM) with gamma-ray energy knoll could not be applied to this case because the very prominent escape peaks do not follow this model. We adopted a simplified model, assuming that all the peaks have the same FWHM, which becomes a fitting parameter. Therefore, the electronics noise function was assumed gaussian with the same FWHM for all energies.
The model used to compare the simulated and experimental spectra is a linear combination of the convolution of the simulated response functions of the preceding section with the electronics noise function plus a constant background:
| (1) |
where is the number of counts in the channel corresponding to energy , , and are the gamma-ray intensity parameters, , a constant background, and , the convolutions of the simulated response functions for the gamma-rays with energy with the electronics noise function, given by:
| (2) |
where and correspond to the gamma-rays emitted inside and outside the solid angle covered by the detector, respectively, and is the fixed ratio between the solid angle covered by detector and its complement to 4.
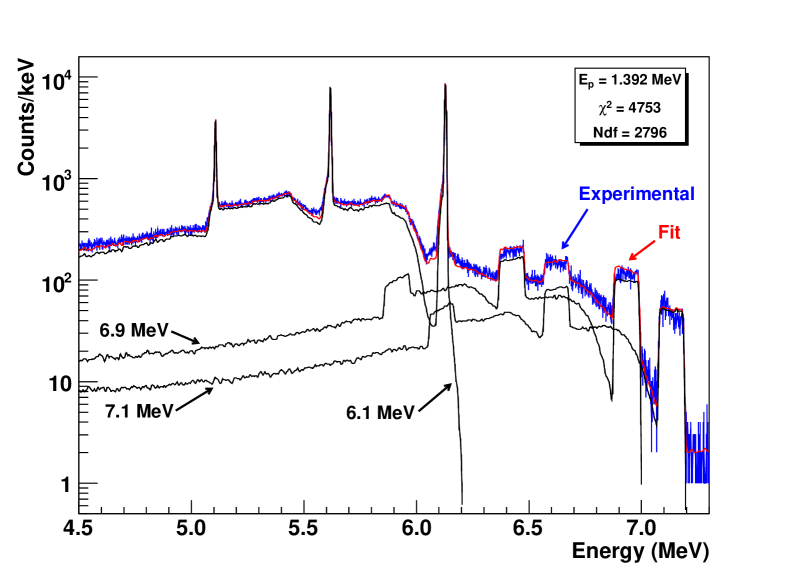
A set of , , , and parameters was fitted for each incident proton energy. The fitted gamma-ray spectrum energy ranges from 4.5 MeV to 7.3 MeV, which is a larger energy region than those analysed by other authors duvall:88 ; fessler:00 ; micklich:03 , which fit the photon spectrum above 5 MeV. The calculated and experimental spectra obtained with protons of 1.39 MeV can be seen in Fig. 2.
The obtained reduced chi-squares, , are between 1.3 and 1.9, outside the acceptance region from a statistical point of view. These high may be the result of: the underestimation of the continuum part of the photon spectrum by MCNP5 simulations, which was also noted in other works utsunomiya:05 ; the description of the peaks, with the simplified modeling of the elecronics noise; and the inaccurate reaction kinematic parameter values, like target thickness and incident proton energy.
5 Discussion
The yields of the reaction gamma-rays were obtained by other authors refs. duvall:88 ; fessler:00 ; micklich:03 with similar procedures. However, the scintillation detectors employed, with poor energy resolution when compared to HPGe detectors, did not allow the observation of the peak broadening due to photon emission in flight.
The underestimation of the continuum part of the gamma-ray spectrum was assigned by other authors to the limitations of the experimental arrangement geometric design included in the simulation duvall:88 ; fessler:00 , composed of just the source and the detector. In this work, the experimental arrangement was considered in detail, see sec. 3.2, therefore that explanation is not applicable to our case. Indeed, the detailed modeling of the detector arrangement allowed the increase in the experimental gamma-ray spectrum fitting region, notwithstanding the systematic overestimation of the continuum part of the experimental spectrum. Therefore, our results indicate that the simulation programs underestimate the continuum, as previously pointed by Utsunomiya et. al. utsunomiya:05 , who assigns this phenomenon to crystal Ge surface inhomogeneities, not taken into account in the simulations, that displace events from the full-energy peak to the continuum.
Several tests were performed to check the stability of the results against changes in the fitted gamma-ray spectrum energy range and peak FWHM. The fit was also repeated with the 6.1 MeV peak and corresponding annihilation escape peaks removed from the fitting procedure. In all cases, the obtained parameters were compatible, showing that our analysis methodology was not sensible to these changes.
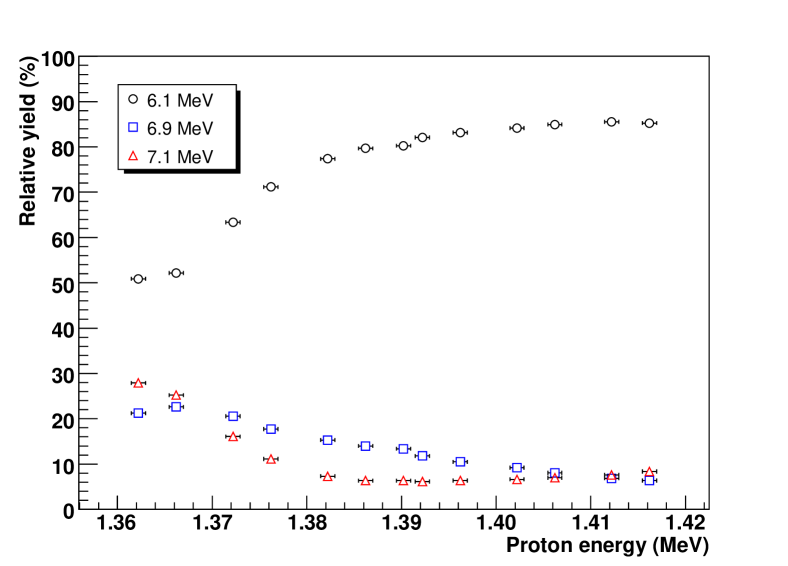
The relative gamma-ray yields, calculated by:
| (3) |
where are the parameters in eq. (1) obtained from the fit, are shown in fig. 3, in function of the proton bombarding energy.
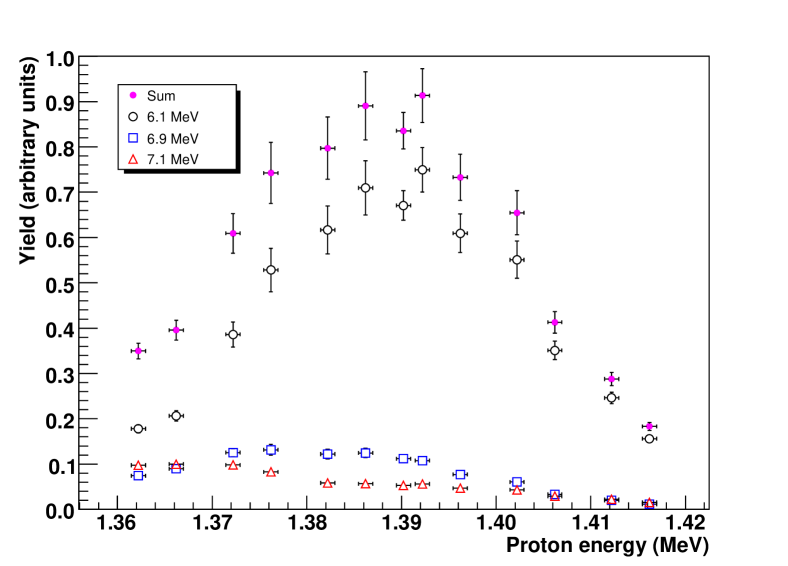
Although we could not measure absolute yields, the coulomb excitation gamma-rays from the Ta backing provided a beam intensity reference, smoothly varying with proton beam energy. Therefore, with the parameters from the fit of the eq. (1) and the peak area of the 198 keV gamma-ray from Ta coulomb excitation, , the yield of the gamma-ray with energy is given by the expression:
| (4) |
The calculated gamma yields for the energies measured can be seen at fig. 4. The table containing the yield numerical values can be seen on page 59 of ref. diogo .
6 Conclusion
The data analysis methodology used in this work, although not new, was never applied before to a high-resolution detector, like the HPGe detector used, to the best of our knowledge.
The reaction has proven to be useful in the HPGe detector calibration at high energy, despite the Doppler broadening complications, which makes necessary significant additional work to model the reaction gamma-rays peak shape, but allowed an accurate gamma-ray relative yield determination.
Our results indicate that the systematic underestimation of the continuum component of the experimental gamma-ray spectrum by simulation programs where the photon and electron transport phenomena are dealed with in details, cannot be always assigned to insufficient description of the experimental arrangement; Utsunomiya et. al. utsunomiya:05 assigns this characteristic to a detection phenomenon still not taken into account by the simulation programs.
Acknowledgements.
We would like to thank the scientific and technical staff of Pelletron and LAMFI Laboratories of USP for help in the irradiations; CNPq (Conselho Nacional de Desenvolvimento Científico e Tecnológico, Brazil) and FAPESP (Fundação de Amparo à Pesquisa do Estado de São Paulo, Brazil) for partial financial support.References
- (1) S. Guldbakke, D. Schäffler, Nucl. Instr. and Meth. A 299(1-3), 367 (1990)
- (2) S. Croft, M. Bailey, Nucl. Instr. and Meth. A 302(2), 315 (1991)
- (3) K.C. Duvall, S.M. Seltzer, C.G. Soares, B.W. Rust, Nucl. Instr. and Meth. A 272(3), 866 (1988)
- (4) D.W. Rogers, Health Phys. 45(1), 127 (1983)
- (5) R.A. Jarjis, Nucl. Instr. and Meth. 154(2), 383 (1978)
- (6) D. Dieumegard, B. Maurel, G. Amsel, Nucl. Instr. and Meth. 168(1–3), 93 (1980)
- (7) K. Spyrou, C. Chronidou, S. Harissopulos, S. Kossionides, T. Paradellis, Z. Phys. A 357(3), 283 (1997)
- (8) A. Fessler, T.N. Masseyb, B.J. Micklich, D.L. Smith, Nucl. Instr. and Meth. A 450(2-3), 353 (2000)
- (9) S.O.F. Dababneh, K. Toukan, I. Khubeis, Nucl. Instr. and Meth. B 83(3), 319 (1993)
- (10) S. Croft, Nucl. Instr. and Meth. A 307(2-3), 353 (1991)
- (11) S. Ding, K. Xu, H. Wang, App. Rad. and Isot. 56(6), 877 (2002)
- (12) F. Ajzenberg-Selove, Nucl. Phys. A 281(1), 1 (1977)
- (13) Y. Jin, R.P. Gardner, K. Verghese, Nucl. Instr. and Meth. A 242(3), 416 (1986)
- (14) M.C. Lee, K. Verghese, R.P. Gardner, Nucl. Instr. and Meth. A 262(2–3), 430 (1987)
- (15) L. Büermann, S. Ding, S. Guldbakke, H. Klein, T. Novotny, M. Tichy, Nucl. Instr. and Meth. A 332(3), 483 (1993)
- (16) F.B. Brown, et al, Trans. Am. Nucl. Soc. 87, 273 (2002)
- (17) Laboratório de Materiais e Feixes Iônicos, Instituto de Física da Universidade de São Paulo, http://www.if.usp.br/lamfi
- (18) D.B. Tridapalli, Master’s thesis, Instituto de Física da Universidade de São Paulo (2006), http://www.teses.usp.br/teses/disponiveis/43/ 43134/tde-28032007-171124/
- (19) N.N.D.C., Nudat database, last access: 10/04/2006, http://www.nndc.bnl.gov/nudat2
- (20) G.F. Knoll, Radiation Detection and Measurement, 2nd edn. (John Wiley & Sons, Inc, 1989)
- (21) B.J. Micklich, D.L. Smitha, T.N. Masseyb, C.L. Finka, D. Ingram, Nucl. Instr. and Meth. A 505(1-2), 1 (2003)
- (22) H. Utsunomiya, H. Akimune, K. Osaka, T. Kaihori, K. Furutaka, H. Harada, Nucl. Instr. and Meth. A 548(3), 455 (2005)