Intersubband decay of 1-D exciton resonances in carbon nanotubes
Abstract
We have studied intersubband decay of excitons in semiconducting carbon nanotubes experimentally and theoretically. Photoluminescence excitation line widths of semiconducting nanotubes with chiral indicess can be mapped onto a connectivity grid with curves of constant and . Moreover, the global behavior of linewidths is best characterized by a strong increase with energy irrespective of their family affiliation. Solution of the Bethe-Salpeter equations shows that the linewidths are dominated by phonon assisted coupling to higher momentum states of the and exciton bands. The calculations also suggest that the branching ratio for decay into exciton bands vs free carrier bands, respectively is about 10:1.
The energetics and dynamics of excited states in carbon nanotubes (CNTs) receive attention because of their relevance for non-equilibrium carrier transport in nanotube electronic devices and their importance for a better understanding of photoluminescence quantum yields, branching ratios and other fundamental photophysical properties of CNTs tans98 ; martel98 ; javey03 ; freitag06 ; misewich03 ; marty06 .
Photoluminescence spectroscopy of semiconducting carbon nanotubes has been extraordinarily useful not only in determining the energetics of excitons and their fine structure wang05 ; maultzsch05 ; mortimer07 but also for establishing detailed structure-property relationships bachilo02 ; arnold04 ; shan04 ; souza05 . Striking family patterns of tubes characterized by chiral indices have been used to relate first and second subband exciton energies, and respectively, and are found to lie on a grid of curves connecting tubes with constant and constant bachilo02 . Moreover, tubes whose chiral indices are such that generally have large ratios with values closer to 2 while those with have an ratio significantly below 2 bachilo02 ; kane03 . Similar patterns, such as for strain and temperature dependence of exciton transitions for example arnold04 ; shan04 ; souza05 , also indicate a strong sensitivity to chirality and tube structure. However, evidence for family relationships in the dynamical properties of excited states is scarce, and how strongly electronic or vibronic processes contribute to the exciton dynamics is not yet resolved.
Here, we examine family connectivities of exciton interband decay rates and their implications for exciton dynamics in semiconducting SWNTs. The observed family patterns in combination with solutions of the Bethe-Salpeter equation perebeinos04 ; perebeinos05b allow to identify zone boundary phonon scattering as the dominant facilitator for interband relaxation. Our calculations moreover show that the branching ratio for decay of the exciton into the first subband e-h pair continuum and the lower lying exciton bands is about 1:10.
Single-wall carbon nanotube suspensions are prepared from commercial nanotube material (HiPCO, CNI Houston). We used two types of samples: type (A) made from soot ultrasonically dispersed and ultracentrifuged in using SDS as surfactant oconnel02 which is here referred to as SDS-SWNT and type (B) made from nanotubes of the same raw material after isopycnic fractionation from nanotube suspensions with sodium-cholate as surfactant arnold05 ; crochet07 here referred to as SC-SWNT.
Photoluminescence excitation spectra from SDS-SWNTs were measured in the range of 800 nm - 1700 nm with a Bruker Equinox 55S/FRA106 FT Raman spectrometer equipped with a liquid nitrogen cooled germanium detector lebedkin03 . SC-SWNTs were studied with a Jobin Yvon/Horiba Fluorolog-3 FL3-111 spectrophotofluorometer equipped with a liquid nitrogen cooled InGaAs detector. PL spectra were recorded with 8 nm excitation spectral slits and a resolution of the FT-Raman spectrometer and with 10 nm exitation slit width in the case of measurements performed with the Flurolog. Both sample types are found to have very similar excitation line-widths. Small systematic deviations are mostly attributed to the different resolution of spectrometers used for both experiments.
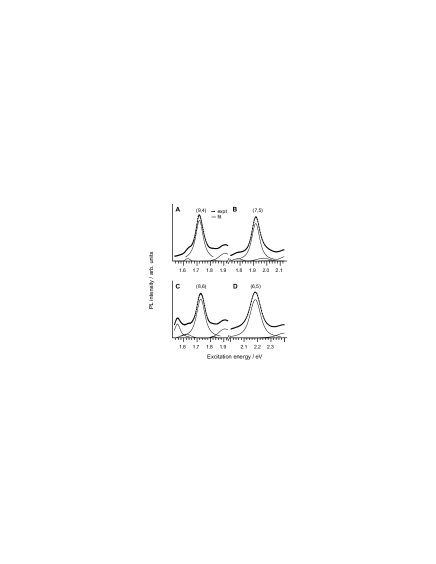
A set of selected photoluminescence excitation spectra is reproduced in Fig. 1 where we plot PL intensities at 1109 nm, 1031 nm, 1180 nm and 983 nm as a function of excitation wavelength. The center peaks in these spectra correspond to the exciton resonances of (9,4), (7,5), (8,6) and (6,5) nanotubes respectively. To extract the width of exciton resonances we used a multi-Voigt peak, non-linear least squares fit routine with polynomial background subtraction. The routine is part of the IGOR software package (Wavemetrics) and uses the Levenberg-Marquardt algorithm for minimization of chi-square. The results of such a fit to select datasets are likewise shown in Fig. 1 as solid lines. The estimated error margins are significantly larger than the confidence bands of the nonlinear least squares fit and are based on the reproducibility of the fit if results from different datasets are compared including mismatch of the results obtained for SDS- and SC-SWNT samples. For the following discussion we corrected data for instrumental resolution. The linewidths used later on, thus include inhomogeneous broadening which is estimated to be on the order of meV based on a comparison of linewidths for emission features from vacuum- and surfactant suspended SWNTs (see for example ref. inoue06 ).
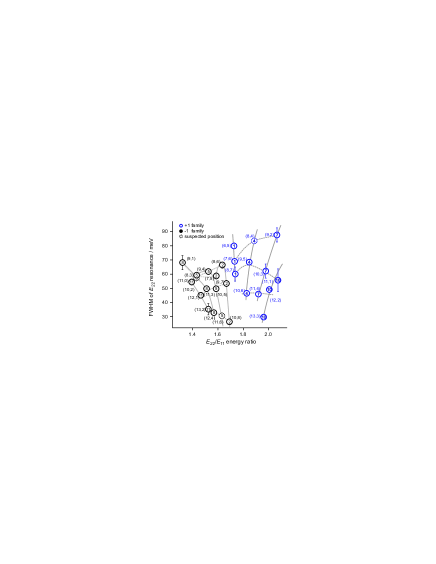
To identify the mechanisms leading to the observed linewidths we begin with an investigation of their chirality and energy dependence. If we plot linewidths versus their respective energy ratios, for example, the data follows a striking family pattern where individual data points can be connected by a grid of intersecting curves with constant and (see Fig. 2. The numbers inside the datapoints give the family affiliation. Family connectivities with patterns similar to this one have previously been found for the photoluminescence excitation maps of semiconducting SWNTs bachilo02 but also for the temperature and strain dependence of exciton line positions arnold04 ; shan04 ; souza05 . The lines with constant converge towards 1.7, the large-tube limit of the energy ratio . The overall trend is for smaller tubes to have larger linewidths, a trend which is reversed only by the smallest tubes of the -1 family studied here, specifically the (8,3) and (7,5) tubes.
In order to identify the microscopic process responsible for the observed family connectivity and for the width of exciton resonances we now search for correlations of linewidths with established structural and electronic properties such as chirality, tube diameter, or transition energies, the or energy differences, where refers to the free pair generation threshold. Aside from the family connectivity discussed above we find that the by far clearest and strongest correlation of resonance widths is with the energy of the resonance itself (see Fig. 3). We also note that we find no evidence for an explicit dependence of linewidths on the family affiliation, and the larger linewidths of the +1 family tubes in Fig. 2 can be exclusively attributed to a correlation with their higher energies.
To explore the pronounced energy dependence of resonance linewidths in further detail we consider the two microscopic mechanisms that can lead to energy relaxation from the state. One is referred to as phonon-mechanism because it describes phonon mediated coupling of , the -point exciton to lower lying exciton states of the and manifolds at energies with momentum (see left panel of Fig. 4A). The second possible mechanism describes direct coupling of the state to the -point continuum of free pair excitations with its threshold at . If the rate of decay for the electronic process is approximated using Fermi’s Golden Rule we obtain
| (1) |
where and are wavefunctions of the second subband exciton and the continuum state in the first subband into which the exciton decays. is the coupling term and is the joint density of states of the final state continuum. Accordingly, one would expect the dependence of on the JDOS at the energy to lead to a pronounced dependence of the FWHM on the band alignment of the state with respect to the free carrier band edge. By a comparison of linewidths with the alignment parameter (see Fig. 4a) we should therefore be able to assess the importance of the electronic process for energy relaxation.
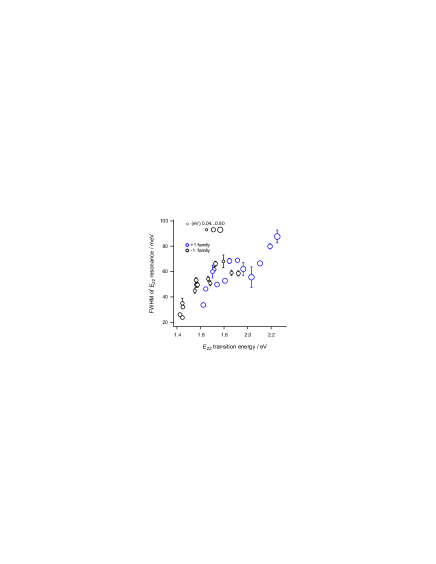
The alignment parameter is determined using a combination of experimental data and theoretical considerations. Recent calculations suggest that exciton binding energies scale linearly with the renormalized free-carrier gap capaz06 . A similar scaling consequently also characterizes the relationship of binding energies with the corresponding optical transition energies. By comparison of calculated capaz06 with experimental binding- and transition energies and , respectively wang05 ; maultzsch05 , we find and the free carrier gap becomes . We can thus determine the alignment parameter . From this we find that the state is in resonance with the free carrier continuum for all tubes studied here. Moreover, the absence of any correlation of linewidths with (see Fig. 3) suggests that coupling to the free carrier continuum is weak.
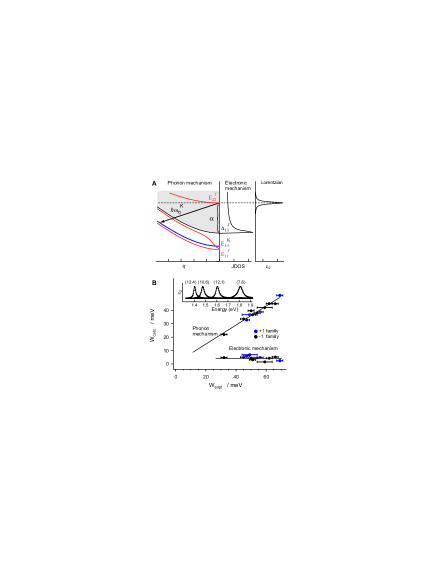
To put these findings on a more quantitative basis we solved the Bethe-Salpeter equation, as described in Ref. perebeinos04 , using a -orbital tight-binding basis set with a hopping parameter eV. This allows to determine linewidths from the frequency dependence of the absorption coefficient perebeinos04 . In the electronic decay mechanism, the exciton couples to the free continuum, as schematically shown in the right panel of Fig. 4A, leading to a Lorentzian absorption spectrum spataru04 ; perebeinos04 . Several states of the Bethe-Salpeter equation (BSE) contribute to the exciton absorption. We choose a unit cell of about 500 nm length, large enough to resolve the spectral width of the peak. The linewidths resulting from the fit of Lorentz profiles to the calculated absorption spectra are shown in Fig. 4B. However, the predicted broadening due to the electronic mechanism is, on average, a factor of 10 smaller than the experimental width and no correlation of calculated and experimental values is found.
The second decay mechanism discussed here involves exciton-phonon coupling, which allows the exciton to decay to a lower energy state by phonon emission. Unlike in the electronic mechanism, which requires the initial exciton state and final electron-hole pair states to have the same angular and longitudinal momenta, namely , in the exciton-phonon mechanism, the phonon can have both finite angular and longitudinal momenta resulting in a final state with finite momentum. To explore this phonon assisted decay mechanism, we used the Su-Schrieffer-Heeger model Su for the electron-phonon interaction, with a matrix element dependent on the change of the nearest neighbor C-C distance . We use eV/Å. Following Ref. perebeinos05b , we calculate the exciton-phonon coupling using exciton wavefunctions from the BSE solution. We then use the Golden rule to calculate the lifetime of each BSE state, which contributes to the absorption spectra including the exciton-phonon coupling perebeinos05b . The spectrum is then again fit with a Lorentzian profile with the resulting FWHM plotted in Fig. 4B to illustrate the clear correlation of theory and experiment. In our calculations, we allowed for exciton coupling with all phonons and found that the exciton primarily decays into the doubly-degenerate dark exciton perebeinos05 with a finite angular momentum via the zone-boundary -optical phonon. The slope of the straight line fit to the calculated linewidths using the phonon-mechanism in Fig. 4B is about 30% smaller than experimental data. Some of this difference may be due to phonon-assisted decay into sigma states louie94 as well as to thermal broadening by acoustic phonons on the order of a few meV, which are not included in our theory.
The absence of any clear correlation of linewidths and the family affiliation in the experiment is also consistent with the phonon decay mechanism. We note, that there is a difference in the electron-phonon coupling for the two families in the single particle model. jiang07 However, the exciton binding energies also exhibit a family effect related to their effective masses perebeinos04 . As a result, the stronger bound excitons have larger exciton-phonon coupling perebeinos05b , which in effect compensates for the difference in the electron-phonon coupling in the single particle picture jiang07 . However, the complex family correlations seen experimentally in Fig. 2 cannot be understood at this level of theory and may provide motivation to study these effects using more sophisticated approaches, for example, including the orbital hybridization.
In conclusion, we find that linewidths of the second subband excitons in semiconducting carbon nanotubes exhibit pronounced family connectivities and strongly depend on the transition energy. Our calculations show that the dominant scattering process to the lower lying dark exciton subband is facilitated by coupling via zone boundary phonons from the resonance. The linewidths are found to be consistent with an coupling strength of about 5 eV/Å. In contrast, the coupling to the free carrier continuum is comparatively small and leads to a branching ratio for decay into the lower exciton versus free carrier bands of roughly 10:1. Future studies will need to clarify finer effects of the family connectivity of the relaxation rates.
References
- (1) Electronic address: tobias.hertel@vanderbilt.edu
- (2) S.J. Tans, A.R.M. Verschueren, C. Dekker, Nature 393, 49 (1998).
- (3) R. Martel, T. Schmidt, H.R. Shea, T. Hertel, P. Avouris, Appl. Phys. Lett. 73, 2447 (1998).
- (4) A. Javey, J. Guo, Q. Wang, M. Lundstrom, H.J. Dai, Nature 424, 654 (2003).
- (5) M. Freitag, J.C. Tsang, J. Kirtley, et al., Nano Lett. 6, 1425 (2006).
- (6) J.A. Misewich, R. Martel, P. Avouris, et al., Science 300, 783 (2003).
- (7) L. Marty, E. Adam, L. Albert, et al., Phys. Rev. Lett. 96, 136803 (2006).
- (8) F. Wang, G. Dukovic, L.E. Brus, et al., Science 308, 838 (2005).
- (9) J. Maultzsch, R. Pomraenke, S. Reich, et al., Phys. Rev. B 72, 241402 (2005).
- (10) I.B. Mortimer, R.J. Nicholas, Phys. Rev. Lett. 98, 027404 (2007).
- (11) S.M Bachilo, M.S. Strano, C. Kittrell, et al., Science 298, 2361 (2002).
- (12) K. Arnold, S. Lebedkin, O. Kiowski, et al., Nano Lett. 4, 2349 (2004).
- (13) W. Shan, J. Wu, W. Walukiewicz, et al., Phys. Stat. Sol. B 241, 3367 (2004).
- (14) A.G. Souza, N. Kobayashi, J. Jiang, et al., Phys. Rev. Lett. 95, 217403 (2005).
- (15) C.L. Kane, E.J. Mele, Phys. Rev. Lett. 90, 207401 (2003).
- (16) V. Perebeinos, J. Tersoff, and P. Avouris, Phys. Rev. Lett. 92, 257402 (2004).
- (17) V. Perebeinos, J. Tersoff, and Ph. Avouris, Phys. Rev. Lett. 94, 27402 (2005).
- (18) M.J. O’Connell, S.M. Bachilo, C.B. Huffman, et al., Science 297, 593 (2002).
- (19) M.S. Arnold, S.I. Stupp, M.C. Hersam, Nano Lett. 5, 713 (2005).
- (20) J. Crochet, M. Clemens, and T. Hertel, J. Am. Chem. Soc. 129, 8058 (2007).
- (21) S. Lebedkin, K. Arnold, F. Hennrich, et al., New J. Phys. 5, 140 (2003).
- (22) T. Inoue, K. Matsuda, Y. Murakami, et al., Phys. Rev. B 73, 233401 (2006).
- (23) R.B. Capaz, C.D. Spataru, S. Ismail-Beigi, and S.G. Louie, Phys. Rev. B 74, 121401R (2006).
- (24) G. Dukovic, F. Wang, D. Song, M. Y. Sfeir, T. F. Heinz, and L. E. Brus, Nano Lett. 5, 2314 (2005).
- (25) C. D. Spataru, S. Ismail-Beigi, L. X. Benedict, and S.G. Louie, Phys. Rev. Lett. 92, 077402 (2004).
- (26) W. P. Su, J. R. Schrieffer, and A. J. Heeger, Phys. Rev. Lett. 42, 1698 (1979); Phys. Rev. B 22, 2099 (1980).
- (27) V. Perebeinos, J. Tersoff, and Ph. Avouris, Nano Lett. 5, 2495 (2005).
- (28) X. Blase, L. X. Benedict, E. L. Shirley, and S.G. Louie, Phys. Rev. Lett. 72, 1878 (1994).
- (29) J. Jiang, R. Saito, K. Sato, et. al. Phys. Rev. B 75, 035405 (2007).