The Stellar Population of the Chamaeleon I Star-Forming Region11affiliation: Based on observations performed with the Magellan Telescopes at Las Campanas Observatory, Cerro Tololo Inter-American Observatory (CTIO), Gemini Observatory, and the NASA/ESA Hubble Space Telescope. CTIO is operated by the Association of Universities for Research in Astronomy (AURA) under a contract with the National Science Foundation (NSF). Gemini Observatory is operated by AURA under a cooperative agreement with the NSF on behalf of the Gemini partnership: the NSF (United States), the Particle Physics and Astronomy Research Council (United Kingdom), the National Research Council (Canada), CONICYT (Chile), the Australian Research Council (Australia), CNPq (Brazil) and CONICET (Argentina). The Hubble observations are associated with proposal ID 10138 and were obtained at the Space Telescope Science Institute, which is operated by AURA under NASA contract NAS 5-26555.
Abstract
I present a new census of the stellar population in the Chamaeleon I star-forming region. Using optical and near-IR photometry and followup spectroscopy, I have discovered 50 new members of Chamaeleon I, expanding the census of known members to 226 objects. Fourteen of these new members have spectral types later than M6, which doubles the number of known members that are likely to be substellar. I have estimated extinctions, luminosities, and effective temperatures for the known members, used these data to construct an H-R diagram for the cluster, and inferred individual masses and ages with the theoretical evolutionary models of Baraffe and Chabrier. The distribution of isochronal ages indicates that star formation began 3-4 and 5-6 Myr ago in the southern and northern subclusters, respectively, and has continued to the present time at a declining rate. The IMF in Chamaeleon I reaches a maximum at a mass of 0.1-0.15 , and thus closely resembles the IMFs in IC 348 and the Orion Nebula Cluster. In logarithmic units where the Salpeter slope is 1.35, the IMF is roughly flat in the substellar regime and shows no indication of reaching a minimum down to a completeness limit of 0.01 . The low-mass stars are more widely distributed than members at other masses in the northern subcluster, but this is not the case in the southern subcluster. Meanwhile, the brown dwarfs have the same spatial distribution as the stars out to a radius of (8.5 pc) from the center of Chamaeleon I.
Subject headings:
infrared: stars — stars: evolution — stars: formation — stars: low-mass, brown dwarfs — stars: luminosity function, mass function — stars: pre-main sequence1. Introduction
The characteristics of the distributions of masses, ages, and positions in a newborn stellar population are determined by the process of star formation. As a result, measurements of these distributions in star-forming regions are potentially valuable for testing models of the birth of stars and brown dwarfs. For instance, the properties of the stellar initial mass function (IMF, Meyer et al., 2000) can constrain the relative importance of turbulent fragmentation (Padoan & Nordlund, 2002), gravitational fragmentation (Larson, 1985), dynamical interactions (Bonnell, Bate, & Vine, 2003), and accretion and outflows (Adams & Fatuzzo, 1996) in regulating the final masses of stars. Models of the star formation rates of molecular clouds (e.g., constant, accelerating, bursts) can be tested against the distributions of ages and positions of members of young clusters (Feigelson, 1996; Palla & Galli, 1997; Hartmann, 2001). The spatial distributions also provide insight into cloud fragmentation, binary formation, cluster dynamics, and the origin of brown dwarfs (Larson, 1995; Hillenbrand & Hartmann, 1998; Hartmann, 2002; Luhman, 2006). To obtain measurements of this kind, one must identify the members of star-forming regions and estimate their masses and ages. Only a few young stellar populations have been characterized in detail, such as the Orion Nebula Cluster (Hillenbrand, 1997), Taurus (Kenyon & Hartmann, 1995), and IC 348 in Perseus (Luhman et al., 2003b).
The Chamaeleon I star-forming region is amenable to a thorough census of its stellar population for several reasons. It is among the nearest star-forming regions (-170 pc, Whittet et al., 1997; Wichmann et al., 1998; Bertout et al., 1999), exhibits less extinction than many young clusters (), is compact enough that a large fraction of the region can be surveyed to great depth in a reasonable amount of time, and is sufficiently rich for a statistically significant analysis of its stellar population. In addition, because Chamaeleon I is relatively isolated from other star-forming regions, confusion with other young populations is minimal. Previous surveys have already identified more than 150 young stars and brown dwarfs in Chamaeleon I through photometric variability, H emission, X-ray emission, mid-infrared (IR) excess emission, and optical and near-IR color-magnitude diagrams (Comerón et al., 2004; Luhman, 2004a, 2007, references therein). However, in the census of known members produced by these surveys, the completeness as a function of mass and position is unknown (Luhman, 2004a). In this paper, I present a set of magnitude-limited surveys for members of Chamaeleon I that have well-defined completeness limits (§ 2). I then use the new census of Chamaeleon I to measure the star formation history (§ 3), IMF (§ 4), and spatial distribution of its stellar population (§ 5).
2. New Members of Chamaeleon I
2.1. Selection of Candidate Members
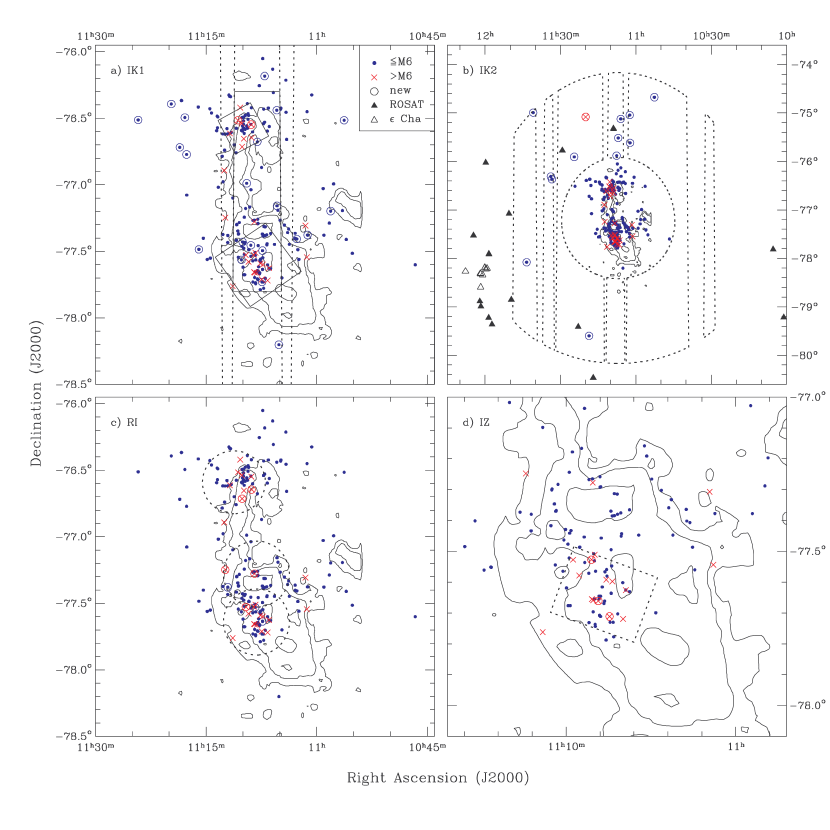
I have used optical and near-IR broad-band photometry from several sources to perform four surveys for new members of Chamaeleon I. The fields covered by these surveys are indicated in the maps of the cluster in Figure 1. The first survey (hereafter named IK1) is shallow () and covers most of the cloud complex, concentrating on the central area where most of the known members reside. The second survey (RI) also focuses on this central field, but with greater depth (). These two surveys are designed to produce an IMF measurement that has good number statistics and completeness to reasonably low masses ( ). A third survey (IK2) considers a small range of masses (-0.02 ) across a very wide field extending well beyond the Chamaeleon I cloud. This survey will be used to measure the spatial distribution of low-mass stars and brown dwarfs. Finally, a very deep survey is performed toward a small field in the center of the southern subcluster in Chamaeleon I (IZ), which will be used to constrain the minimum mass of the IMF. The candidate members identified in this section and observed spectroscopically in § 2.2 are listed in Table 1, which includes all of the relevant photometric measurements.
2.1.1 IK1 Survey
For the IK1 survey, I used measurements in , , and from the Point Source Catalog of the Two-Micron All-Sky Survey (2MASS, Skrutskie et al., 2006) and -band data from the Second Release of the Deep Near-Infrared Survey of the Southern Sky (DENIS, Epchtein et al., 1999) for the area covered by the map of Chamaeleon I in Figure 1a. DENIS data are not available within two strips that are indicated in the map. Using these data, I constructed an extinction-corrected diagram of versus in the manner previously done for Chamaeleon I by Luhman (2004a). I defined a boundary that followed the lower envelope of the sequence of previously known members and identified objects above this boundary as candidate members. I have performed spectroscopy on 112 of the candidates (§ 2.2) and classified them as either members or nonmembers (§ 2.3). These spectroscopic targets and the previously known members appearing in these data are shown in the color-magnitude diagram in Figure 2. When selecting candidates for spectroscopy, I gave highest priority to ones that are within the central area indicated in Figure 1a because I will measure an IMF from members within this field (§ 4). The boundaries of this field were designed to encompass a significant fraction of the known cluster members, which favors a larger area, while minimizing contamination by field stars among the candidates, which favors a smaller area.
Based on the spectral classifications performed in § 2.3, the 112 IK1 candidates that were observed spectroscopically consist of 32 members and 80 nonmembers. Eight of these members were independently discovered by Comerón et al. (2004). In this work, these objects are counted as previously known members rather than new members. The primary in the wide binary brown dwarf 2MASS J11011926-7732383 (hereafter 2M 1101-7732) is also one of the 32 members found during the IK1 survey, but for the purposes of this study, I count it as a previously known member because I presented its discovery in a separate study (Luhman, 2004b). Given these considerations, the IK1 survey produced 23 new members.
2.1.2 IK2 Survey
To search for low-mass members of Chamaeleon I outside of the area of the IK1 survey, I again used data from the 2MASS Point Source Catalog and the Second DENIS Release. For this wide-field survey, named IK2, I considered the area between radii of 1.25 and from , (J2000). The map in Figure 1b indicates the portion of this annulus for which data are available from the Second DENIS Release. As in the IK1 survey, I constructed an extinction-corrected color-magnitude diagram from the DENIS and 2MASS data and used it to identify candidate members of Chamaeleon I, which are shown on the color-magnitude diagram in Figure 3. Unlike IK1, I selected for spectroscopy only the candidates with , which corresponds to spectral types of M4.5 and masses of . These criteria produced a total of 24 candidate low-mass stars and brown dwarfs. I have obtained spectra of 23 of these candidates (§ 2.2). The remaining object, 2MASS J10504888-7829244, was classified as a galaxy through visual inspection of acquisition images obtained during the spectroscopic observations, and thus a spectrum was unnecessary. I find that 13 of the targets are pre-main-sequence objects (§ 2.3). Kinematic measurements are needed to verify that these sources are directly associated with Chamaeleon I (Covino et al., 1997), but for the purposes of this study, I treat them as members of the star-forming region. The positions of these sources are indicated on the map in Figure 1b. For comparison, I also show the positions of other young stars previously detected within the area encompassed by Figure 1b. These additional stars consist of probable members of the Cha association (Feigelson et al., 2003; Luhman, 2004c) and pre-main-sequence stars found in the ROSAT all-sky survey (Alcalá et al., 1995, 1997; Covino et al., 1997).
2.1.3 RI Survey
On the night of 2004 January 11, I obtained - and -band images centered at and , and , and and (J2000) with the Inamori Magellan Areal Camera and Spectrograph (IMACS) on the Magellan I telescope at Las Campanas Observatory. The instrument contained eight CCDs separated by and arranged in a mosaic. The plate scale was pixel-1 and the unvignetted field of view was circular with a diameter of . The imaged areas are indicated in the map of Chamaeleon I in Figure 1c. In each filter, I obtained two dithered images at each exposure time of 1, 25, and 450 sec. Photometry and image coordinates of the sources in these data were measured with DAOFIND and PHOT under the IRAF package APPHOT. Aperture photometry was extracted with a radius of six pixels. The background level was measured in an annulus around each source and subtracted from the photometry, where the inner radius of the annulus was six pixels and the width was one pixel. The photometry was calibrated in the Cousins system by combining data for standards across a range of colors (Landolt, 1992) with the appropriate aperture and airmass corrections. Because an atmospheric dispersion corrector was unavailable at the time of these observations, the image quality varies with position across the images. As a result, the photometric uncertainties for these data are relatively large, with a minimum value of mag.
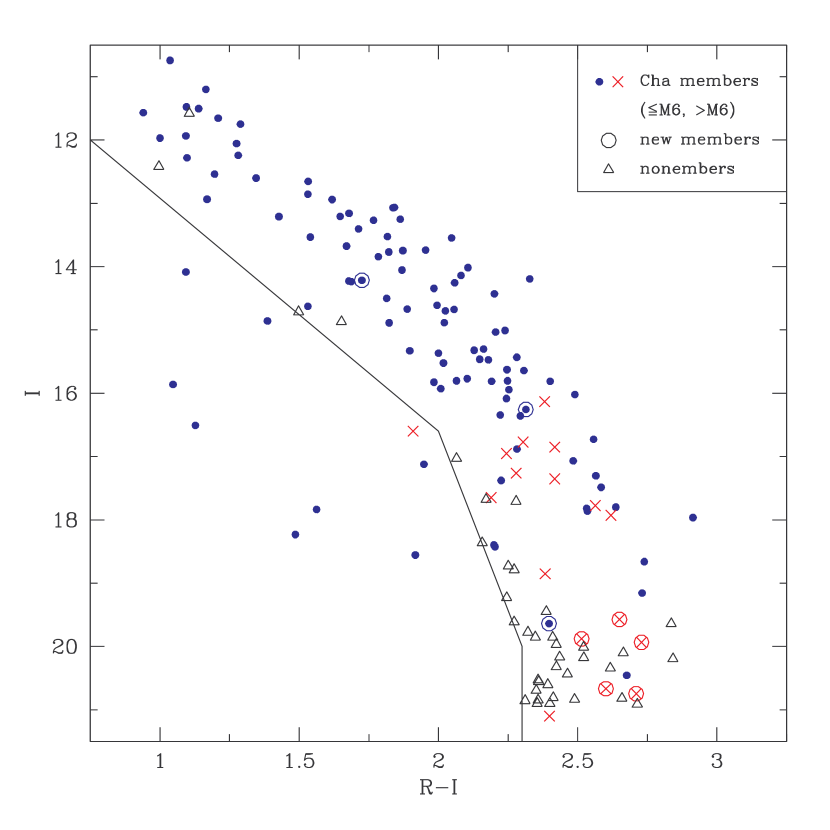
As in the IK1 and IK2 color-magnitude diagrams, I defined a boundary that follows the lower envelope of the sequence of known members in versus for separating probable field stars from candidate members of Chamaeleon I. I have obtained spectra of 46 of the 116 resulting candidates (§ 2.2), which are classified as 38 nonmembers and eight members (§ 2.3). Figure 4 shows the color-magnitude diagram of these 46 sources and the previously known members that have unsaturated IMACS photometry. The positions of the new members from the RI survey are indicated on the map in Figure 1c.
2.1.4 IZ Survey
To search for members of Chamaeleon I at very low masses ( ), I used deep optical and near-IR images of the densest portion of the southern subcluster that were obtained by Luhman et al. (2005c). The optical images were collected with the Advanced Camera for Surveys (ACS) aboard HST through the F775W and F850LP filters, which are similar to the and filters from the Sloan Digital Sky Survey (Sirianni et al., 2005) . These images covered a area, which is indicated in Figure 1d. The near-IR imaging was performed with the Infrared Side Port Imager (ISPI) at the 4 m Blanco telescope at CTIO through , , and filters. These data covered a area and were centered at , (J2000), completely encompassing the ACS field.
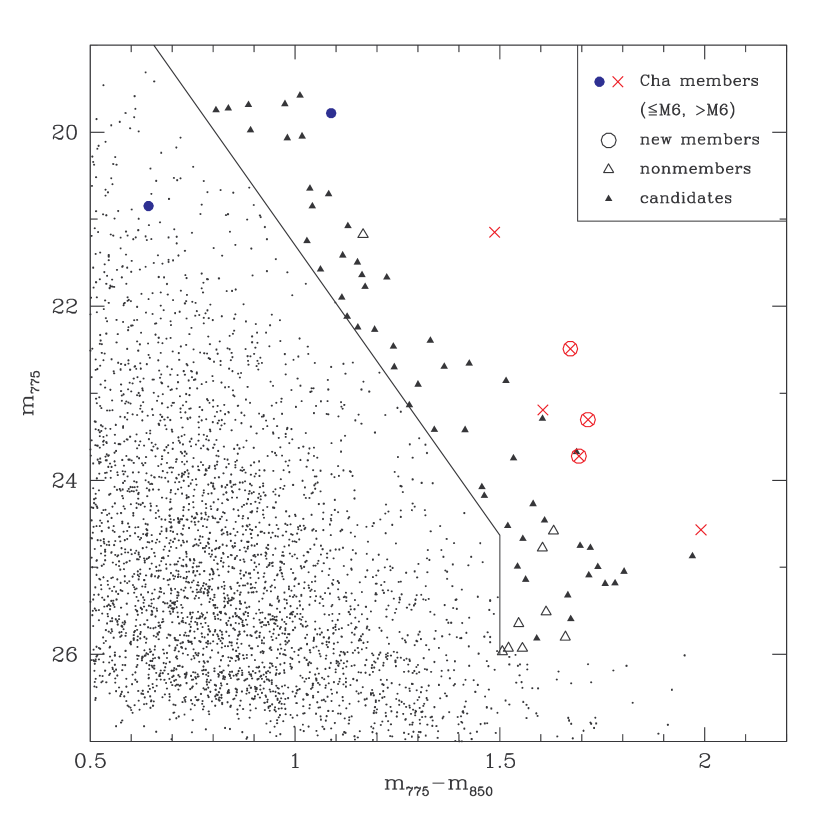
In Figure 5, I plot a color-magnitude diagram consisting of photometry at F751W and F850LP for all unsaturated sources in the ACS images. The saturation limits of these data correspond to masses that are below the hydrogen burning limit for unreddened members of Chamaeleon I. In fact, most of the known substellar members of the cluster (M6) are saturated. Two members with spectral types earlier than M6 are not saturated because one of them, ISO 79, has significant reddening and the other star, Cha J11081938-7731522, is subluminous for its color and spectral type and thus may be seen in scattered light (§ A). To separate candidate cluster members and probable field stars, I defined a boundary below the lower envelope of the sequence of known members. Because the colors of late-type field dwarfs do not decrease significantly from late-M to mid-L (Steele & Howells, 2000; Dahn et al., 2002; Dobbie et al., 2002), I have made this boundary vertical at the reddest colors. At , I cannot use Figure 5 to reliably separate field stars and candidate members because the photometric uncertainties are too large. Considering only stars at , I found 69 candidates in Figure 5.
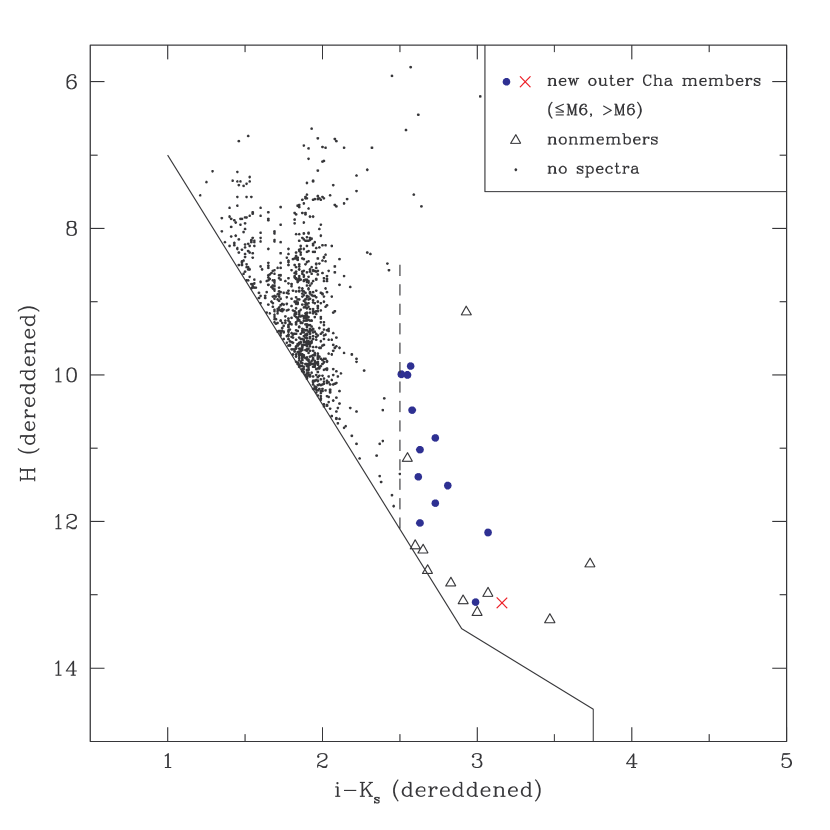
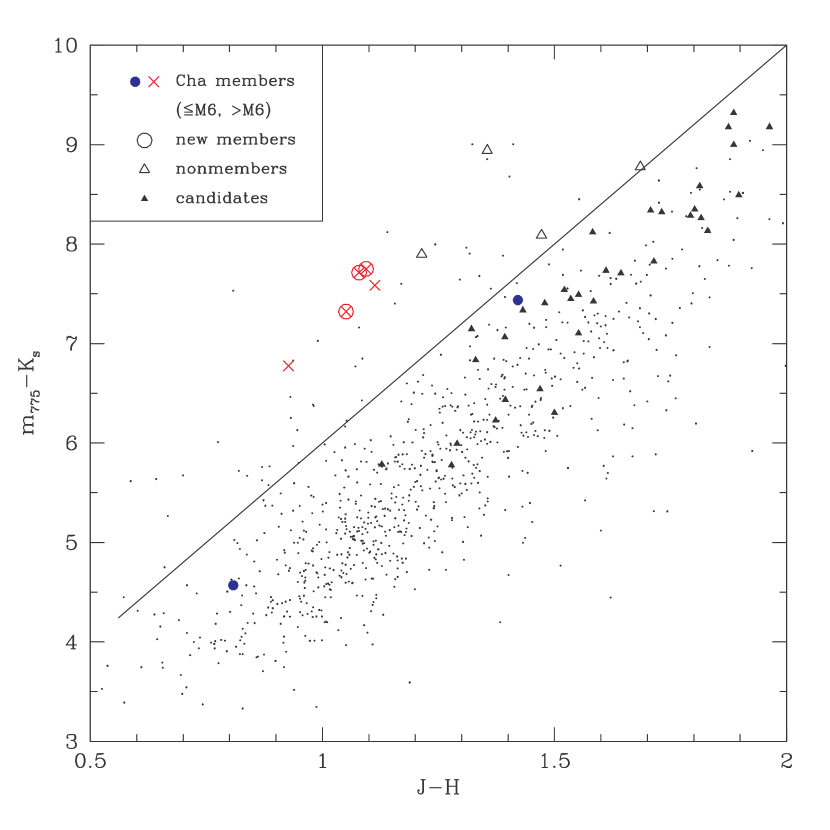
Color-color diagrams like versus can further refine samples of candidate late-type objects found in color-magnitude diagrams (Luhman, 2000). Therefore, I constructed an analogous diagram of versus in Figure 6 by combining the ACS and ISPI photometry. To identify objects in this diagram that have colors indicative of late spectral types, I have defined a boundary in Figure 6 that approximates the reddening vector for a spectral type of M6, which corresponds to for members of Chamaeleon I. The slope of this vector was determined from the distribution of reddened stars in Figure 6. The origin of the vector is placed at (Leggett, 1992) and a value of such that the vector is slightly redder than the color of the known member ISO 79 (M5.25, Luhman, 2004a). Objects later than M6 should appear above this reddening vector. Among the 69 candidates from Figure 5, 57 sources have photometry in , , and and thus are present in Figure 6. Eight of these 57 objects are above the reddening vector, indicating that they could be later than M6. The 49 candidates below the vector are unlikely to be substellar members, but some of them could be young stars with very high reddenings. One of the eight late-type candidates, Cha 110913-773444, also exhibits mid-IR excess emission in images from the Spitzer Space Telescope. Based on the promising position of this object in Figures 5 and 6 and its mid-IR excess, Luhman et al. (2005c) obtained a spectrum of this object and confirmed its youth and late-type nature. I have performed spectroscopy on the seven remaining late-type candidates from Figure 6 (§ 2.2), three of which are confirmed as low-mass members of Chamaeleon I (§ 2.3). I have also obtained spectra of six of the 12 candidates from Figure 5 that lack photometry and thus could not be plotted in Figure 6. One of these six objects was not detected by ISPI because it is close to a brighter stellar member, CHXR 73. Spectroscopic confirmation of this probable companion was presented by Luhman et al. (2006). The five remaining ACS-only candidates in my spectroscopic sample are nonmembers (§ 2.3).
2.2. Spectroscopy
I performed optical and near-IR spectroscopy on 193 candidate members of Chamaeleon I that were identified in § 2.1 and 53 miscellaneous targets that are described in this section. Some of these objects were observed multiple times. Table 2 summarizes the dates, telescopes, and instrument configurations for these observations. In this section, I provide additional details of the target selection and observations. The identity of the sources in each of the categories of targets described below can be found in Tables 3 and 4, which list the basis of selection for each target.
I observed one of the IK1 candidates with the Magellan Inamori Kyocera Echelle (MIKE). The details of the observations are the same as those described by Muzerolle et al. (2005) for other targets observed on that same night. During the IMACS observations in January of 2004, I obtained long-slit and multi-object spectra of 123 sources, consisting of 85 IK1 candidates, 19 known members of Chamaeleon I that I have not previously classified, four candidate members from López Martí et al. (2004), six candidate brown dwarfs from 2MASS data, two objects with uncertain previous classifications that were noted by Luhman (2004a), six X-ray sources from Feigelson & Lawson (2004), and a candidate companion to the binary ISO 250 (López Martí et al., 2004). The 2MASS brown dwarf candidates were selected to have uncertainties less than 0.1 mag in , , and , , , and positions in the central area indicated in Figure 1a. The 2MASS candidates, X-ray sources, stars with uncertain classifications, and the candidate companion are all classified as nonmembers in § 2.3.
During the observations with the Low Dispersion Survey Spectrograph (LDSS-2) on the Magellan II telescope at Las Campanas Observatory on the night of 2004 March 31, I obtained long-slit spectra of 18 and 23 candidates from the IK1 and IK2 surveys, respectively. The one remaining IK2 candidate was not observed spectroscopically because it was identified as a galaxy on acquisition images obtained with LDSS-2, as discussed in § 2.1.2. On the nights of 2004 April 26 and 27, I performed long-slit spectroscopy on eight IK1 candidates and multi-slit spectroscopy on 37 RI candidates. One of these IK1 candidates was also observed during an earlier run. During the IMACS observations in January of 2005, I obtained long-slit and multi-slit spectra of 32 targets, consisting of one IK1 candidate, nine RI candidates, a candidate companion to KG 102 (Persi et al., 2005), one star with an uncertain previous classification, eight candidates identified with mid-IR photometry from the Spitzer Space Telescope, five known members that I have not previously classified, and seven targets observed in earlier runs that needed better signal-to-noise. Although it lacks previous spectroscopic confirmation of youth and membership, I am counting the companion T39B as one of the known members. To provide sufficiently high spectral resolution for the measurement of Li absorption in this possible companion, it was observed with the 600 l mm-1 grism, which provided coverage of 0.6-0.92 µm and a resolution of R=5000. All other targets were observed with the instrument configuration that is indicated in Table 2. The Spitzer candidates were identified with data from Luhman et al. (2005b) using the color criteria described in that study. Finally, on the nights of 2005 March 23-25, I obtained near-IR spectra of 12 IZ candidates with the Gemini Near-Infrared Spectrograph (GNIRS) at Gemini South Observatory through program GS-2005A-C-13. The observing and analysis procedures were the same as those described by Luhman et al. (2004) for spectroscopy of OTS 44.
2.3. Classification of Candidate Members
To measure spectral types and assess membership in Chamaeleon I for the 246 targets in my spectroscopic sample, I applied the classification methods developed in my previous studies of this kind (Luhman, 1999, 2004a, 2006; Luhman et al., 2003b). In brief, spectral types were measured from the optical spectra by comparing them to the averages of dwarfs and giants and to spectra of previously-classified members of Chamaeleon I (Luhman, 2004a), while the IR spectra were classified through comparison to IR data for optically-classified young objects (Luhman et al., 2004). To evaluate the membership of each target, I employed various diagnostics based on the spectra, photometry, and other published data, which included gravity-sensitive lines, emission lines, IR excess emission, Li absorption, reddening, and radial velocities.
I have classified 50 targets as new members of Chamaeleon I and 163 targets as nonmembers. The remaining 33 objects in my spectroscopic sample are previously known members. The new members, nonmembers, and previously known members are listed in Tables 3, 4, and The Stellar Population of the Chamaeleon I Star-Forming Region11affiliation: Based on observations performed with the Magellan Telescopes at Las Campanas Observatory, Cerro Tololo Inter-American Observatory (CTIO), Gemini Observatory, and the NASA/ESA Hubble Space Telescope. CTIO is operated by the Association of Universities for Research in Astronomy (AURA) under a contract with the National Science Foundation (NSF). Gemini Observatory is operated by AURA under a cooperative agreement with the NSF on behalf of the Gemini partnership: the NSF (United States), the Particle Physics and Astronomy Research Council (United Kingdom), the National Research Council (Canada), CONICYT (Chile), the Australian Research Council (Australia), CNPq (Brazil) and CONICET (Argentina). The Hubble observations are associated with proposal ID 10138 and were obtained at the Space Telescope Science Institute, which is operated by AURA under NASA contract NAS 5-26555. , respectively. 2M J1101-7732 is counted as a previously known member and is omitted from Table The Stellar Population of the Chamaeleon I Star-Forming Region11affiliation: Based on observations performed with the Magellan Telescopes at Las Campanas Observatory, Cerro Tololo Inter-American Observatory (CTIO), Gemini Observatory, and the NASA/ESA Hubble Space Telescope. CTIO is operated by the Association of Universities for Research in Astronomy (AURA) under a contract with the National Science Foundation (NSF). Gemini Observatory is operated by AURA under a cooperative agreement with the NSF on behalf of the Gemini partnership: the NSF (United States), the Particle Physics and Astronomy Research Council (United Kingdom), the National Research Council (Canada), CONICYT (Chile), the Australian Research Council (Australia), CNPq (Brazil) and CONICET (Argentina). The Hubble observations are associated with proposal ID 10138 and were obtained at the Space Telescope Science Institute, which is operated by AURA under NASA contract NAS 5-26555. because it was already presented by Luhman (2004b), but the photometry used for its selection is included in Table 1. Tables 3-The Stellar Population of the Chamaeleon I Star-Forming Region11affiliation: Based on observations performed with the Magellan Telescopes at Las Campanas Observatory, Cerro Tololo Inter-American Observatory (CTIO), Gemini Observatory, and the NASA/ESA Hubble Space Telescope. CTIO is operated by the Association of Universities for Research in Astronomy (AURA) under a contract with the National Science Foundation (NSF). Gemini Observatory is operated by AURA under a cooperative agreement with the NSF on behalf of the Gemini partnership: the NSF (United States), the Particle Physics and Astronomy Research Council (United Kingdom), the National Research Council (Canada), CONICYT (Chile), the Australian Research Council (Australia), CNPq (Brazil) and CONICET (Argentina). The Hubble observations are associated with proposal ID 10138 and were obtained at the Space Telescope Science Institute, which is operated by AURA under NASA contract NAS 5-26555. provide the source identifications, the available spectral types, the basis for each object’s selection for spectroscopy, the night on which it was observed, and its evidence of membership or nonmembership. The references for the membership data consist of Luhman (2004a), Comerón et al. (2004), Luhman et al. (2005b), this work, and unpublished Spitzer data. For sources that are not in the 2MASS Point Source Catalog, I have assigned new coordinate-based names. Additional names for the previously known members have been compiled by Carpenter et al. (2002) and Luhman (2004a). All spectral types in Table 3 are from this work. The spectra of the X-ray-selected targets were described by Feigelson & Lawson (2004). Comments on the classifications of other individual sources are provided in § A.
The optical and IR spectra of the new and previously-known members of Chamaeleon I in my spectroscopic sample are shown in Figures 7-9. 2M J1106-7732 is excluded because Luhman (2004b) already presented its spectrum and C1-25 is not shown because its spectrum has very low signal-to-noise. Some of the spectra obtained with IMACS exhibit gaps in wavelength coverage that are produced by the boundaries between adjacent CCDs.
2.4. Completeness of Census
In § 4, I will construct IMFs for a field encompassing most of the Chamaeleon I cloud (Figure 1a) and the field in the southern subcluster that was imaged with ACS (Figure 1d). To ensure that these IMFs are accurate representations of the stellar population in Chamaeleon I, in this section I evaluate the completeness of the current census of known members within these two fields as a function of mass and extinction. I also perform a completeness analysis for the substellar members within of the center of Chamaeleon I, the results of which will be used in § 5 to measure the large-scale spatial distribution of brown dwarfs.
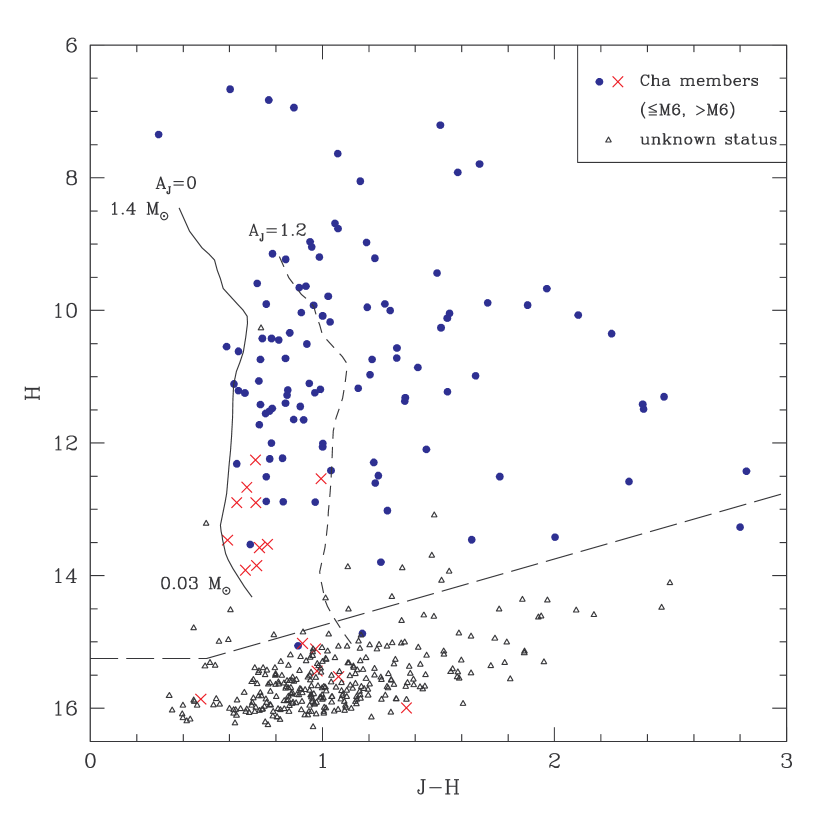
I first consider the field. In Figure 10, I show the diagram of versus from 2MASS for this area. The completeness limits of the 2MASS photometry are taken to be the magnitudes at which the logarithm of the number of sources as a function of magnitude departs from a linear slope and begins to turn over. In Figure 10, I have plotted the 10 Myr isochrone from Baraffe et al. (1998) for and 1.2. I selected this isochrone because most members of Chamaeleon I fall above it on the Hertzsprung-Russell (H-R) diagram (§ 3). A comparison of the 2MASS completeness limits to the isochrones indicates that the photometric data should be complete for members with (M8) and , with the exception of close companions and objects that are simultaneously near , , and Myr. I have omitted in Figure 10 the 2MASS sources that are nonmembers according to spectroscopy or that are likely to be field stars because they are below the sequences of known members in Figures 2 and 4. The remaining sources either have been confirmed as members or lack sufficient data for the assessment of their membership. Based on these data, the current census in the field should be nearly 100% complete for and . These completeness limits do not apply to objects that are seen in scattered light (e.g., edge-on disks) because they often appear below cluster sequences on color-magnitude diagrams and thus can be mistaken for field stars.
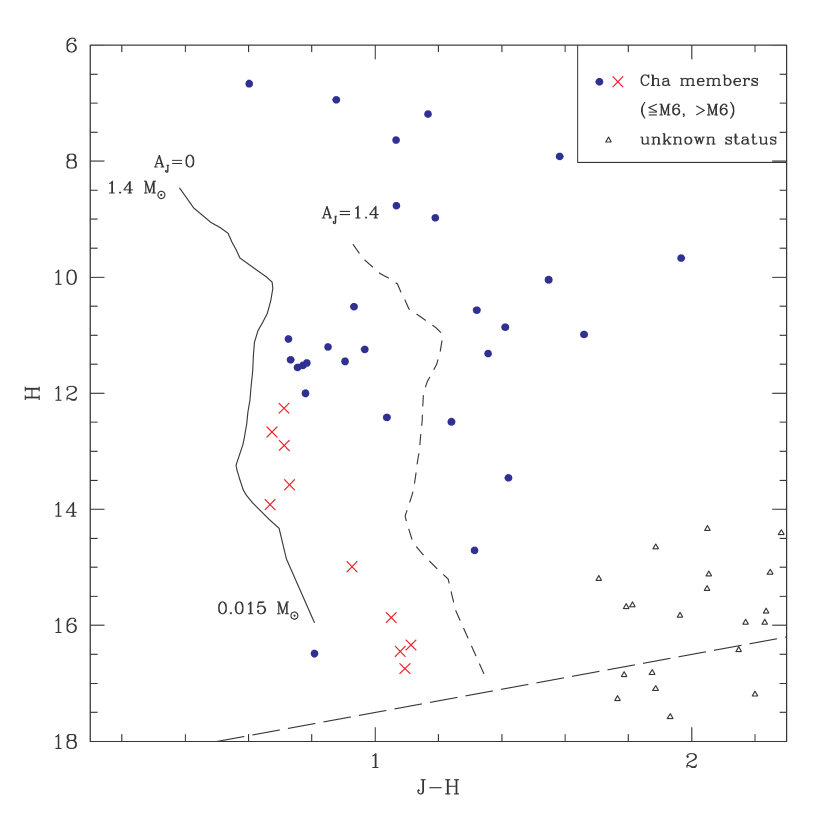
My ISPI near-IR images of Chamaeleon I encompassed the entire ACS field and are deeper than 2MASS. Therefore, for this field I have constructed the diagram of versus in Figure 11 from a combination of 2MASS and ISPI photometry. For sources that are present in both sets of data, I adopt the measurement from ISPI if the photometric uncertainty from 2MASS is larger than 0.05 mag. The completeness limit of the ISPI data is estimated in the same manner as for 2MASS earlier in this section. As with Figure 10, I show the 10 Myr isochrone from Baraffe et al. (1998), except for a higher extinction of and a lower minimum mass of 0.015 . Sources that are likely to be nonmembers based on spectroscopy or their positions in Figures 2, 4, and 5 are omitted from Figure 11. I also reject sources that are resolved as galaxies in the ACS images. The remaining IR sources consist of confirmed members and sources with undetermined membership. A comparison of these two populations to the reddened isochrone and the ISPI completeness limit demonstrates that the current census of members within the ACS field is complete for and .
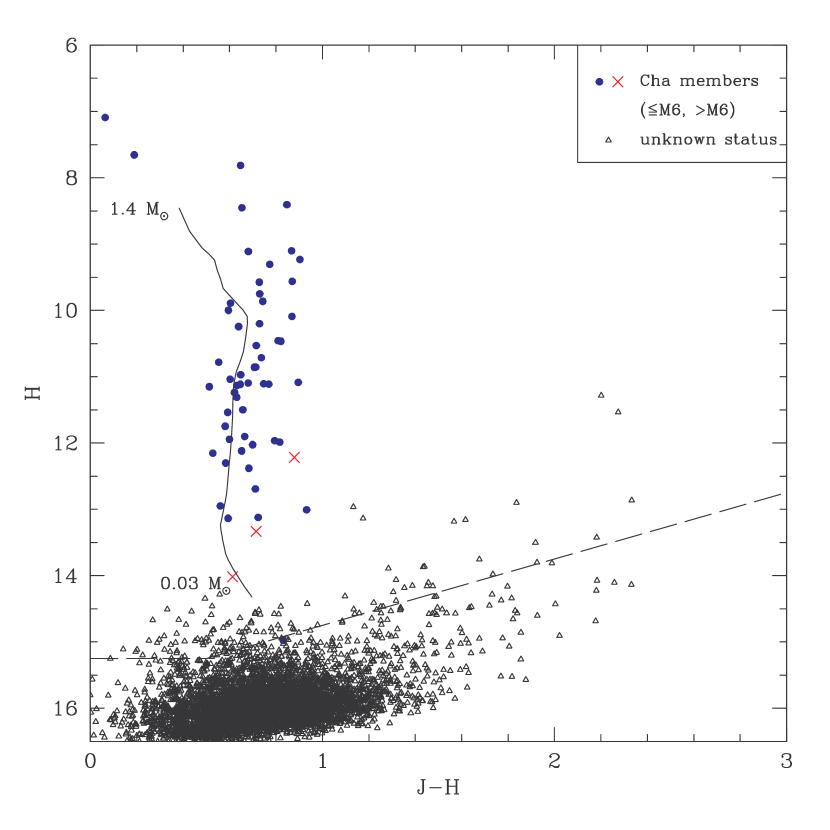
Finally, I evaluate the completeness of the current census of brown dwarfs for the area outside of the field and within a radius of from the center of Chamaeleon I. I consider only the regions that are covered by the Second DENIS Release, which are indicated in Figure 1. The diagram of versus from 2MASS for this area is shown in Figure 12. I have excluded 2MASS sources that have been spectroscopically classified as nonmembers or that are likely to be field stars because they are below the sequences of known members in Figures 2 and 3. Because I am examining the completeness of only brown dwarfs in Chamaeleon I and not stellar members for the area in question, I have also omitted 2MASS sources whose colors are too blue for brown dwarfs; nearly all known members of Chamaeleon I with spectral types later than M6 have and , so I have applied these thresholds. The resulting color-magnitude diagram in Figure 12 contains known members and sources whose membership is undetermined. Because most of the area considered here is outside of the Chamaeleon I dark clouds, the known members within it exhibit little extinction () and the same is expected for any undiscovered members. For these low levels of extinction, Figure 12 indicates that the current census of Chamaeleon I is complete for (M8) out to a radius of for the area covered by DENIS and outside of the central field.
2.5. Summary of Updated Census
It is useful to describe the statistics of the updated census of Chamaeleon I that includes the new members found in this work. The census presented by Luhman (2004a) consisted of 158 members, eight of which were later than M6. SGR1 was included in that list of members, but I now classify it as a field star (§ A) and remove it from the census. During the time since Luhman (2004a), 16 members have been identified by Luhman (2004b), Luhman et al. (2004, 2005c, 2006), and Comerón et al. (2004). I also add ESO H 281 from Brandner & Zinnecker (1997), which was overlooked by Luhman (2004a). T3B and T39B were previously believed to be companions but were not counted as members by Luhman (2004a) because they lacked spectroscopic confirmation. Based on my spectral classifications of T3B and T39B, I include them in the census of members. When the 50 new members from this work are included, the latest census of Chamaeleon I contains 226 known members, 28 of which are later than M6111The number of objects in a given range of spectral types depends on the measurements that are adopted. I am adopting spectral types from this work, Luhman (2004a, b), and Luhman et al. (2004, 2005c, 2006)..
3. Star Formation History
3.1. H-R Diagram
To place the members of Chamaeleon I on the H-R diagram, I first estimate their extinctions, effective temperatures, and bolometric luminosities. I exclude from this analysis 11 of the 226 known members whose spectral types are too uncertain for such estimates. When constructing an H-R diagram from an earlier census of Chamaeleon I, Luhman (2004a) adopted the average of the extinctions estimated from optical spectra and near-IR colors when both were available. I use a different approach in this work, adopting only the spectroscopically-measured extinctions when possible. Following Luhman (2004a), the reddenings of the optical spectra are quantified by the color excess between 0.6 and 0.9 µm, which is denoted as in Figures 7 and 8. These excesses are converted to with the relation (Luhman, 2004a). Extinction estimates from spectra are available for 198 members (§ 2, Luhman, 2004a, b; Luhman et al., 2004, 2006). For the remaining 17 stars, I estimate extinctions from and in the manner described by Luhman (2004a).
The uncertainties of the extinctions estimated from spectroscopy are determined by the errors in relative flux calibration of the spectra. All of the targets observed with long-slit spectroscopy were observed with the slit aligned at the parallactic angle, which prevents errors in relative flux calibration due to atmospheric differential refraction (Filippenko, 1982). On the other hand, the multi-slit observations generally were not performed at the parallactic angle because a given slit mask required a specific position angle. To ensure accurate relative flux calibration, I included slits in each mask for known members that have been previously observed with long-slit spectroscopy. I then compared the spectral slopes of the multi-slit and long-slit data to check the accuracy of the former. This analysis indicates errors in the relative flux calibration of the multi-slit data that correspond to .
Spectral types are converted to effective temperatures and bolometric luminosities are derived from -band magnitudes with the same temperature scale and bolometric corrections used by Luhman (2004a), except that I adopt the -band bolometric corrections from Dahn et al. (2002) for spectral types of M6 and later. For computing the luminosities, I adopt a distance modulus of 6.05 (Luhman, 2007), which differs slightly from the value of 6.13 used in Luhman (2004a). For most members of Chamaeleon I, I used -band measurements from 2MASS or my ISPI images. However, T39B, 2MASS 11072022-7738111, ESO H 281, T3B, T33B, and CHXR 73B are blended with brighter stars in those data. I estimate near-IR magnitudes for the first four sources by applying the differential photometry from Chelli et al. (1995) and Correia et al. (2006) to the 2MASS data. For T33A/B and CHXR 73B, I adopt the resolved photometry from Haisch et al. (2004) and Luhman et al. (2006), respectively. The typical uncertainties in , , and BCJ (, 0.03, 0.1) correspond to errors of in the relative values of log . When an uncertainty in the distance modulus is included (), the total uncertainties are .
The extinctions, effective temperatures, bolometric luminosities, and adopted spectral types for the 215 known members of Chamaeleon I with spectral classifications are listed in Table 6. These temperatures and luminosities are plotted in Figure 13 for members later than G5. Separate H-R diagrams are shown for the members north and south of , which is the approximate midpoint between the northern and southern subclusters. The H-R diagram for types earlier than G5 is the same as the one in Luhman (2004a), except for a small offset in luminosities because of the different adopted distances.
3.2. Distribution of Ages
In the H-R diagram for Chamaeleon I from Luhman (2004a), the sequence for Chamaeleon I closely resembled that of IC 348 in terms of age, with both clusters exhibiting median ages of Myr with the models of Baraffe et al. (1998) and Chabrier et al. (2000). The same result is produced by the updated data shown in Figure 13. Because the census of Chamaeleon I is now larger and more complete, I can compare the ages of the northern and southern subclusters. In Figure 13, the northern sequence appears to be slightly fainter, and hence older, than the southern one. To better illustrate this age difference, I compare the distributions of model ages for the two subclusters in Figure 14. For masses of 0.1 to 1 , the northern and southern subclusters have median ages of 2.8 and 2.5 Myr, respectively. For masses below 0.1 , each sequence in Chamaeleon I becomes somewhat older on the model isochrones. Rather than a true variation of age with mass, this feature may be caused by an error in the adopted temperature scale or evolutionary models.
To interpret the distributions of isochronal ages in Figure 14 in terms of star formation histories, I must account for the observational errors in the age estimates. To do this, I assume that the errors follow Gaussian distributions. I adopt , 0.1, and 0.1 mag to represent the errors from extinction (), variability, and bolometric corrections. The sum of these errors in quadrature corresponds to (log , which is approximately equivalent to (log (Hartmann, 2001). Because the depth of Chamaeleon I should be only a few pc, the uncertainties in relative distances should have negligible effect on the spread in luminosities. I also account for binaries in the manner described by Hartmann (2001), except that I assume an unresolved binary fraction of 30%, which should be a reasonable value for a sample like the one in Chamaeleon I that is dominated by low-mass stars (Reid & Gizis, 1997).
I now convolve the error distributions with model star formation histories and compare the results to the distributions of isochronal ages in Figure 14. I consider two types of star formation histories, an instantaneous burst and an extended period of constant star formation. For the burst, I select an age that reproduces the median of the isochronal ages in Chamaeleon I. As shown in Figure 14, a burst at 3 Myr closely resembles the age distribution of the southern sample at ages beyond 1 Myr. The agreement in the widths of the observed and model distributions suggests that the combined observational errors are not significantly larger than the adopted value of (log . On the other hand, the northern sample exhibits a distribution of ages that is broader than the model distribution for a single burst. If the observational errors are similar between the two halves of Chamaeleon I, then the broader age distribution in the north indicates the presence of a larger age spread, and that star formation began 1-2 Myr earlier in the northern subcluster than in the southern one.
For both the northern and southern subclusters, the burst model produces too few stars with isochronal ages less than 1 Myr. Indeed, the presence of protostars in this region demonstrates that star formation is ongoing (Reipurth et al., 1996). Therefore, I also consider a constant star formation rate that extends to the present time. For comparison to the data in Figure 14, I select a lower limit of 0.3 Myr for the ages of stars in this model because most of the protostars lack spectral classifications and thus are absent from the H-R diagram in Figure 13. The same approach was used by Hartmann (2001) for Taurus. After varying the upper age limit for this model, I find that values of 6 and 4.5 Myr provide the best match to the data in the northern and southern samples, respectively, although they produce too many stars younger than 1 Myr. The models for a burst and periods of constant star formation bracket the data for the two subclusters, which suggests that star formation has occurred for the past 3-4 Myr in the south and 5-6 Myr in the north at rates that have declined with time. Thus, I do not find evidence in these data for Chamaeleon I to support the idea that star formation begins slowly and accelerates during the lifetime of a molecular cloud (Palla & Galli, 1997; Palla & Stahler, 1999, 2000, 2002).
In the preceding analysis, I have inferred ages for stars in Chamaeleon I with the model isochrones of Baraffe et al. (1998) and Chabrier et al. (2000). Use of other models would produce different age estimates. However, because the evolution of low-mass stars along Hayashi tracks approximately follows log log (Hartmann, 1998), the distribution of log is a reflection of the distribution of observed log for any set of models. Thus, the shape of the distribution of isochronal ages shown in Figure 14 is insensitive to the choice of models, while the average age can vary by 0.1-0.2 in log from one set of models to another because of differences in birthlines.
3.3. Cloud Morphology
The difference in isochronal ages between the northern and southern subclusters is consistent with the relative levels of obscuration toward their members. For instance, the fraction of stars residing outside of the extinction contours in Figure 1 is higher in the northern subcluster than in the southern one. The presence of a north-south age gradient is further supported by an examination of the string of five young stars directly north of the cloud at that have been found in this work (see Figure 1). The distribution of the isochronal ages of these stars is shown in Figure 14, which indicates that these stars are older, on average, than the northern and southern samples. Based on these age data, I speculate that star formation in this region began in a small cloudlet north of the currently existing dark clouds, producing the B star HD 96675 and -10 other stars, and propagated south to form the two larger subclusters. The apparent gradient in median age and cloud morphology between the northern and southern subclusters implies that the Chamaeleon I clouds are dissipating on a time scale of Myr after the initiation of star formation, which is consistent with previous estimates of molecular cloud lifetimes (Elmegreen, 2000; Hartmann, Ballesteros-Paredes, & Bergin, 2001, references therein).
According to theoretical evolutionary models (§ 4.2), the masses of the 215 members with spectral classifications range from to 3.5 and have a median value of 0.21 . The combined mass of these objects is 86 . After including the known members that lack measured spectral types, the total mass of the known stars and brown dwarfs in Chamaeleon I is . Because most undiscovered members of the cluster are probably brown dwarfs, their inclusion would have negligible effect on this estimate. The combination of the mass of the stellar population with a mass of for the cloud (Boulanger et al., 1998; Mizuno et al., 2001) implies a star formation efficiency of % for Chamaeleon I. This value is an upper limit because the cloud was probably more massive in the past.
4. Initial Mass Function
4.1. Defining the Sample
In this section, I measure IMFs for the and fields in Chamaeleon I that are indicated in Figure 1. Cluster members at higher masses can be detected through larger amounts of extinction. Therefore, to avoid IMF measurements that are biased in mass, I construct them from extinction-limited samples of known members. For the and fields, I select limits of and , respectively. The current census of cluster members should be complete down to 0.03 and 0.01 for these areas and ranges of extinctions (§ 2.4). The extinctions used in creating these extinction-limited samples are those listed in Table 6 for the 215 members with spectral classifications. Eleven additional members lack extinction estimates because their spectral types are too uncertain, but they have very red near-IR colors that are indicative of extinctions well beyond the limits adopted for the two IMFs. Pairs of members with separations less than are treated as one source in the IMFs. In these cases, I adopt the masses of the earlier components. The six stars that appear below the main sequence in Figure 13 are rejected from the IMF samples because the census is not complete for subluminous objects of this kind. After applying these criteria to the census of Chamaeleon I, I arrive at IMF samples that contain 85 and 34 members for the and fields, respectively.
4.2. Estimating Masses
For the objects in the IMF samples, I estimate masses from their positions on the H-R diagram by using the theoretical evolutionary models of Baraffe et al. (1998) and Chabrier et al. (2000) for and the models of Palla & Stahler (1999) for because they provide the best agreement with observational constraints (Luhman et al., 2003b, 2005a; Luhman & Potter, 2006). As noted in § 3, some of the late-type members of Chamaeleon I have rather old isochronal ages in Figure 13. For the purposes of this work, I assume that these old apparent ages are caused by errors in the luminosities, temperature scale, or models and that these objects in reality have the same ages as the stellar members. Therefore, for members later than M7 that are below the 10 Myr isochrone, I estimate masses from their spectral types assuming that they have ages of 1-3 Myr.
I estimate the masses of the known members classified as M9 by comparing their luminosities to the values predicted for the evolutionary models of Chabrier et al. (2000) and Burrows et al. (1997). To account for the large range of isochronal ages exhibited by the late-type members in Figure 13, I adopt a conservatively large range of ages of 1-30 Myr. Using these ages, the models imply masses of 0.005-0.015 for the four M9 members. In the IMFs, I divide these objects evenly between the two mass bins on either side of 0.01 . The resulting IMFs for the and fields are presented in Figure 15. For comparison, I include the similarly-derived IMFs for Taurus (Luhman, 2004d) and IC 348 (Luhman et al., 2003b). For these IMF samples from Chamaeleon I, Taurus, and IC 348, I also show the distributions of spectral types and dereddened absolute -band magnitudes in Figures 16 and 17, respectively.
4.3. Turnover Mass
Notable features to examine in the IMF of a young cluster are the mass at which it reaches a maximum, the relative numbers of objects in different mass ranges, and the minimum mass. Because it contains more objects, the IMF in the field provides a better measurement of the first two properties, while the deeper IMF in the area better constrains the minimum mass of the IMF.
The mass at which the IMF reaches a maximum has been shown to vary significantly between the low-density stellar population in Taurus ( Luhman, 2000, 2004d; Briceño et al., 2002) and the denser clusters of IC 348 in Perseus and the Orion Nebula Cluster (-0.2 Hillenbrand, 1997; Hillenbrand & Carpenter, 2000; Muench et al., 2002, 2003; Luhman et al., 2003b). The peak mass of the IMF in Chamaeleon I is 0.1-0.15 , which is similar to the value in IC 348, as shown in Figure 15. The agreement between Chamaeleon I and IC 348 is also apparent in the distributions of spectral types and MH in Figures 16 and 17. Meanwhile, Taurus is distinct from both clusters in all of these diagrams. Thus, the characteristic mass of the IMF exhibits no noticeable variation among Orion, Chamaeleon, and Perseus. With a peak mass near 0.8 , Taurus remains unique among well-studied nearby star-forming regions. As discussed by Briceño et al. (2002) and Luhman et al. (2003b), the distinctive nature of the IMF in Taurus may be a reflection of an unusually high average Jeans mass.
4.4. Minimum Mass
To date, measurements of IMFs in nearby star-forming regions have reached mass limits of -0.02 through luminosity function modeling (Luhman et al., 2000; Hillenbrand & Carpenter, 2000; Muench et al., 2002, 2003; Preibisch et al., 2003; Lucas et al., 2005) and spectroscopy (Hillenbrand, 1997; Comerón et al., 2000; Béjar et al., 2001; Luhman et al., 2003b; Briceño et al., 2002; Barrado y Navascués et al., 2004; Luhman, 2004d; Slesnick et al., 2004; Levine et al., 2006; Lucas et al., 2006). Individual brown dwarfs that are not part of IMF measurements have also been found near masses of (Kirkpatrick et al., 2006; Allers et al., 2006, 2007). The best constraints on the minimum mass in Chamaeleon I are provided by my survey of a field in the southern subcluster. The IMF for this field extends down to the completeness limit of , and perhaps even to 0.005 . Thus, the minimum mass of the IMF in Chamaeleon I is , which is comparable to constraints provided by IMF measurements in a few other young clusters. In comparison, a minimum mass of 0.001-0.01 has been predicted by calculations of opacity-limited fragmentation (Low & Lynden-Bell, 1976; Rees, 1976; Silk, 1977; Boss, 1988; Bate, 2005; Whitworth & Stamatellos, 2006). To better constrain these predictions with Chamaeleon I, a survey with a deeper completeness limit is required.
4.5. Brown Dwarf Fraction
As done in Briceño et al. (2002) and Luhman et al. (2003b), I quantify the relative numbers of brown dwarfs and stars in Chamaeleon I with the following ratio:
For the IMF, this ratio is . This brown dwarf fraction for Chamaeleon I is higher than measurements in IC 348 and Taurus by a factor of 1.5-2 (Briceño et al., 2002; Luhman et al., 2003a, b; Luhman, 2004d) and is similar to values reported for Orion (Luhman et al., 2000; Hillenbrand & Carpenter, 2000; Muench et al., 2002; Slesnick et al., 2004). The variations among these ratios are significant if only the formal statistical errors are considered. However, it is likely that additional systematic errors are present in these measurements. In particular, because the peak of the IMF is close to the hydrogen burning limit (see Figs. 15 and 16), small systematic offsets in mass estimates can result in large differences in the relative numbers of stars and brown dwarfs. These offsets can arise from differences in adopted evolutionary models, temperature scales, and spectral classification systems (Luhman, 2006), or from basic differences in the methods of estimating masses (e.g., positions on H-R diagrams versus luminosity functions). These sources of systematic errors are not present among the measurements that I have performed in IC 348, Taurus, and Chamaeleon I. However, because the low-mass stars in IC 348 and Chamaeleon I are segregated and low-mass stars dominate these stellar populations by number, the brown dwarf fraction is also sensitive to the size of the field in which it is measured. The fields considered in IC 348, Taurus, and Chamaeleon I are probably large enough to accurately represent the entire stellar population in each cluster, but it is possible that the brown dwarf fractions would change noticeably if they were measured from even larger fields. Even in the absence of systematic errors, the modest differences in the brown dwarf fractions of these regions can be explained by slight variations in the peak mass of the IMF and probably do not require a deeper explanation that is specific to brown dwarf formation.
5. Spatial Distribution
5.1. Brown Dwarfs within
If I account for the completeness limits described in § 2.4, I can use the current census of Chamaeleon I to characterize the spatial distribution of stars and brown dwarfs in this cluster. I first investigate whether a widely-distributed population of brown dwarfs is present in Chamaeleon I. The IK2 survey was specifically designed for this question (§ 2.1.2). To be sensitive to members moving at high velocities ( km s-1), such as brown dwarfs ejected from multiple systems (Reipurth & Clarke, 2001), I selected a search radius of from the center of Chamaeleon I, which corresponds to the angular distance traveled by an object moving at 8 km s-1 in the plane of the sky at the distance of Chamaeleon I for a duration of 1 Myr. I also considered only sources with (M4.5), which is blue enough to encompass the peak of the spectral type distribution of the cluster (Figure 16) while red enough to minimize contamination by field stars (Figure 3). As demonstrated in § 2.4, the IK2 survey is complete for substellar cluster members above masses of 0.03 (M8) that are within areas covered by the Second DENIS Release (Figure 1).
As shown in the map of known members of Chamaeleon I in Figure 1b, a population of widely-distributed brown dwarfs is not present out to a radius of (8.5 pc) surrounding the cluster. To quantify this result, I compare the relative numbers of low-mass stars and brown dwarfs between the inner and outer regions of the cluster. The ratio N(M6-M8)/N(M4.5-M6) is for , which is actually lower than the value of for .
Several studies have suggested that brown dwarfs form by the ejection of protostellar sources from multiple systems (Reipurth & Clarke, 2001; Boss, 2001; Bate et al., 2002; Delgado-Donate, Clarke, & Bate, 2003; Umbreit et al., 2005; Goodwin & Whitworth, 2007). Some of these models predict that brown dwarfs are born with higher velocity dispersions than stars, and consequently have wide spatial distributions in star-forming regions (Reipurth & Clarke, 2001; Kroupa & Bouvier, 2003). However, I have shown that brown dwarfs are not more widely distributed than their stellar counterparts in Chamaeleon I. Luhman (2006) and Slesnick et al. (2006) found the same result for Taurus, which also lacks an extended population of brown dwarfs. Thus, embryo ejection models that predict high velocities for brown dwarfs are not viable as the dominant mode of brown dwarf formation.
5.2. Stars and Brown Dwarfs within
I next examine the spatial distributions of members of Chamaeleon I within a radius of from the cluster center. Because I wish to compare the distributions for different ranges of spectral types, I begin by summarizing the completeness within this area (§ 2.4). The current census of the central field should be nearly 100% complete for (M8) and . Outside of this field, most members at M4.5-M8 should be identified. Members later than M8 are excluded from this analysis of spatial distributions because only the central regions of the two subclusters in Chamaeleon I have been thoroughly searched at such late types. The completeness at types earlier than mid-M is not well-determined outside of the field, but it is likely that wide-field X-ray and H surveys have found most of the earlier members, particularly given the low levels of extinction outside of the field. Thus, spatial distributions measured from members earlier than M8 in the current census should be accurate representations of the cluster.
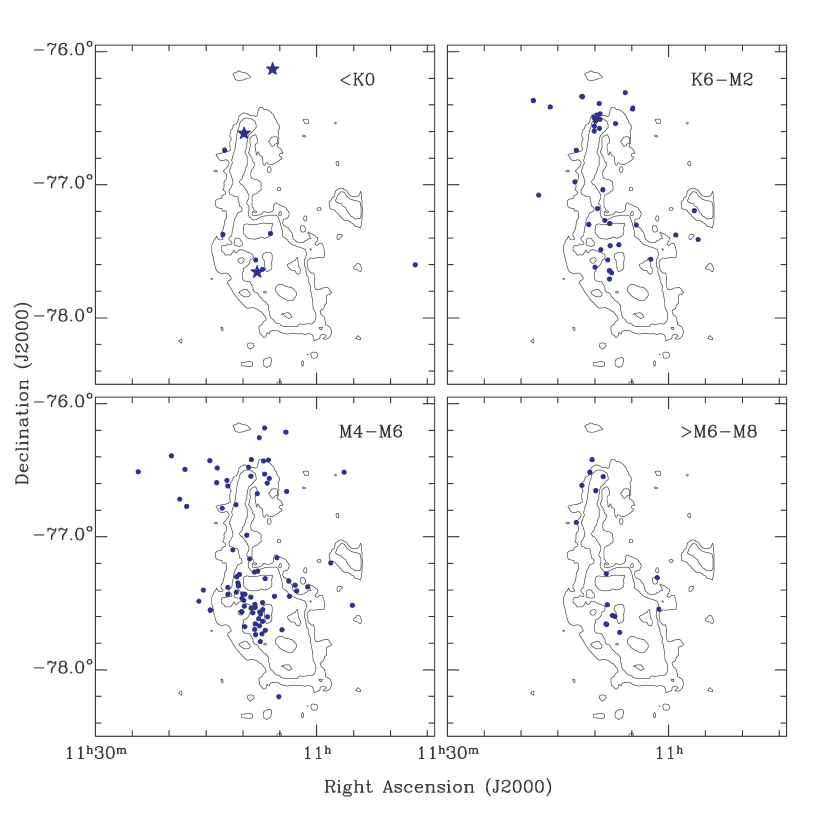
To characterize the spatial distribution of the stellar population of Chamaeleon I as a function of mass, I first plot the positions of members with spectral types of K0, K6-M2, M4-M6, and M6-M8 on separate maps in Figure 18. The cluster contains too few stars at K0 to examine their spatial distribution in detail. I only note that two of the three most massive members, the B stars T32 and T41, are located near the centers of the two subclusters, which is often the case in young clusters (Hillenbrand & Hartmann, 1998, references therein). The third B star, HD 96675, is north of the Chamaeleon I cloud (see Figure 18). In § 3.3, I suggested that the it may have formed from small cloudlet that has recently dissipated.
Based on visual inspection of Figure 18, the members at K6-M2, M4-M6, and M6-M8 exhibit similar spatial distributions in the southern subcluster. However, in the northern subcluster, the M4-M6 members appear to have a significantly wider distribution than the objects at K6-M2 and M6-M8. To quantitatively assess this possible mass segregation, I have computed the cumulative distributions of radii from the centers of the northern and southern subclusters for K6-M2, M4-M6, and M6-M8, which are shown in Figure 19. Again, the northern M4-M6 members are less centrally concentrated than the other populations. According to two-sided Kolmogorov-Smirnov tests among the northern radial distributions, the probability that the M4-M6 sample is drawn from the same parent distribution as K6-M2 and M6-M8 is 1-2%, while the latter two samples are consistent with each other. Meanwhile, no significant differences are present among the three radial distributions in the southern subcluster.
Mass segregation of the kind found in the northern subcluster has been reported in other young clusters such as IC 348 (Muench et al., 2003) and the Orion Nebula Cluster (Hillenbrand & Carpenter, 2000). In each of those clusters, the peak mass of the IMF varies from in the core to at large radii. Dynamical cluster evolution is not a plausible source of the mass segregation of low-mass stars in IC 348 and Orion, and it is even less likely at the lower stellar densities found in Chamaeleon I. Instead, it would seem that the mass segregation in these clusters must be primordial. However, it is unclear why the southern subcluster shows no segregation. Measurements of velocities for the members of Chamaeleon I and an analysis of their dependence on mass and position would likely prove to be valuable in further exploring this issue.
5.3. Constraints on Star Formation History
The spatial distribution of members of Chamaeleon I can also be used to constrain the star formation history. To search for a widely distributed population of members, Covino et al. (1997) measured Li absorption strengths and radial velocities for X-ray sources from the ROSAT all-sky survey within 170 square degrees surrounding the Chamaeleon complex of clouds. They identified 37 pre-main-sequence stars, which exhibited spectral types of late G to early M. Complimenting that study, my wide-field survey (IK2, § 2.1.2) considers a smaller area but reaches lower masses, and most importantly encompasses the peak of the IMF. These two surveys indicate that few young stars reside at large distances from the Chamaeleon I cloud.
Feigelson (1996) suggested that star formation has occurred at a constant rate for 20 Myr in Chamaeleon I and that the observed deficit of older stars ( Myr) in this cluster and other star-forming regions is caused by the dispersal of the older stars. However, in contrast to the expectations of that scenario, the wide-field surveys with ROSAT (Alcalá et al., 1995, 1997; Covino et al., 1997) and in this work have shown that the Chamaeleon I clouds are not surrounded by a large population of young stars. Similar results have been found for other star-forming regions (Briceño et al., 1997). In addition, the distributions of isochronal ages in Figure 14 are inconsistent with a constant star formation rate for 10-20 Myr.
6. Conclusions
I have presented an extensive search for new members of the Chamaeleon I star-forming region. Because the completeness limits of my survey are well-determined, I have been able to perform robust measurements of the distributions of members of Chamaeleon I as a function of mass, position, and age. The primary results of this study are summarized as follows:
-
1.
I have discovered 50 new members of Chamaeleon I, which increases the census of known members to 226 objects. The new members include 14 objects that are later than M6 ( ) and the two faintest known members of the cluster, which may have masses of only 0.005-0.01 . The current census now contains 28 members that are likely to be substellar.
-
2.
The distribution of isochronal ages for members of Chamaeleon I between 0.1-1 suggests that star formation has occurred for the past 3-4 and 5-6 Myr in the southern and northern subclusters, respectively, at rates that have declined with time.
-
3.
The IMF in Chamaeleon I reaches a maximum at a mass of 0.1-0.15 , which is similar to the turnover mass observed in IC 348 and the Orion Nebula Cluster (Hillenbrand, 1997; Hillenbrand & Carpenter, 2000; Muench et al., 2002, 2003; Luhman et al., 2003b). The substellar IMF is roughly flat in logarithmic units and shows no indication of reaching a minimum down to a completeness limit of 0.01 .
-
4.
Chamaeleon I does not contain a widely-distributed population of brown dwarfs, which is contrary to the predictions of some embryo ejection models. Instead, the substellar members share the same spatial distribution as the stars. However, low-mass stars in the northern subcluster do appear to have a wider distribution than members at other masses, which resembles the mass segregation that has been previously observed in Orion and IC 348 (Hillenbrand & Carpenter, 2000; Muench et al., 2003).
Appendix A Comments on Individual Sources
The strengths of the gravity-sensitive lines in the spectra of 2MASS 10555824-7418347 and 10435748-7633023 appear to be intermediate between those of field dwarfs and known Chamaeleon I members, indicating that these objects may be young members of the field. Similar objects have been identified toward the Taurus cloud complex (Luhman, 2006; Slesnick et al., 2006) and in the solar neighborhood (Cruz et al., 2007).
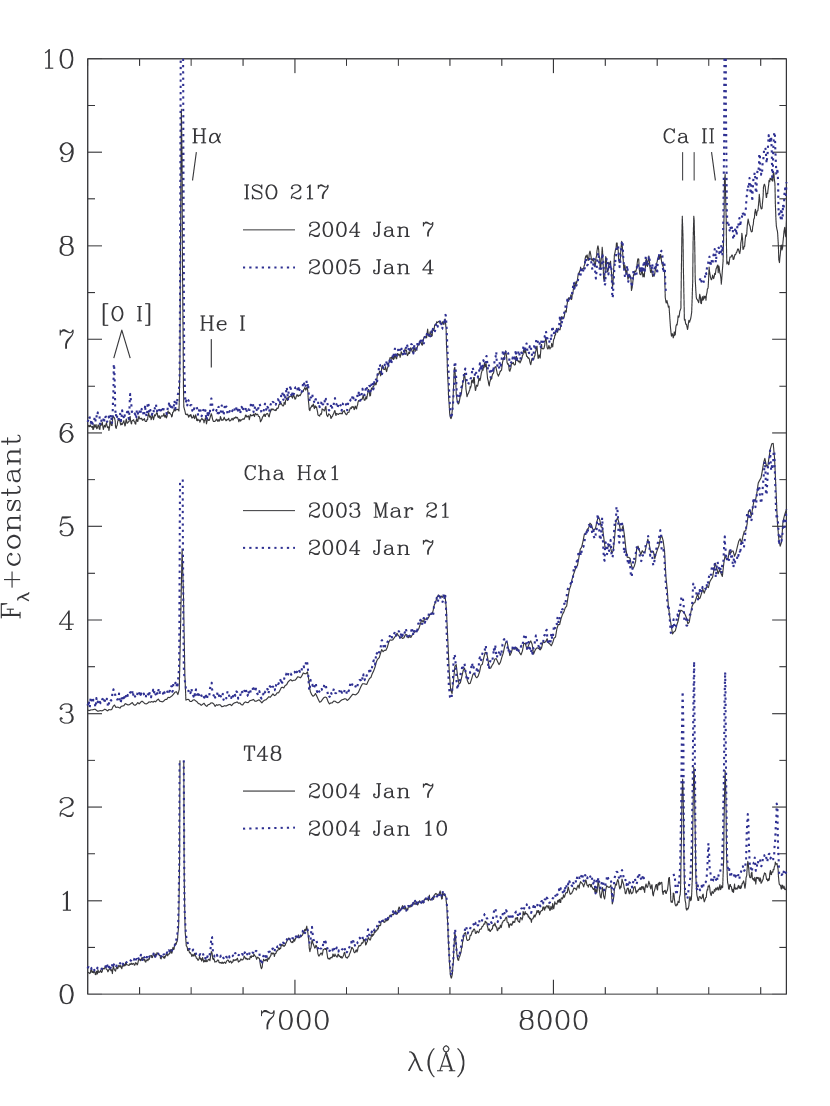
The spectra of ISO 217 from Luhman (2004a) and from January 2004 are similar, but the spectrum from January 2005 for this object exhibits stronger emission lines, brighter blue continuum, and weaker TiO than those two earlier spectra. All of these characteristics are consistent with an increase in the accretion rate. Similar variability is present in the data for Cha H 1 and T48, as shown in Figure 20. The variability for T48 occurred over a period of only three days.
ESO H 281 was resolved as a pair by Reipurth & Zinnecker (1993). The brighter component was designated as ESO H 281 A by Brandner & Zinnecker (1997) and is 2MASS 11070350-7631443. The spectral classifications from Brandner & Zinnecker (1997) and in this work indicate that this star is a background giant. The fainter component, ESO H 281 B from Brandner & Zinnecker (1997), is not resolved from the brighter star by 2MASS. It was spectroscopically confirmed as a member of Chamaeleon I by Brandner & Zinnecker (1997), but it was overlooked in the compilation of members in Luhman (2004a).
The spectrum of 2MASS 11253653-7700348 has M-type spectral features but does not match any standard dwarfs, giants, or pre-main-sequence objects. Thus, the luminosity class of this object is uncertain. It is unlikely to be a young star based on the absence of Li absorption in its spectrum.
The strengths of the Na I and K I lines in the spectrum of 2MASS 11052472-7626209 are suggestive of youth. However, because the variation of these lines between dwarfs and pre-main-sequence stars is subtle for the spectral type of this star (M2.75), it remains possible that it is a field dwarf. Similarly, the triangular -band continuum of Cha J11083040-7731387 is indicative of youth (Lucas et al., 2001), but this object appears to have strong K I absorption at 1.25 µm, which suggests higher, dwarf-like gravity. Because no spectral type of field M and L dwarfs matches the spectrum of Cha J11083040-7731387 and the apparent strength of K I may be due to low signal-to-noise, I assume that it is a member of Chamaeleon I for the purposes of this work.
Saffe et al. (2003) presented an optical spectrum for a putative new member of Chamaeleon I. They attributed their spectrum to 2MASS 11095300-7730588 and named the object SGR1. Their spectrum exhibited strong H emission and they reported a spectral type of M7 from those data. However, my spectrum of this star shows no H emission or late-type molecular bands, and instead is indicative of a reddened background field star. If placed on the color-magnitude diagram in Figure 4 (, ), this star falls well below the sequence of known members, which further indicates that it is a field star rather than a member. Finally, SGR1 should have a circumstellar disk if it has the strong H emission found by Saffe et al. (2003). However, SGR1 does not exhibit the excess emission expected from a disk in mid-IR images from Luhman et al. (2005b). The spectrum published by Saffe et al. (2003) (from multi-object spectroscopy) was probably incorrectly associated with 2MASS 11095300-7730588, and in fact may apply to a previously known member.
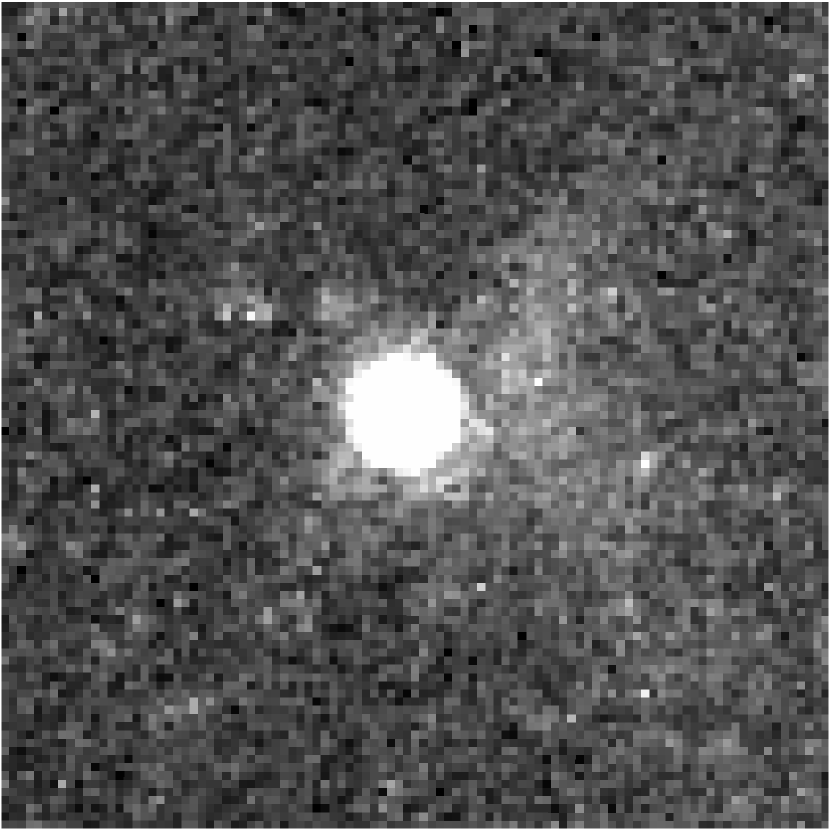
Six known members of Chamaeleon I appear below the main sequence in the H-R diagram in Figure 13, consisting of CHSM 15991, T14A, ISO 225, ESO H 569 and 574, and Cha J11081938-7731522. Low luminosity estimates were also derived by Luhman (2004a) for the first three stars and by Comerón et al. (2004) for ESO H 569 and 574. Luhman (2004a) suggested that CHSM 15991, T14A, and ISO 225 are unusually faint because they are seen only in scattered light (e.g., edge-on disks), and Comerón et al. (2004) offered the same explanation for ESO H 574. Comerón et al. (2004) concluded that ESO H 569 is more likely to have an intrinsically low luminosity rather than an edge-on disk because excess emission from a disk was not detected in mid-IR observations with ISO (Persi et al., 2000). However, ESO H 569 does exhibit strong excess emission in the Spitzer data from Luhman et al. (2005b). The absence of a detection of this star in the X-ray images from Feigelson & Lawson (2004) can be used to constrain the amount of extinction toward the star. If ESO H 569 has an X-ray luminosity in the range of values observed for classical T Tauri stars at masses of 0.4 (Telleschi et al., 2007), then the detection limit described by Feigelson & Lawson (2004) indicates an extinction of toward this star. Thus, the X-ray data from Feigelson & Lawson (2004) support the presence of an edge-on disk around ESO H 569. The sixth star below the main sequence in Figure 13, Cha J11081938-7731522, is newly identified as a cluster member in this work. It also appears subluminous in Figures 4, 5, and 11. Although it falls below the sequences of known members in those diagrams, Cha J11081938-7731522 was not rejected as a field star because it was red enough in Figure 4 to be selected as a candidate (substellar) member. The presence of extended emission around this star in the ACS image in Figure 21 supports the idea that it is seen in scattered light. In particular, the shape of the emission resembles the butterfly morphology that characterizes edge-on disks.
Kraus & Hillenbrand (2007) presented a tabulation of 14 candidate wide companions to known members of Chamaeleon I. My photometry and spectroscopy provide new constraints on the cluster membership of some of these candidates. Through spectroscopy, I have classified the candidate brown dwarf companion to ISO 250, 2MASS 11103749-7722083, as a field star. Note that this candidate is different from the candidate companion to ISO 250 that was found by López Martí et al. (2004). I also have spectroscopically classified the candidate near KG 102 as a field star. The candidate companions to C7-1 and T14A are below the cluster sequence in Figure 4 ( and 18.4, and 0.8), indicating that they are probably not members of the cluster. The candidate companions to T3 and T26 are spectroscopically confirmed as members in this work. The candidate companion to T39A+B, 2MASS 11091297-7729115, is a candidate member according to my color-magnitude diagrams. It is the one remaining bright candidate appearing in Figure 10. Although it was included in the list of candidate companions from Kraus & Hillenbrand (2007), the candidate near T33 was already confirmed as a cluster member by previous studies (e.g., Luhman, 2004a).
Appendix B Comparison to Previous Surveys
B.1. Feigelson & Lawson (2004) and Stelzer et al. (2004)
Using the Chandra X-ray Observatory, Feigelson & Lawson (2004) obtained an image of a field in the northern subcluster of Chamaeleon I, which is indicated in Figure 1a. They detected 27 previously known members and identified no new candidate members. Feigelson & Lawson (2004) concluded that the census of known members in their survey field is complete to masses of 0.1 . The membership classifications based on the X-ray data from Feigelson & Lawson (2004) agreed well with the classifications by Luhman (2004a) using other diagnostics. ISO 165 was the only star that was classified differently between the two studies. Luhman (2004a) classified ISO 165 as a member of Chamaeleon I because of its strong H emission (3) and weak Na I and K I lines that are indicative of low surface gravity. In addition, it cannot be a foreground dwarf because it significantly reddened, while it cannot be a background dwarf because such an object would appear below the main sequence when placed on the H-R diagram at the distance of Chamaeleon I, which is not the case. In comparison, Feigelson & Lawson (2004) suggested that ISO 165 might be a nonmember because it was not detected in their X-ray data. However, the spectral type of M5.5 for this object corresponds to a mass of 0.1-0.15 , which is near their completeness limit, so it is not surprising that it was not detected. In the mid-IR images from Luhman et al. (2005b), ISO 165 exhibits mid-IR excess emission that indicates the presence of a disk, which provides further evidence of the youth and membership of this object in Chamaeleon I. In addition to ISO 165, seven other known members of Chamaeleon I were not detected in the X-ray data from Feigelson & Lawson (2004). Six of these sources have spectral types later than M7 ( ), and thus detections were not expected since they fall below the mass completeness limit of the X-ray data. The seventh member, ESO H 569 (Comerón et al., 2004), has a relatively high mass of 0.4 based on its spectral type of M2.5, and yet it was not detected by Feigelson & Lawson (2004), which suggests the presence of extremely high extinction toward this star (, § A).
Using XMM-Newton, Stelzer et al. (2004) obtained an X-ray image of a field in the southern subcluster of Chamaeleon I, which is indicated in Figure 1a. Their image encompassed 71 of the known members in the current census of Chamaeleon I (§ 2.3), 38 of which were detected. One of the X-ray sources from Stelzer et al. (2004), HD 97240 (KG 2001-78), was treated as a possible member of Chamaeleon I in that study. However, it is probably a foreground star rather than a cluster member based on its proper motion and parallax (Whittet et al., 1987; Perryman et al., 1997).
To investigate the completeness of the X-ray observations by Feigelson & Lawson (2004) and Stelzer et al. (2004), I show in Figure 22 the distributions of spectral types for all known members of Chamaeleon I within each survey field and for the members detected in X-rays. Five and three of the known members in the XMM-Newton and Chandra fields, respectively, are not included in the histograms because accurate spectral types are not available for them. According to Figure 22, the XMM-Newton data are complete for spectral types earlier than M2 ( ) and the level of completeness steadily decreases with later types. In comparison, the completeness of the Chandra image from Feigelson & Lawson (2004) changes more abruptly and remains close to 100% down to M6. To examine the origin of the differences in completeness limits between these two X-ray studies, I have included in Figure 22 my estimates of as function of spectral type. At M5-M6, the members that were not detected by XMM-Newton have systematically higher extinctions than the detected members, indicating that extinction prevented their detection. Most of the nondetections at earlier types were too close to brighter stars to be resolved by XMM-Newton, including T39B, T30, and 2MASS 11072022-7738111. Compared to the XMM-Newton field, the extinction from the cloud decreases more rapidly from the center to the edge of the Chandra field, as shown in Figure 1. Because the low-mass stars are distributed more widely than the high-mass stars in the northern subcluster of Chamaeleon I (§ 5)222For Chamaeleon I members within the Chandra image, the average distances from the center of the image are 3.5 and for spectral types of M3 and M3-M6, respectively., they are subjected to lower extinction in the Chandra field than in the XMM-Newton field. As a result, Chandra was able to detect a higher fraction of M5-M6 stars than XMM-Newton.
Feigelson & Lawson (2004) measured an IMF from the sample of members detected in their Chandra data. Their IMF exhibited a significant deficiency of low-mass stars (0.1-0.3 ) relative to the Orion Nebula Cluster (Hillenbrand, 1997; Hillenbrand & Carpenter, 2000; Muench et al., 2002). The same deficiency is present when the Chandra field is compared to the XMM-Newton field in the southern subcluster and the larger area in Chamaeleon I, as shown in Figures 16 and 22. The membership lists from Feigelson & Lawson (2004) and this work agree almost perfectly down to M6, or 0.1 , so this effect is not a result of incompleteness in the Chandra data. Indeed, my census is complete to much lower masses for most of the Chandra field, and it still exhibits the deficit of low-mass stars (Figure 22). Instead of incompleteness, the anomalous IMF in the Chandra field is a reflection of the segregation of low-mass stars to larger radii surrounding the northern subcluster that was described in § 5.
B.2. López Martí et al. (2004)
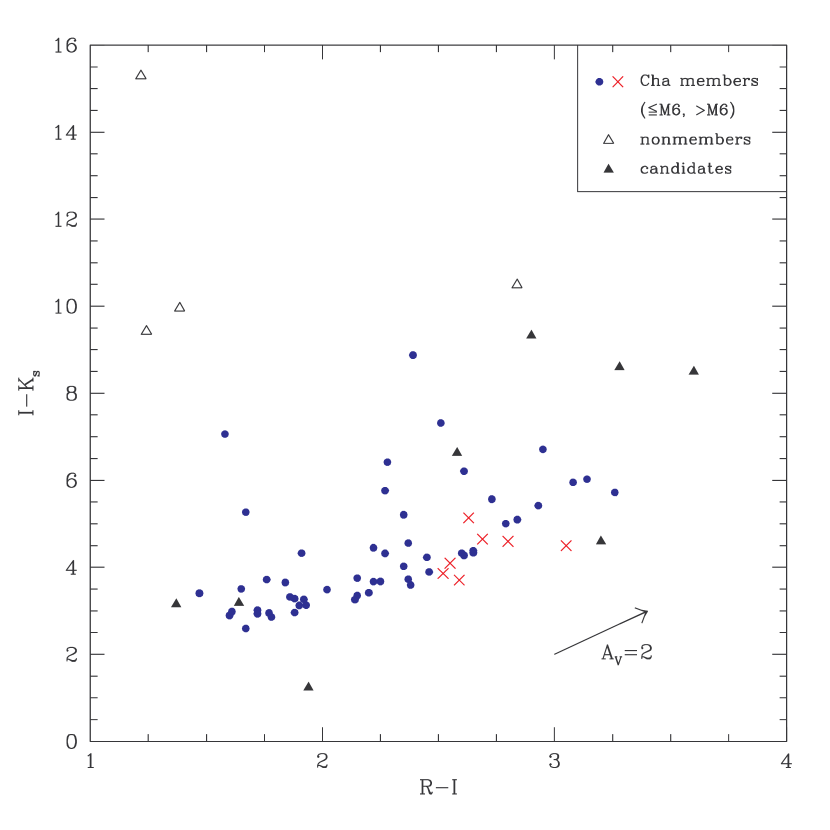
López Martí et al. (2004) obtained images in , , H, and two narrowband optical filters toward 1.2 deg2 in Chamaeleon I. With these data, they identified 69 candidate members of the cluster. They selected three additional stars as candidates based on X-ray emission and IR excess emission. Among these 72 candidates, 50 objects were spectroscopically classified as members by Luhman (2004a) and Comerón et al. (2004) and 10 objects have been classified as members in this work. Four candidates are field stars based on my spectroscopy (Table 4). The remaining eight candidates lack accurate spectral classifications, consisting of sources 424, 427, 428, 441, 607, 618, 619, and 749 from López Martí et al. (2004). The first five objects were classified as late M or early L by López Martí et al. (2004) through their optical colors, while the latter three candidates exhibited bluer colors indicative of M4. These candidates were originally identified by López Martí et al. (2004) through a diagram of versus ; their candidacy can be further refined by plotting them in a diagram of versus (Luhman, 2001). In Figure 23, I show this diagram for the 72 candidates from López Martí et al. (2004), which are divided into members at M6 and M6, nonmembers, and the eight candidates that lack spectral classifications. In the latter group, the five objects with the reddest colors are the ones classified as late M or L by López Martí et al. (2004). Only source 424 exhibits colors that are consistent with those of the confirmed late-type members. The other four candidates are too red in for their , which suggests that they are highly reddened early-type objects rather than late-type sources. This conclusion is supported by the near-IR spectra of sources 428 and 607 from Gómez & Mardones (2003), which lack the strong steam absorption that is expected for late M and L types.
López Martí et al. (2004) estimated spectral types for their 72 candidates from optical colors. The classifications of 29 candidates were later than M6. In comparison, 15 and seven of these 29 objects have been spectroscopically classified as members with types of M6 and M6, respectively. Three late-type candidates are field stars according to my spectroscopy and three candidates are likely to have earlier types based on their positions in Figure 23 and the absence of steam absorption in the spectra from Gómez & Mardones (2003), while source 424 remains a viable late-type candidate. Thus, no more than eight of the 29 objects that were classified as later than M6 by López Martí et al. (2004) actually have spectral types in this range. It is likely that the types from López Martí et al. (2004) were systematically too late because of extinction. When estimating spectral types from the colors of their candidates, López Martí et al. (2004) did not correct for extinction, which was unknown without spectroscopic data. Because some of their candidates were field stars and their spectral types exhibited systematic errors, the validity of the IMF derived from that sample of candidates by López Martí et al. (2004) is questionable.
B.3. Comerón et al. (2004)
Comerón et al. (2004) performed an H survey across all of Chamaeleon I and obtained spectroscopy of candidate members appearing in those images. They discovered 18 new members of the cluster, seven and eight of which were independently found by Luhman (2004a) and this study. The spectral types from Comerón et al. (1999, 2000, 2004) and Neuhäuser & Comerón (1999) are systematically later than those from Luhman (2004a) and this work by an average of 0.5 subclass.
References
- Adams & Fatuzzo (1996) Adams, F. C., & Fatuzzo, M. 1996, ApJ, 464, 256
- Alcalá et al. (1997) Alcalá, J. M., Krautter, J., Covino, E., Neuhäuser, R., Schmitt, J. H. M. M., & Wichmann, R. 1997, A&A, 319, 184
- Alcalá et al. (1995) Alcalá, J. M., Krautter, J., Schmitt, J. H. M. M., Covino, E., Wichmann, R., & Mundt, R. 1995, A&AS, 114, 109
- Allers et al. (2006) Allers, K. N., Kessler-Silacci, J. E., Cieza, L. A., & Jaffe, D. T. 2006, ApJ, 644, 364
- Allers et al. (2007) Allers, K. N., et al. 2007, ApJ, 657, 511
- Appenzeller (1979) Appenzeller, I. 1979, A&A, 71, 305
- Appenzeller et al. (1983) Appenzeller, I., Jankovics, I., & Krautter, J. 1983, A&AS, 53, 291
- Baraffe et al. (1998) Baraffe, I., Chabrier, G., Allard, F., & Hauschildt, P. H. 1998, A&A, 337, 403
- Barrado y Navascués et al. (2004) Barrado y Navascués, D., Stauffer, J. R., Bouvier, J., Jayawardhana, R., & Cuillandre, J.-C. 2004, ApJ, 610, 1064
- Bate (2005) Bate, M. R. 2005, MNRAS, 363, 363
- Bate et al. (2002) Bate, M. R., Bonnell, I. A., & Bromm, V. 2002, MNRAS, 332, L65
- Béjar et al. (2001) Béjar, V. J. S., et al. 2001, ApJ, 556, 830
- Bertout et al. (1999) Bertout, C., Robichon, N., & Arenou, F. 1999, A&A, 352, 574
- Bonnell, Bate, & Vine (2003) Bonnell, I. A., Bate, M. R., Vine, S. G. 2003, MNRAS, 343, 413
- Boss (1988) Boss, A. 1988, ApJ, 331, 370
- Boss (2001) Boss, A. 2001, ApJ, 551, L167
- Boulanger et al. (1998) Boulanger, F., Bronfman, L., Dame, T. M., & Thaddeus, P. 1998, A&A, 332, 273
- Brandner & Zinnecker (1997) Brandner, W., & Zinnecker, H. 1997, A&A, 321, 220
- Briceño et al. (1997) Briceño, C., Hartmann, L., Stauffer, J. R., Gagne, M., Stern, R. A., & Caillault, J.-P. 1997, AJ, 113, 740
- Briceño et al. (2002) Briceño, C., Luhman, K. L., Hartmann, L., Stauffer, J. R., & Kirkpatrick, J. D. 2002, ApJ, 580, 317
- Burrows et al. (1997) Burrows, A., et al. 1997, ApJ, 491, 856
- Cambrésy et al. (1997) Cambrésy, L., et al. 1997, A&A, 324, L5
- Carpenter et al. (2002) Carpenter, J. M., Hillenbrand, L. A., Skrutskie, M. F., & Meyer, M. R. 2002, AJ, 124, 1001
- Chabrier et al. (2000) Chabrier, G., Baraffe, I., Allard, F., & Hauschildt, P. 2000, ApJ, 542, L119
- Chelli et al. (1995) Chelli, A., Cruz-Gonzalez, I., & Reipurth, B. 1995, A&AS, 114, 135
- Comerón et al. (2000) Comerón, F., Neuhäuser, R., & Kaas, A. A. 2000, A&A, 359, 269
- Comerón et al. (2004) Comerón, F., Reipurth, B., Henry, A., & Fernández, M. 2004, A&A, 417, 583
- Comerón et al. (1999) Comerón, F., Rieke, G. H., & Neuhäuser, R. 1999, A&A, 343, 477
- Correia et al. (2006) Correia, S., Zinnecker, H., Ratzka, Th., & Sterzik, M. F. 2006, A&A, 459, 909
- Covino et al. (1997) Covino, E., Alcala, J. M., Allain, S., Bouvier, J., Terranegra, L., & Krautter, J. 1997, A&A, 328, 187
- Cruz et al. (2007) Cruz, K. L., et al. 2007, AJ, 133, 439
- Dahn et al. (2002) Dahn, C. C., et al. 2002, AJ, 124, 1170
- Delgado-Donate, Clarke, & Bate (2003) Delgado-Donate, E. J., Clarke, C. J., & Bate, M. R. 2003, MNRAS, 342, 926
- Dobbie et al. (2002) Dobbie, P. D., Kenyon, F., Jameson, R. F., & Hodgkin, S. T. 2002, MNRAS, 331, 445
- Elmegreen (2000) Elmegreen, B. G. 2000, ApJ, 530, 277
- Epchtein et al. (1999) Epchtein, N., et al. 1999, A&A, 349, 236
- Feigelson (1996) Feigelson, E. D. 1996, ApJ, 468, 306
- Feigelson & Kriss (1989) Feigelson, E. D., & Kriss, G. A. 1989, ApJ, 338, 262
- Feigelson & Lawson (2004) Feigelson, E. D., & Lawson, W. A. 2004, ApJ, 614, 267
- Feigelson et al. (2003) Feigelson, E. D., Lawson, W. A., & Garmire, G. P. 2003, ApJ, 599, 1207
- Filippenko (1982) Filippenko, A. V. 1982, PASP, 94, 715
- Gauvin & Strom (1992) Gauvin, L. S., & Strom, K. M. 1992, ApJ, 385, 217
- Ghez et al. (1997) Ghez, A. M., McCarthy, D. W., Patience, J. L., & Beck, T. L. 1997, ApJ, 481, 378
- Gómez & Mardones (2003) Gómez, M., & Mardones, D. 2003, AJ, 125, 2134
- Goodwin & Whitworth (2007) Goodwin, S. P., & Whitworth, A. 2007, A&A, 466, 943
- Haisch et al. (2004) Haisch, K. E., Greene, T. P., Barsony, M., & Stahler, S. W. 2004, AJ, 127, 1747
- Hartigan (1993) Hartigan, P. 1993, AJ, 105, 1511
- Hartmann (1998) Hartmann, L. 1998, Accretion Processes in Star Formation (Cambridge: Cambridge Univ. Press)
- Hartmann (2001) Hartmann, L. 2001, AJ, 121, 1030
- Hartmann (2002) Hartmann, L. 2002, ApJ, 578, 914
- Hartmann, Ballesteros-Paredes, & Bergin (2001) Hartmann, L., Ballesteros-Paredes, J., & Bergin, E. 2001, ApJ, 562, 852
- Hillenbrand (1997) Hillenbrand, L. A. 1997, AJ, 113, 1733
- Hillenbrand & Carpenter (2000) Hillenbrand, L. A., & Carpenter, J. M. 2000, ApJ, 540, 236
- Hillenbrand & Hartmann (1998) Hillenbrand, L. A., & Hartmann, L. W. 1998, ApJ, 492, 540
- Huenemoerder et al. (1994) Huenemoerder, D. P., Lawson, W. A., & Feigelson, E. D. 1994, MNRAS, 271, 967
- Kenyon & Hartmann (1995) Kenyon, S. J., & Hartmann, L. 1995, ApJS, 101, 117
- Kirkpatrick et al. (2006) Kirkpatrick, J. D., et al. 2006, ApJ, 639, 1120
- Kraus & Hillenbrand (2007) Kraus, A. L., & Hillenbrand, L. A. 2007, ApJ, 662, 413
- Kroupa & Bouvier (2003) Kroupa, P., & Bouvier, J. 2003, MNRAS, 346, 369
- Landolt (1992) Landolt, A. U. 1992, AJ, 104, 340
- Larson (1995) Larson, R. B. 1995, MNRAS, 272, 213
- Larson (1985) Larson, R. B. 1985, MNRAS, 214, 379
- Leggett (1992) Leggett, S. K. 1992, ApJS, 82, 351
- Levine et al. (2006) Levine, J. L., Steinhauer, A., Elston, R. J., & Lada, E. A. 2006, ApJ, 646, 1215
- López Martí et al. (2004) López Martí, B., Eislöffel, J., Scholz, A., & Mundt, R. 2004, A&A, 416, 555
- Low & Lynden-Bell (1976) Low, C., & Lynden-Bell, D. 1976, MNRAS, 176, 367
- Lucas et al. (2001) Lucas, P. W., Roche, P. F., Allard, F., & Hauschildt, P. H. 2001, MNRAS, 326, 695
- Lucas et al. (2005) Lucas P. W., Roche P. F., & Tamura M. 2005, MNRAS, 361, 211
- Lucas et al. (2006) Lucas P. W., Weights, D. J., Roche P. F., & Riddick, F. C. 2006, MNRAS, 373, L60
- Luhman (1999) Luhman, K. L. 1999, ApJ, 525, 466
- Luhman (2000) Luhman, K. L. 2000, ApJ, 544, 1044
- Luhman (2001) Luhman, K. L. 2001, ApJ, 560, 287
- Luhman (2004a) Luhman, K. L. 2004a, ApJ, 602, 816
- Luhman (2004b) Luhman, K. L. 2004b, ApJ, 614, 398
- Luhman (2004c) Luhman, K. L. 2004c, ApJ, 616, 1033
- Luhman (2004d) Luhman, K. L. 2004d, ApJ, 617, 1216
- Luhman (2006) Luhman, K. L. 2006, ApJ, 645, 676
- Luhman (2007) Luhman, K. L. 2007, Handbook of Star Forming Regions, ASP Conference Series, submitted
- Luhman et al. (2003a) Luhman K. L., Briceño C., Stauffer J. R., Hartmann L., Barrado y Navascués D., & Caldwell N. 2003a, ApJ, 590, 348
- Luhman et al. (2004) Luhman, K. L., Peterson, D. E., & Megeath, S. T. 2004, ApJ, 617, 565
- Luhman & Potter (2006) Luhman, K. L., & Potter, D. 2006, ApJ, 638, 887
- Luhman et al. (2005a) Luhman, K. L., Stauffer, J. R., & Mamajek, E. E. 2005a, ApJ, 628, L69
- Luhman et al. (2000) Luhman, K. L., et al. 2000, ApJ, 540, 1016
- Luhman et al. (2003b) Luhman, K. L., et al. 2003b, ApJ, 593, 1093
- Luhman et al. (2005b) Luhman, K. L., et al. 2005b, ApJ, 631, L69
- Luhman et al. (2005c) Luhman, K. L., et al. 2005c, ApJ, 635, L93
- Luhman et al. (2006) Luhman, K. L., et al. 2006, ApJ, 649, 894
- Meyer et al. (2000) Meyer, M. R., Adams, F. C., & Larson, R. B. 2000, Protostars & Planets IV, ed, Mannings, V., Boss, A. P., & Russell, S. S. (Tucson: Univ. Arizona), 121
- Mizuno et al. (2001) Mizuno, A., et al. 2001, PASJ, 53, 1071
- Muench et al. (2002) Muench, A. A., Lada, E. A., Lada, C. J., & Alves, J. 2002, ApJ, 573, 366
- Muench et al. (2003) Muench, A. A., et al. 2003, AJ, 125, 2029
- Muzerolle et al. (2005) Muzerolle, J., Luhman, K. L., Briceño, C., Hartmann, L., & Calvet, N. 2005, ApJ, 625, 906
- Neuhäuser & Comerón (1999) Neuhäuser, R., & Comerón, F., 1999, A&A, 350, 612
- Padoan & Nordlund (2002) Padoan, P., & Nordlund, Å. 2002, ApJ, 576, 870
- Palla & Galli (1997) Palla, F., & Galli, D. 1997, ApJ, 476, L35
- Palla & Stahler (1999) Palla, F., & Stahler, S. W. 1999, ApJ, 525, 772
- Palla & Stahler (2000) Palla, F., & Stahler, S. W. 2000, ApJ, 540, 255
- Palla & Stahler (2002) Palla, F., & Stahler, S. W. 2002, ApJ, 581, 1194
- Perryman et al. (1997) Perryman, M. A. C., et al. 1997, A&A, 323, L49
- Persi et al. (2005) Persi, P., Tapia, M., Gómez, M., Roth, M., & Marenzi, A. R. 2005, A&A, 431, 539
- Persi et al. (2000) Persi, P., et al. 2000, A&A, 357, 219
- Preibisch et al. (2003) Preibisch, T., Stanke, T., & Zinnecker, H. 2003, ApJ, 409, 147
- Rees (1976) Rees, M. J. 1976, MNRAS, 176, 483
- Reid & Gizis (1997) Reid, I. N., & Gizis, J. E. 1997, AJ, 113, 2246
- Reipurth & Clarke (2001) Reipurth, B., & Clarke, C. 2001, AJ, 122, 432
- Reipurth et al. (1996) Reipurth, B., Nyman, L.-Å., & Chini, R. 1996, A&A, 314, 258
- Reipurth & Zinnecker (1993) Reipurth, B., & Zinnecker, H. 1993, A&A, 278, 81
- Rydgren (1980) Rydgren, A. E. 1980, AJ, 85, 444
- Saffe et al. (2003) Saffe, C., Randich, S., Mardones, D., Caselli, P., Persi, P., & Racca, G. 2003, A&A, 409, 993
- Silk (1977) Silk, J. 1977, ApJ, 214, 152
- Sirianni et al. (2005) Sirianni, M., et al. 2005, PASP, 117, 1049
- Skrutskie et al. (2006) Skrutskie, M., et al. 2006, AJ, 131, 1163
- Slesnick et al. (2006) Slesnick, C. L., Carpenter, J. M., Hillenbrand, L. A., & Mamajek, E. E. 2004, AJ, 132, 2665
- Slesnick et al. (2004) Slesnick, C. L., Hillenbrand, L. A., & Carpenter, J. M. 2004, ApJ, 610, 1045
- Steele & Howells (2000) Steele, I. A., & Howells, L. 2000, MNRAS, 313, 43
- Stelzer et al. (2004) Stelzer, B., Micela, G., & Neuhäuser, R. 2004, A&A, 423, 1029
- Telleschi et al. (2007) Telleschi, A., Güdel, M., Briggs, K. R., Audard, M., & Palla, F. 2007, A&A, in press
- Umbreit et al. (2005) Umbreit, S., Burkert, A., Henning, T., Mikkola, S., & Spurzem, R. 2005, ApJ, 623, 940
- Whittet et al. (1987) Whittet, D. C. B., Kirrane, T. M., Kilkenny, D., Oates, A. P., Watson, F. G., & King, D. J. 1987, MNRAS, 224, 497
- Whittet et al. (1997) Whittet, D. C. B., et al. 1997, A&A, 327, 1194
- Whitworth & Stamatellos (2006) Whitworth, A. P., & Stamatellos, D. 2006, A&A, 458, 817
- Wichmann et al. (1998) Wichmann, R., Bastian, U., Krautter, J., Jankovics, I., & Ruciński, S. M. 1998, MNRAS, 301, L39
| Name | aaSecond DENIS Release. | bb2MASS Point Source Catalog. | bb2MASS Point Source Catalog. | bb2MASS Point Source Catalog. | ccMeasured with ISPI in this work. | ccMeasured with ISPI in this work. | ccMeasured with ISPI in this work. | ||||
|---|---|---|---|---|---|---|---|---|---|---|---|
| 2M J10314767-7917180 | 15.35 | 13.41 | 12.84 | 12.51 | |||||||
| 2M J10435748-7633023 | 14.73 | 12.96 | 12.39 | 12.07 | |||||||
| 2M J10452780-7715335 | 11.44 | 8.65 | 7.65 | 7.17 | |||||||
| 2M J10523694-7440287 | 13.60 | 11.45 | 10.71 | 10.44 | |||||||
| 2M J10555824-7418347 | 16.39 | 13.92 | 13.34 | 12.93 | |||||||
| 2M J10561638-7630530 | 14.92 | 12.54 | 11.94 | 11.52 | |||||||
| 2M J10580597-7711501 | 15.89 | 13.40 | 12.69 | 12.27 | |||||||
| 2M J10593228-7753268 | 14.96 | 13.19 | 12.61 | 12.30 | |||||||
| 2M J11001473-7757103 | 12.71 | 11.00 | 10.36 | 10.04 | |||||||
| 2M J11011370-7722387 | 15.21 | 13.06 | 12.38 | 12.09 | |||||||
| 2M J11011926-7732383 | 16.59 | 13.10 | 12.22 | 11.63 | |||||||
| 2M J11013205-7718249 | 17.79 | 14.63 | 14.02 | 13.54 | |||||||
| 2M J11014949-7412268 | 12.52 | 10.18 | 9.43 | 8.88 | |||||||
| 2M J11021927-7536576 | 14.09 | 12.13 | 11.54 | 11.19 | |||||||
| 2M J11022610-7502407 | 13.67 | 11.76 | 11.12 | 10.81 | |||||||
| 2M J11024183-7724245 | 15.29 | 12.80 | 11.99 | 11.62 | |||||||
| 2M J11035902-7743349 | 13.41 | 12.42 | 10.32 | 9.48 | 9.05 | ||||||
| 2M J11045890-7656550 | 11.48 | 10.13 | 9.30 | 9.10 | |||||||
| 2M J11050005-7728211 | 22.39 | 19.97 | 16.38 | 14.70 | 13.95 | ||||||
| 2M J11050666-7739444 | 18.73 | 16.79 | 16.79 | 13.29 | 11.72 | 11.03 | 13.30 | 11.72 | 11.00 | ||
| 2M J11050752-7812063 | 13.74 | 11.78 | 11.10 | 10.82 | |||||||
| 2M J11050937-7706578 | 12.72 | 11.70 | 11.78 | 10.27 | 9.45 | 9.21 | |||||
| Cha J11051041-7728228 | 22.26 | 19.85 | |||||||||
| 2M J11051264-7739070 | 18.37 | 16.50 | 16.55 | 13.25 | 11.88 | 11.25 | 13.23 | 11.89 | 11.22 | ||
| 2M J11051798-7706565 | 12.68 | 11.58 | 11.67 | 9.97 | 8.93 | 8.70 | |||||
| 2M J11052114-7731541 | 23.17 | 20.86 | 15.83 | 14.61 | 17.40 | 15.82 | 15.07 | ||||
| 2M J11052272-7709290 | 17.61 | 15.46 | 15.38 | 13.01 | 12.24 | 11.87 | |||||
| 2M J11052472-7626209 | 13.09 | 11.47 | 10.74 | 10.52 | |||||||
| 2M J11052489-7620373 | 11.61 | 10.49 | 9.81 | 9.69 | |||||||
| 2M J11052850-7639489 | 11.28 | 9.88 | 9.14 | 8.87 | |||||||
| 2M J11053587-7638034 | 11.42 | 10.18 | 9.50 | 9.26 | |||||||
| 2M J11053731-7738539 | 21.52 | 19.53 | 21.18 | 20.01 | 15.50 | 13.97 | 13.09 | 15.45 | 13.86 | 13.10 | |
| 2M J11054296-7745213 | 16.42 | 14.53 | 14.38 | 11.78 | 10.62 | 10.12 | |||||
| 2M J11054361-7731525 | 23.32 | 20.84 | 17.09 | 15.52 | 14.95 | 17.16 | 15.66 | 14.89 | |||
| 2M J11054371-7729113 | 22.70 | 20.18 | 16.50 | 15.24 | 14.43 | 16.53 | 15.20 | 14.42 | |||
| 2M J11054577-7730074 | 23.04 | 20.69 | 16.72 | 15.21 | 14.28 | 16.80 | 15.30 | 14.45 | |||
| Cha J11054699-7737247 | 25.80 | 24.14 | 17.33 | 16.39 | |||||||
| 2M J11054972-7640462 | 11.46 | 10.20 | 9.49 | 9.25 | |||||||
| Cha J11055024-7739268 | 25.93 | 24.38 | 18.07 | 17.09 | |||||||
| 2M J11055096-7719524 | 19.87 | 17.87 | 17.81 | 13.94 | 12.33 | 11.57 | |||||
| 2M J11055683-7656438 | 11.90 | 10.64 | 9.90 | 9.71 | |||||||
| 2M J11060010-7507252 | 14.15 | 12.33 | 11.75 | 11.42 | |||||||
| 2M J11060466-7710063 | 16.52 | 14.87 | 14.88 | 13.10 | 12.35 | 12.00 | |||||
| 2M J11060633-7743443 | 20.17 | 18.14 | 17.94 | 23.57 | 22.03 | 14.19 | 12.60 | 11.80 | 14.19 | 12.61 | 11.86 |
| 2M J11061896-7729256 | 23.48 | 20.82 | 15.69 | 14.89 | 17.14 | 15.60 | 14.79 | ||||
| Cha J11062045-7743281 | 25.93 | 24.41 | 18.11 | 17.39 | |||||||
| 2M J11062554-7633418 | 15.88 | 13.01 | 12.01 | 11.49 | |||||||
| Cha J11063259-7746281 | 24.78 | 23.17 | 18.55 | 16.87 | 16.00 | ||||||
| 2M J11063479-7645404 | 12.65 | 11.26 | 10.60 | 10.34 | |||||||
| Cha J11063721-7740259 | 25.51 | 23.90 | 17.48 | 16.52 | |||||||
| 2M J11063841-7612032 | 10.46 | 8.44 | 7.40 | 6.99 | |||||||
| Cha J11064199-7738330 | 25.64 | 24.10 | 19.20 | 17.84 | 16.70 | ||||||
| Cha J11064218-7736510 | 25.97 | 24.46 | 18.11 | 17.27 | |||||||
| 2M J11064235-7632450 | 13.61 | 11.46 | 10.35 | 9.93 | |||||||
| 2M J11064274-7636124 | 11.43 | 10.13 | 9.59 | 9.35 | |||||||
| 2M J11064586-7625317 | 11.18 | 9.91 | 9.24 | 9.04 | |||||||
| 2M J11065939-7530559 | 15.79 | 13.73 | 13.14 | 12.70 | |||||||
| 2M J11065986-7651181 | 10.69 | 8.75 | 7.66 | 7.32 | |||||||
| 2M J11070324-7610565 | 16.48 | 13.85 | 13.12 | 12.75 | |||||||
| 2M J11070350-7631443 | 12.95 | 11.09 | 10.09 | 9.71 | |||||||
| 2M J11070380-7635440 | 10.57 | 9.49 | 8.99 | 8.73 | |||||||
| 2M J11072022-7738111 | 15.94 | 14.21 | 8.41 | 7.70 | 7.28 | ||||||
| 2M J11072040-7729403 | 14.91 | 13.07 | 13.00 | 11.13 | 10.55 | 10.26 | 10.14 | ||||
| 2M J11072443-7743489 | 19.55 | 17.07 | 16.93 | 13.45 | 12.42 | 11.84 | 13.49 | 12.44 | 11.86 | ||
| 2M J11072446-7742265 | 15.90 | 14.52 | 14.46 | 12.13 | 11.07 | 10.64 | 10.63 | ||||
| Cha J11072647-7742408 | 23.30 | 21.59 | 17.53 | 16.45 | 15.59 | ||||||
| 2M J11073280-7748594 | 14.41 | 13.19 | 13.15 | 11.11 | 10.05 | 9.68 | |||||
| 2M J11073677-7735167 | 18.44 | 16.51 | 16.33 | 12.53 | 10.72 | 9.88 | 12.44 | 9.86 | |||
| 2M J11073737-7733093 | 19.97 | 18.04 | 17.76 | 13.64 | 11.73 | 10.86 | 13.59 | 11.72 | 10.83 | ||
| 2M J11073832-7747168 | 16.72 | 14.70 | 14.53 | 12.24 | 11.40 | 11.03 | 12.24 | 11.40 | 10.96 | ||
| 2M J11073840-7552519 | 14.66 | 12.77 | 12.12 | 11.80 | |||||||
| 2M J11074521-7738049 | 19.96 | 17.48 | 17.22 | 11.90 | 9.42 | 8.18 | |||||
| 2M J11074763-7711156 | 13.53 | 12.56 | 12.60 | 10.94 | 10.12 | 9.84 | |||||
| 2M J11075431-7724571 | 21.48 | 19.23 | 15.99 | 14.59 | 14.02 | ||||||
| 2M J11075613-7421065 | 16.06 | 13.82 | 13.19 | 12.87 | |||||||
| 2M J11075699-7741558 | 15.64 | 14.02 | 13.93 | 11.13 | 9.77 | 9.23 | |||||
| 2M J11075993-7715317 | 17.87 | 15.63 | 15.45 | 12.52 | 11.65 | 11.17 | |||||
| 2M J11080234-7640343 | 18.21 | 15.81 | 15.46 | 12.95 | 12.31 | 11.95 | 12.88 | 12.32 | 12.00 | ||
| 2M J11080282-7748375 | 16.58 | 15.07 | 15.02 | 12.41 | 11.11 | 10.58 | |||||
| 2M J11080609-7739406 | 22.49 | 20.82 | 17.36 | 15.99 | 15.03 | 16.91 | 15.86 | 15.17 | |||
| 2M J11081069-7637424 | 13.85 | 12.87 | 12.76 | 11.20 | 10.33 | 10.06 | |||||
| 2M J11081241-7719123 | 22.48 | 19.64 | 13.33 | 10.49 | 9.07 | ||||||
| Cha J11081578-7640198 | 22.20 | 19.85 | 17.95 | 16.94 | 16.67 | ||||||
| 2M J11081916-7656525 | 13.65 | 11.68 | 10.69 | 10.38 | |||||||
| Cha J11081938-7731522 | 22.04 | 19.64 | 20.85 | 20.21 | 17.30 | 16.49 | 16.28 | ||||
| 2M J11082492-7721579 | 21.88 | 19.61 | 14.75 | 12.65 | 11.70 | ||||||
| 2M J11082570-7716396 | 23.46 | 20.75 | 16.59 | 15.52 | 14.40 | ||||||
| Cha J11082692-7634482 | 23.22 | 20.81 | 18.36 | 17.52 | 16.86 | ||||||
| 2M J11083016-7728480 | 23.00 | 20.60 | 15.87 | 14.01 | 13.07 | 15.98 | 14.04 | 13.06 | |||
| Cha J11083040-7731387 | 23.72 | 22.03 | 17.84 | 16.75 | 15.97 | ||||||
| 2M J11083897-7614457 | 10.87 | 9.30 | 8.31 | 7.95 | |||||||
| 2M J11084845-7718233 | 19.34 | 17.36 | 17.19 | 13.26 | 11.46 | 10.66 | |||||
| 2M J11084952-7638443 | 22.66 | 19.93 | 16.08 | 15.11 | 14.47 | 15.96 | 15.12 | 14.54 | |||
| 2M J11085176-7632502 | 20.34 | 17.77 | 17.60 | 14.29 | 13.53 | 12.96 | 14.30 | 13.50 | 12.84 | ||
| 2M J11085527-7704502 | 11.61 | 9.18 | 7.94 | 7.47 | |||||||
| 2M J11085596-7727132 | 19.87 | 17.30 | 17.08 | 13.51 | 12.29 | 11.62 | |||||
| 2M J11085813-7646392 | 14.92 | 13.81 | 13.65 | 11.96 | 11.20 | 10.87 | |||||
| 2M J11090239-7645196 | 19.85 | 17.68 | 17.48 | 15.29 | 14.60 | 14.27 | |||||
| 2M J11090315-7725584 | 23.30 | 20.90 | 16.25 | 14.26 | 13.41 | ||||||
| 2M J11090332-7700495 | 12.17 | 9.92 | 8.86 | 8.47 | |||||||
| 2M J11090367-7707456 | 13.88 | 12.72 | 12.79 | 10.69 | 9.69 | 9.37 | |||||
| 2M J11090651-7711246 | 15.85 | 14.64 | 14.63 | 12.54 | 11.66 | 11.32 | |||||
| 2M J11090766-7618144 | 9.29 | 7.48 | 6.50 | 6.18 | |||||||
| Cha J11090998-7643570 | 22.91 | 20.55 | |||||||||
| 2M J11091379-7637531 | 13.81 | 12.69 | 12.65 | 10.88 | 10.00 | 9.69 | |||||
| 2M J11092068-7713591 | 14.58 | 13.12 | 13.04 | 10.38 | 9.10 | 8.60 | |||||
| 2M J11092482-7642073 | 15.37 | 13.93 | 13.85 | 11.35 | 10.09 | 9.63 | |||||
| 2M J11092582-7726243 | 16.77 | 14.82 | 14.85 | 11.35 | 9.83 | 9.25 | |||||
| 2M J11092913-7659180 | 15.70 | 13.27 | 12.51 | 12.12 | |||||||
| 2M J11093252-7646573 | 23.63 | 20.91 | 15.69 | 15.01 | |||||||
| 2M J11093543-7731390 | 22.39 | 19.88 | 21.15 | 19.66 | 15.94 | 15.02 | 14.41 | 15.92 | 14.99 | 14.37 | |
| 2M J11093719-7726357 | 18.01 | 16.10 | 16.07 | 12.70 | 11.22 | 10.65 | |||||
| 2M J11094525-7740332 | 17.71 | 15.43 | 15.24 | 12.36 | 11.45 | 11.03 | 12.36 | 11.46 | |||
| 2M J11094569-7640338 | 19.75 | 18.04 | 18.22 | 14.69 | 13.37 | 12.68 | 14.62 | 13.34 | 12.63 | ||
| 2M J11094970-7719578 | 20.52 | 18.36 | 14.29 | 12.53 | 11.82 | ||||||
| 2M J11095119-7658568 | 10.63 | 9.52 | 8.99 | 8.79 | |||||||
| 2M J11095146-7645452 | 16.44 | 14.59 | 14.46 | 11.34 | 9.95 | 9.36 | |||||
| 2M J11095269-7720397 | 19.61 | 17.71 | 17.70 | 13.80 | 12.38 | 11.60 | |||||
| 2M J11095590-7649022 | 23.04 | 20.19 | 15.52 | 13.51 | 12.55 | ||||||
| 2M J11095822-7659147 | 13.27 | 10.66 | 9.42 | 8.96 | |||||||
| 2M J11095934-7726320 | 17.50 | 15.53 | 15.55 | 12.03 | 10.53 | 9.89 | |||||
| Cha J11100159-7738052 | 24.58 | 22.95 | 18.68 | 17.47 | 16.69 | ||||||
| 2M J11100192-7725451 | 20.44 | 17.80 | 17.46 | 13.83 | 12.61 | 12.02 | |||||
| 2M J11100653-7643589 | 21.06 | 18.79 | 14.71 | 13.00 | 12.26 | ||||||
| 2M J11100658-7642486 | 23.27 | 20.67 | 16.34 | 15.86 | 15.07 | ||||||
| 2M J11100787-7656425 | 16.05 | 13.22 | 11.98 | 11.43 | |||||||
| 2M J11101153-7733521 | 16.33 | 14.34 | 14.24 | 12.18 | 11.19 | 10.78 | 11.96 | 10.76 | |||
| 2M J11101217-7647250 | 21.84 | 19.45 | 15.19 | 13.61 | 12.79 | ||||||
| 2M J11101233-7727099 | 17.57 | 15.70 | 15.70 | 12.41 | 11.05 | 10.44 | |||||
| Cha J11102251-7729595 | 19.10 | 17.03 | |||||||||
| 2M J11102375-7718212 | 19.39 | 17.67 | 17.65 | 14.55 | 13.40 | 12.76 | |||||
| 2M J11102633-7728394 | 17.51 | 15.89 | 15.97 | 13.38 | 12.37 | 11.88 | 13.30 | 12.32 | 11.75 | ||
| 2M J11102662-7723318 | 18.34 | 16.60 | 16.60 | 13.48 | 12.18 | 11.61 | |||||
| 2M J11102819-7626164 | 9.97 | 8.44 | 7.55 | 7.26 | |||||||
| 2M J11102990-7736064 | 14.92 | 13.72 | 13.72 | 11.65 | 10.68 | 10.30 | |||||
| 2M J11103031-7701230 | 14.54 | 12.34 | 11.52 | 11.12 | |||||||
| 2M J11103067-7637186 | 14.71 | 13.26 | 13.21 | 10.77 | 9.57 | 9.10 | |||||
| 2M J11103500-7651257 | 17.48 | 14.05 | 12.65 | 11.92 | |||||||
| 2M J11103607-7640412 | 17.51 | 15.79 | 15.71 | 12.46 | 10.88 | 10.20 | 12.45 | ||||
| 2M J11103749-7722083 | 22.53 | 20.01 | 16.06 | 14.62 | 13.85 | ||||||
| 2M J11104006-7630547 | 20.55 | 17.93 | 17.77 | 14.57 | 13.85 | 13.34 | 14.50 | 13.84 | 13.40 | ||
| Cha J11104328-7646280 | 22.75 | 20.32 | |||||||||
| 2M J11104343-7641132 | 17.58 | 16.02 | 15.88 | 13.04 | 11.79 | 11.19 | 13.11 | 11.85 | 11.18 | ||
| 2M J11105038-7631440 | 12.85 | 11.94 | 11.90 | 10.32 | 9.42 | 9.14 | |||||
| 2M J11105076-7718031 | 16.40 | 14.45 | 14.38 | 12.04 | 11.10 | 10.75 | |||||
| 2M J11105215-7709286 | 13.64 | 12.40 | 12.45 | 10.28 | 9.25 | 8.85 | |||||
| 2M J11105705-7713269 | 20.98 | 18.73 | 15.57 | 14.56 | 13.87 | ||||||
| 2M J11110383-7706261 | 14.98 | 13.73 | 13.89 | 11.62 | 10.53 | 10.19 | |||||
| 2M J11110476-7733471 | 22.60 | 20.17 | 16.84 | 15.76 | 15.06 | ||||||
| 2M J11110670-7717594 | 14.44 | 13.26 | 13.33 | 11.38 | 10.43 | 10.08 | |||||
| 2M J11110714-7722056 | 14.81 | 13.29 | 13.38 | 10.70 | 9.54 | 8.99 | |||||
| 2M J11110958-7651505 | 16.85 | 13.23 | 11.71 | 10.92 | |||||||
| 2M J11111069-7721118 | 15.75 | 14.42 | 14.55 | 12.29 | 11.30 | 10.88 | |||||
| 2M J11111062-7657205 | 12.69 | 10.32 | 9.12 | 8.66 | |||||||
| 2M J11111311-7732096 | 22.89 | 20.53 | 16.92 | 15.65 | 15.08 | ||||||
| Cha J11111725-7637008 | 22.96 | 20.34 | 17.16 | 16.52 | 16.03 | ||||||
| 2M J11113045-7712269 | 16.21 | 14.71 | 12.21 | 11.09 | 10.63 | ||||||
| Cha J11113052-7647467 | 23.26 | 20.90 | |||||||||
| 2M J11113409-7729331 | 19.99 | 17.71 | 15.46 | 14.63 | 14.04 | ||||||
| 2M J11113659-7647070 | 22.90 | 20.43 | 16.85 | 15.90 | 15.60 | ||||||
| 2M J11114388-7729437 | 22.77 | 20.10 | 16.96 | 15.44 | 14.96 | ||||||
| 2M J11120288-7722483 | 18.57 | 16.26 | 13.59 | 12.94 | 12.51 | ||||||
| 2M J11122250-7714512 | 22.22 | 19.57 | 15.90 | 14.93 | 14.43 | ||||||
| 2M J11131188-7647392 | 14.26 | 13.10 | 13.13 | 11.36 | 10.46 | 10.19 | |||||
| Cha J11131563-7647387 | 23.21 | 20.85 | |||||||||
| 2M J11132112-7625558 | 8.75 | 5.44 | 4.51 | 4.13 | |||||||
| Cha J11140393-7632135 | 22.10 | 19.77 | |||||||||
| 2M J11142906-7625399 | 14.46 | 12.57 | 11.90 | 11.61 | |||||||
| 2M J11152180-7724042 | 13.79 | 11.76 | 11.13 | 10.82 | |||||||
| 2M J11154549-7724487 | 14.72 | 12.93 | 12.39 | 12.04 | |||||||
| 2M J11155827-7729046 | 13.65 | 11.94 | 11.31 | 11.02 | |||||||
| 2M J11173079-7627078 | 8.62 | 5.56 | 4.51 | 4.24 | |||||||
| 2M J11173792-7646193 | 15.85 | 13.51 | 12.95 | 12.62 | |||||||
| 2M J11175211-7629392 | 13.39 | 11.66 | 11.15 | 10.71 | |||||||
| 2M J11183379-7643041 | 13.24 | 11.34 | 10.78 | 10.42 | |||||||
| 2M J11183572-7935548 | 12.20 | 10.49 | 9.89 | 9.62 | |||||||
| 2M J11194214-7623326 | 14.73 | 12.72 | 12.03 | 11.72 | |||||||
| 2M J11195060-7628492 | 10.15 | 7.52 | 6.54 | 5.94 | |||||||
| 2M J11195652-7504529 | 16.68 | 14.05 | 13.33 | 12.98 | |||||||
| 2M J11213026-7805240 | 12.08 | 9.28 | 8.28 | 7.85 | |||||||
| 2M J11225703-7649560 | 8.68 | 6.20 | 5.37 | 5.09 | |||||||
| 2M J11241186-7630425 | 14.87 | 12.88 | 12.30 | 12.00 | |||||||
| 2M J11242980-7554237 | 12.91 | 10.93 | 10.20 | 9.88 | |||||||
| 2M J11253653-7700348 | 9.59 | 6.41 | 5.54 | 5.08 | |||||||
| 2M J11271677-7816401 | 13.41 | 11.69 | 11.14 | 10.86 | |||||||
| 2M J11332327-7622092 | 12.26 | 10.59 | 10.00 | 9.71 | |||||||
| 2M J11334926-7618399 | 14.07 | 12.15 | 11.50 | 11.18 | |||||||
| 2M J11335700-7807240 | 15.92 | 13.20 | 12.58 | 12.19 | |||||||
| 2M J11344431-7937063 | 15.68 | 13.54 | 12.98 | 12.61 | |||||||
| 2M J11404967-7459394 | 14.83 | 12.68 | 12.15 | 11.77 | |||||||
| 2M J11432669-7804454 | 13.61 | 11.62 | 10.97 | 10.60 | |||||||
| 2M J11453083-7610479 | 14.60 | 12.90 | 12.33 | 12.00 | |||||||
| 2M J11455537-7624419 | 15.89 | 13.77 | 13.24 | 12.89 |
| Night | Date | Telescope + Instrument | Disperser | (m) | |
|---|---|---|---|---|---|
| 1 | 2004 Jan 2 | Magellan II + MIKE | 0.5-1 | 20000 | |
| 2 | 2004 Jan 7 | Magellan I + IMACS | 200 grism | 0.5-1 | 900 |
| 3 | 2004 Jan 8 | Magellan I + IMACS | 200 grism | 0.5-1 | 900 |
| 4 | 2004 Jan 9 | Magellan I + IMACS | 200 grism | 0.5-1 | 900 |
| 5 | 2004 Jan 10 | Magellan I + IMACS | 200 grism | 0.5-1 | 900 |
| 6 | 2004 Jan 11 | Magellan I + IMACS | 200 grism | 0.5-1 | 900 |
| 7 | 2004 Mar 31 | Magellan II + LDSS-2 | med red grism | 0.48-0.92 | 600 |
| 8 | 2004 Apr 26 | Magellan I + IMACS | 200 grism | 0.5-1 | 900 |
| 9 | 2004 Apr 27 | Magellan I + IMACS | 200 grism | 0.5-1 | 900 |
| 10 | 2005 Jan 2 | Magellan I + IMACS | 200 grism | 0.5-1 | 1500 |
| 11 | 2005 Jan 3 | Magellan I + IMACS | 200 grism | 0.5-1 | 900 |
| 12 | 2005 Jan 4 | Magellan I + IMACS | 200 grism | 0.5-1 | 900 |
| 13 | 2005 Jan 5 | Magellan I + IMACS | 200 grism | 0.5-1 | 900 |
| 14 | 2005 Jan 6 | Magellan I + IMACS | 200 grism | 0.5-1 | 900 |
| 15 | 2005 Mar 23 | Gemini + GNIRS | 31.7 cross-dispersed | 1-2.5 | 2000 |
| 16 | 2005 Mar 24 | Gemini + GNIRS | 31.7 cross-dispersed | 1-2.5 | 2000 |
| 17 | 2005 Mar 25 | Gemini + GNIRS | 31.7 cross-dispersed | 1-2.5 | 2000 |
| Spectral | Membership | Basis of | |||
|---|---|---|---|---|---|
| 2MASSaa2MASS Point Source Catalog. | NamebbSources that are not in the 2MASS Point Source Catalog have been assigned coordinate-based identifications. | TypeccUncertainties are subclass unless noted otherwise. | EvidenceddMembership in Chamaeleon I is indicated by and a position above the main sequence for the distance of Chamaeleon I (“”), strong emission lines (“e”), Na I and K I strengths intermediate between those of dwarfs and giants (“NaK”), IR excess emission (“ex”), or the shape of the gravity-sensitive steam bands (“H2O”). | SelectioneeSources were selected for spectroscopy because they appeared as candidate members in Figure 2 (“IK1”), Figure 3 (“IK2”), Figure 4 (“RI”), or Figure 5 (“IZ”) or were identified as candidate members by López Martí et al. (2004) (“LES2004”). | Night |
| J10523694-7440287 | M4.75 | NaK | IK2 | 7 | |
| J10561638-7630530 | ESO H 553 | M5.6 | NaK,e | IK1 | 4 |
| J10580597-7711501 | M5.25 | NaK | IK1 | 4 | |
| J11011370-7722387 | M5.25 | NaK | IK1 | 7 | |
| J11021927-7536576 | M4.5 | NaK | IK2 | 7 | |
| J11022610-7502407 | M4.75 | NaK | IK2 | 7 | |
| J11024183-7724245 | [LES2004] 423 | M5 | NaK, | IK1 | 7 |
| J11050752-7812063 | M4.75 | NaK | IK1 | 7 | |
| J11052272-7709290 | M4.75 | NaK, | IK1 | 3 | |
| J11052472-7626209 | M2.75 | NaK | IK1 | 5 | |
| J11060010-7507252 | M4.5 | NaK | IK2 | 7 | |
| J11065939-7530559 | M5.25 | e,NaK | IK2 | 7 | |
| J11070324-7610565 | M6 | NaK | IK1 | 5 | |
| J11072022-7738111ffPossible wide companion to T26 (Reipurth & Zinnecker, 1993; Ghez et al., 1997). | M4.25 | NaK, | RI | 14 | |
| J11072040-7729403 | [LES2004] 448,ISO 99 | M4.5 | NaK | IK1 | 2 |
| J11072443-7743489 | [LES2004] 429 | M5.75 | NaK, | IK1 | 2 |
| Cha J11072647-7742408 | M9 | H2O | IZ | 15,17 | |
| J11073840-7552519 | M4.75 | NaK | IK2 | 7 | |
| J11080234-7640343 | [LES2004] 717 | M6 | NaK | IK1 | 2 |
| J11080609-7739406 | M9 | H2O | IZ | 15 | |
| Cha J11081938-7731522 | M4.75 | NaK,ex | RI | 8 | |
| J11082570-7716396 | M8 | NaK,ex | RI | 8 | |
| Cha J11083040-7731387 | M9 | H2O | IZ | 15,17 | |
| J11084952-7638443 | M8.75 | e,NaK,ex | RI | 9,11,12 | |
| J11085176-7632502 | [LES2004] 737 | M7.25 | NaK, | IK1 | 5,11,12 |
| J11085596-7727132 | ISO 167 | M5.25 | NaK, | IK1 | 2 |
| J11092913-7659180 | [LES2004] 602 | M5.25 | NaK, | IK1 | 2 |
| J11093543-7731390 | M8.25 | NaK | RI | 8 | |
| J11100192-7725451 | [LES2004] 419 | M5.25 | NaK, | IK1 | 2 |
| J11100658-7642486 | M9.25 | NaK | RI | 9,11,12 | |
| J11101153-7733521 | M4.5 | NaK, | IK1 | 2 | |
| J11104006-7630547 | M7.25 | NaK, | IK1 | 5 | |
| J11112249-7745427 | [LES2004] 436 | M8.25 | NaK,ex | LES2004 | 2 |
| J11114533-7636505 | [LES2004] 743 | M8 | NaK,ex | LES2004 | 2,11,12 |
| J11120288-7722483 | M6 | ,NaK | RI | 9 | |
| J11122250-7714512 | M9.25 | NaK | RI | 9,11,12,13 | |
| J11123099-7653342 | [LES2004] 601 | M7 | NaK | LES2004 | 2 |
| J11155827-7729046 | M4.5 | NaK | IK1 | 7 | |
| J11173792-7646193 | M5.75 | NaK | IK1 | 4,5 | |
| J11175211-7629392 | M4.5 | NaK | IK1 | 7 | |
| J11183379-7643041 | M5 | NaK | IK1 | 7 | |
| J11183572-7935548 | M4.75 | e,NaK | IK2 | 7 | |
| J11194214-7623326 | M5 | NaK | IK1 | 7,8 | |
| J11195652-7504529 | M7.25 | NaK | IK2 | 7 | |
| J11241186-7630425 | M5 | NaK, | IK1 | 8 | |
| J11242980-7554237 | M4.75 | NaK | IK2 | 7 | |
| J11332327-7622092 | M4.5 | NaK | IK2 | 7 | |
| J11334926-7618399 | M4.5 | NaK | IK2 | 7 | |
| J11404967-7459394 | M5.75 | NaK | IK2 | 7 | |
| J11432669-7804454 | M5 | e,NaK | IK2 | 7 |
| Spectral | Basis of | |||
|---|---|---|---|---|
| 2MASSaa2MASS Point Source Catalog. | NamebbSources that are not in the 2MASS Point Source Catalog have been assigned coordinate-based identifications. | TypeccUncertainties are subclass unless noted otherwise. | SelectionddSources were selected for spectroscopy because their previous classifications were uncertain (“unc”), they were previously identified candidate companions (“comp”), they were candidate members based on Figure 2 (“IK1”), Figure 3 (“IK2”), Figure 4 (“RI”), Figure 5 (“IZ”), 2MASS photometry (“2M”), Spitzer photometry (“IRAC”), or X-ray emission (“X-ray”), or they were identified as candidate members by López Martí et al. (2004) (“LES2004”). | Night |
| J10314767-7917180 | M5.25V | IK2 | 7 | |
| J10435748-7633023 | M4.75VeeSpectral features suggest a surface gravity intermediate between those of Chamaeleon I members and field dwarfs. | IK2 | 7 | |
| J10452780-7715335 | M6III | IK1 | 9 | |
| J10555824-7418347 | M7.5VeeSpectral features suggest a surface gravity intermediate between those of Chamaeleon I members and field dwarfs. | IK2 | 7 | |
| J10593228-7753268 | M4.75V | IK1 | 7 | |
| J11001473-7757103 | K0 | IK1 | 7 | |
| J11014949-7412268 | giant | IK2 | 7 | |
| J11035902-7743349 | ISO 35 | K0 | RI | 14 |
| J11045890-7656550 | giant | IK1 | 4 | |
| J11050005-7728211 | M0 | RI | 8 | |
| J11050666-7739444 | ISO 57 | M0 | IK1 | 1 |
| J11050937-7706578 | giant | IK1 | 3 | |
| Cha J11051041-7728228 | galaxy | RI | 8 | |
| J11051264-7739070 | ISO 58 | giant | IK1 | 2 |
| J11051263-7742151 | M0 | 2M | 2 | |
| J11051798-7706565 | giant | RI | 14 | |
| J11052114-7731541 | M0 | RI | 8 | |
| J11052489-7620373 | giant | IK1 | 5 | |
| J11052850-7639489 | giant | IK1 | 4 | |
| J11053587-7638034 | giant | IK1 | 4 | |
| J11053731-7738539 | K0V | IZ | 16 | |
| J11054296-7745213 | ISO 64 | giant | IK1 | 2 |
| J11054361-7731525 | M0 | RI | 8 | |
| J11054371-7729113 | M3V | RI | 8 | |
| J11054577-7730074 | M0 | RI | 8 | |
| Cha J11054699-7737247 | M0 | IZ | 16 | |
| J11054972-7640462 | giant | IK1 | 4 | |
| Cha J11055024-7739268 | M0 | IZ | 16 | |
| J11055096-7719524 | ISO 67 | giant | IK1 | 3 |
| Cha J11055362-7638533 | M0 | IRAC | 10 | |
| J11055683-7656438 | giant | IK1 | 4 | |
| J11060466-7710063 | M3.25V | RI | 14 | |
| J11060633-7743443 | ISO 73 | M0 | IK1 | 2 |
| J11061896-7729256 | M0 | RI | 8 | |
| Cha J11062045-7743281 | M0 | IZ | 16 | |
| Cha J11063259-7746281 | M5-M7V? | IZ | 15 | |
| J11063479-7645404 | giant | IK1 | 2 | |
| Cha J11063721-7740259 | M0 | IZ | 17 | |
| J11063841-7612032 | giant | IK1 | 5 | |
| Cha J11064199-7738330 | M0 | IZ | 15 | |
| Cha J11064218-7736510 | M0 | IZ | 16 | |
| J11064235-7632450 | giant | IK1 | 5 | |
| J11064274-7636124 | giant | IK1 | 5 | |
| J11064586-7625317 | giant | IK1 | 5 | |
| J11065986-7651181 | giant | IK1 | 7 | |
| J11070350-7631443 | giantffClassified as a background giant by Brandner & Zinnecker (1997). | IK1 | 5 | |
| J11070380-7635440 | giant | IK1 | 4 | |
| J11070483-7652432 | M0 | 2M | 2 | |
| J11072446-7742265 | giant | IK1 | 2 | |
| J11073280-7748594 | ISO 104 | giant | IK1 | 2 |
| J11073677-7735167 | Cam2-26,ISO 107 | giant | IK1 | 2 |
| J11073737-7733093 | Cam2-27,ISO 109 | giant | IK1 | 2 |
| J11074521-7738049 | ISO 113 | giant | IK1 | 2 |
| J11074763-7711156 | giant | IK1 | 3 | |
| J11075431-7724571 | M3V | RI | 8 | |
| J11075613-7421065 | M5.75V | IK2 | 7 | |
| J11075699-7741558 | ISO 118 | giant | IK1 | 2 |
| J11080282-7748375 | ISO 125 | giant | IK1 | 2 |
| J11081069-7637424 | giant | IK1 | 2,5 | |
| J11081204-7622124 | galaxy | IRAC | 14 | |
| J11081241-7719123 | Cam2-34,[LES2004] 420,ISO 131 | carbonggClassified as an M-type member of Chamaeleon I by Gómez & Mardones (2003). | RI | 8 |
| Cha J11081578-7640198 | M0V | RI | 9 | |
| J11081916-7656525 | ISO 139 | giant | IK1 | 2 |
| J11082492-7721579 | ISO 146 | M0 | RI | 8 |
| Cha J11082692-7634482 | M2-M4V | RI | 9 | |
| J11083016-7728480 | M0 | RI | 8 | |
| J11083897-7614457 | giant | IK1 | 5 | |
| J11084845-7718233 | ISO 155 | giant | IK1 | 3 |
| J11085135-7638262 | K5-K6 | X-ray | 5 | |
| J11085527-7704502 | ISO 166 | giant | IK1 | 3 |
| J11085651-7645154 | giant | IRAC | 11,12 | |
| J11085759-7645151 | K0 | 2M | 2 | |
| J11085813-7646392 | ISO 170 | giant | IK1 | 2 |
| J11090239-7645196 | M4.5V | RI | 9 | |
| J11090315-7725584 | M0 | RI | 8 | |
| J11090332-7700495 | ISO 172 | giant | IK1 | 2,3 |
| J11090367-7707456 | ISO 175 | giant | IK1 | 3 |
| J11090651-7711246 | ISO 176 | giant | IK1 | 3 |
| J11090766-7618144 | giant | IK1 | 4 | |
| Cha J11090998-7643570 | M1-M3V | RI | 9 | |
| J11091011-7627113 | mid-K | X-ray | 5 | |
| J11091058-7632508 | Cam2-36 | M0ggClassified as an M-type member of Chamaeleon I by Gómez & Mardones (2003). | unc | 5 |
| J11091336-7630232 | M0 | X-ray | 5 | |
| J11091379-7637531 | ISO 183 | giant | IK1 | 2,5 |
| J11092068-7713591 | ISO 188 | giant | IK1 | 3 |
| J11092482-7642073 | ISO 191 | giant | IK1 | 7 |
| J11092582-7726243 | ISO 190 | giant | IK1 | 2,3 |
| J11092956-7702052 | M0 | 2M | 3 | |
| J11093252-7646573 | M4V | RI | 9 | |
| J11093719-7726357 | ISO 195 | giant | IK1 | 3 |
| J11094569-7640338 | giant | IK1 | 2 | |
| KG102B | giant | comp | 13 | |
| J11094970-7719578 | ISO 210 | M0 | RI | 8,9 |
| J11095119-7658568 | ISO 213 | giant | IK1 | 4 |
| J11095146-7645452 | [LES2004] 721,ISO 214 | giant | IK1 | 2 |
| J11095269-7720397 | ISO 219 | K0 | IK1 | 3 |
| J11095300-7730588 | SGR1 | M0 | unc | 11,12 |
| J11095465-7625333 | giant | X-ray | 5 | |
| J11095590-7649022 | M0 | RI | 9 | |
| J11095822-7659147 | [LES2004] 616,ISO 229 | giant | IK1 | 2 |
| J11095934-7726320 | ISO 230 | giant | IK1 | 2,3 |
| Cha J11100159-7738052 | M9-L1V? | IZ | 15 | |
| J11100653-7643589 | giant | RI | 9 | |
| J11100787-7656425 | ISO 236 | giant | IK1 | 2 |
| J11101217-7647250 | M0 | RI | 11,12 | |
| J11101233-7727099 | ISO 239 | giant | IK1 | 2 |
| Cha J11102251-7729595 | K0 | RI | 8 | |
| J11102375-7718212 | giant | IK1 | 7,11,12 | |
| J11102633-7728394 | K0 | IK1 | 2 | |
| J11102662-7723318 | giant | IK1 | 2,3 | |
| J11102819-7626164 | ISO 242 | giant | IK1 | 4 |
| J11102990-7736064 | ISO 243 | giant | IK1 | 7 |
| J11103031-7701230 | giant | IK1 | 2 | |
| J11103067-7637186 | ISO 245 | giant | IK1 | 2 |
| J11103500-7651257 | K0 | IK1 | 2 | |
| J11103607-7640412 | ISO 249 | giant | IK1 | 2 |
| ISO 250 candidate companion | M2-M4 | comp | 6 | |
| J11103749-7722083 | M0 | RI | 11,12 | |
| J11104082-7740525 | giant | 2M | 2 | |
| J11104290-7634048 | OTS61 | M0 | unc | 2,5 |
| Cha J11104328-7646280 | M3.5V | RI | 9 | |
| J11104343-7641132 | ISO 253 | giant | IK1 | 2 |
| J11104343-7702221 | M0 | 2M | 2 | |
| J11105038-7631440 | ISO 255 | giant | IK1 | 5 |
| J11105185-7642259 | M0 | IRAC | 11,12 | |
| J11105215-7709286 | ISO 257 | giant | IK1 | 3 |
| J11105353-7726389 | giant | IRAC | 11,12 | |
| J11105705-7713269 | M4V | RI | 9 | |
| J11110383-7706261 | ISO 263 | giant | IK1 | 4 |
| J11110476-7733471 | M3V | RI | 8 | |
| J11110670-7717594 | ISO 264 | giant | IK1 | 3 |
| J11110714-7722056 | ISO 265 | giant | IK1 | 3 |
| J11110958-7651505 | ISO 266 | giant | IK1 | 7 |
| J11111069-7721118 | ISO 268 | giant | IK1 | 3 |
| J11111062-7657205 | ISO 267 | giant | IK1 | 2 |
| J11111311-7732096 | M3V | RI | 8 | |
| J11111680-7628573 | K0 | X-ray | 5 | |
| Cha J11111725-7637008 | M8V | RI | 9 | |
| J11111985-7638264 | M3-M4 | X-ray | 2 | |
| Cha J11112420-7637434 | M0 | IRAC | 11,12 | |
| J11113045-7712269 | ISO 276 | giant | RI | 14 |
| Cha J11113052-7647467 | M3 | RI | 9 | |
| J11113409-7729331 | M5.5V | RI | 11,12,13 | |
| J11113659-7647070 | M3.5V | RI | 9 | |
| J11114388-7729437 | M2V | RI | 8 | |
| Cha J11114773-7642167 | galaxy | IRAC | 11,12 | |
| J11115884-7730376 | [LES2004] 401 | M4 | LES2004 | 2 |
| Cha J11130714-7638575 | M0 | IRAC | 11,12 | |
| J11131188-7647392 | giant | IK1 | 2 | |
| Cha J11131563-7647387 | mid-M? | RI | 9 | |
| J11132112-7625558 | M6III | IK1 | 14 | |
| Cha J11140393-7632135 | M5.5V | RI | 11,12 | |
| J11154549-7724487 | ESO H 573 | M4.75VhhClassified as M5.5V by Comerón et al. (2004). | IK1 | 7 |
| J11173079-7627078 | M3III | IK1 | 9 | |
| J11195060-7628492 | M8.5III | IK1 | 9 | |
| J11213026-7805240 | M6III | IK1 | 9 | |
| J11225703-7649560 | K5III | IK1 | 9 | |
| J11253653-7700348 | M | IK1 | 9 | |
| J11271677-7816401 | M4.75V | IK2 | 7 | |
| J11335700-7807240 | M8V | IK2 | 7 | |
| J11344431-7937063 | M5.75V | IK2 | 7 | |
| J11453083-7610479 | M4.25V | IK2 | 7 | |
| J11455537-7624419 | M5V | IK2 | 7 |
| Spectral | Membership | ||||
|---|---|---|---|---|---|
| 2MASSaa2MASS Point Source Catalog. | Name | TypebbUncertainties for classifications from this work are subclass unless noted otherwise. | Ref | EvidenceccMembership in Chamaeleon I is indicated by and a position above the main sequence for the distance of Chamaeleon I (“”), strong emission lines (“e”), Na I and K I strengths intermediate between those of dwarfs and giants (“NaK”), IR excess emission (“ex”), the shape of the gravity-sensitive steam bands (“H2O”), strong Li absorption (“Li”), or a radial velocity that is similar to that of the known members of Chamaeleon I (“rv”). | Night |
| J10550964-7730540 | ESO H 552 | M5,M4.5 | 1,2 | NaK | 10 |
| J10555973-7724399 | T3A | M1,M0.5,M0.5,K8-M0.5 | 3,4,5,2 | e,ex,rv, | 4 |
| T3B | M3.5 | 2 | NaK | 4 | |
| J11013205-7718249ddSelected for spectroscopy because it appeared as a candidate member in Figure 2. | ESO H 554 | M8.5,M8 | 1,2 | NaK | 5 |
| J11062554-7633418ddSelected for spectroscopy because it appeared as a candidate member in Figure 2. | ESO H 559 | M6,M5.25 | 1,2 | NaK,e,,ex | 5 |
| J11065906-7718535 | T23 | M1.5,M4.25 | 6,2 | e,ex,NaK | 4 |
| J11070925-7718471 | ISO 91 | M2.5,M2-M4 | 7,2 | ex | 3 |
| J11072825-7652118 | T27 | K0:,M1,M1.5,M1.5+M3,M3 | 3,4,5,8,2 | e,ex,rv,Li | 4 |
| J11073832-7747168ddSelected for spectroscopy because it appeared as a candidate member in Figure 2. | ESO H 560 | M5,M4.5 | 1,2 | NaK, | 2 |
| J11074366-7739411 | T28 | M0.5,M0.5,M1,M0 | 4,6,9,2 | e,ex, | 2 |
| J11075792-7738449 | T29 | K7,K4-K6 | 9,2 | e,ex, | 2 |
| J11075809-7742413 | T30 | M2.5,M2.5 | 9,2 | e,Li,rv,,ex | 2 |
| J11075993-7715317ddSelected for spectroscopy because it appeared as a candidate member in Figure 2. | ESO H 561 | M6.5,M5.75 | 1,2 | NaK, | 3 |
| J11084069-7636078 | CHXR 33 | M0,M0,M2.5 | 10,11,2 | Li, | 2,5 |
| T39BeeSeparation of and position angle of relative to T39A. | M3 | 2 | Li | 13 | |
| J11091769-7627578 | CHXR 37 | K7 | 12,13,2 | Li,rv, | 5 |
| J11092379-7623207 | T40 | K6 | 5,2 | e,ex,Li,rv, | 5 |
| J11094192-7634584 | C1-25 | M0 | 2 | ex | 2 |
| J11094525-7740332ddSelected for spectroscopy because it appeared as a candidate member in Figure 2. | ESO H 566 | M6.5,M5.75 | 1,2 | NaK, | 2 |
| J11094918-7731197 | KG 102 | M6,M5.5,M5.5 | 14,15,2 | e,NaK | 2,13 |
| J11095505-7632409 | C1-2 | M0 | 2 | ex,e | 5 |
| J11095873-7737088 | T45 | K0:,K7-M0,K7-M0,M1.25 | 3,4,5,2 | e,ex | 2 |
| J11100469-7635452 | T45a | M0,M1 | 5,2 | e,ex | 2 |
| J11100704-7629376 | T46 | K2:,K7,M0,M0 | 3,4,5,2 | e,ex,rv, | 5 |
| J11100934-7632178 | OTS 44 | M9.5,M9.5 | 16,2 | H2O,ex,NaK | 13 |
| J11105076-7718031ddSelected for spectroscopy because it appeared as a candidate member in Figure 2. | ESO H 568 | M4.5,M4.25 | 1,2 | NaK, | 7 |
| J11105333-7634319 | T48 | M1,M1:,M3.75 | 4,5,2 | e,ex | 2,5 |
| J11111083-7641574 | ESO H 569 | K7:,M2.5 | 1,2 | e,,ex | 11,12 |
| J11115400-7619311 | CHXR 49NE | M1,K7-M0,M2.5 | 17,11,2 | Li | 4 |
| J11142906-7625399ddSelected for spectroscopy because it appeared as a candidate member in Figure 2. | ESO H 571 | M5.5,M4.75 | 1,2 | NaK | 7 |
| J11152180-7724042ddSelected for spectroscopy because it appeared as a candidate member in Figure 2. | ESO H 572 | M5.5,M4.75 | 1,2 | NaK | 7 |
| J11160287-7624533 | ESO H 574 | K:,K7-M0 | 1,2 | e | 10 |
References. — (1) Comerón et al. (2004); (2) this work; (3) Appenzeller (1979); (4) Rydgren (1980); (5) Appenzeller et al. (1983); (6) Gauvin & Strom (1992); (7) Gómez & Mardones (2003); (8) Brandner & Zinnecker (1997); (9) Comerón et al. (1999); (10) Feigelson & Kriss (1989); (11) Huenemoerder et al. (1994); (12) Alcalá et al. (1995); (13) Covino et al. (1997); (14) Saffe et al. (2003); (15) Luhman (2004a); (16) Luhman et al. (2004); (17) Hartigan (1993).
| Adopted | bbTemperature scale from Luhman et al. (2003b). | |||||
|---|---|---|---|---|---|---|
| 2MASSaa2MASS Point Source Catalog. | Name | Spectral Type | (K) | () | IMFccIndicates whether each object is included in the IMFs in Figure 15 for the (“1”) and (“2”) fields in Figure 1. | |
| J10463795-7736035 | HD 93828 | F0 | 7200 | 0.00 | 8.9 | |
| J10523694-7440287 | M4.75 | 3161 | 0.18 | 0.10 | ||
| J10550964-7730540 | ESO H 552 | M4.5 | 3198 | 0.34 | 0.083 | |
| T3B | M3.5 | 3342 | 0.00 | 0.040 | ||
| J10555973-7724399 | T3A | M0 | 3850 | 0.79 | 0.42 | |
| J10561638-7630530 | ESO H 553 | M5.6 | 3044 | 0.00 | 0.031 | |
| J10563044-7711393 | T4 | M0.5 | 3778 | 0.23 | 0.57 | |
| J10574219-7659356 | T5 | M3.25 | 3379 | 0.34 | 0.33 | |
| J10580597-7711501 | M5.25 | 3091 | 0.45 | 0.022 | ||
| J10581677-7717170 | T6 | K0 | 5250 | 0.42 | 1.9 | |
| J10590108-7722407 | T7 | K8 | 3955 | 0.34 | 0.57 | |
| J10590699-7701404 | T8 | K2 | 4900 | 0.00 | 2.4 | |
| J11004022-7619280 | T10 | M3.75 | 3306 | 0.20 | 0.077 | |
| J11011370-7722387 | M5.25 | 3091 | 0.27 | 0.025 | ||
| J11011875-7627025 | CHXR 9C | M2.25 | 3524 | 0.45 | 0.56 | |
| J11011926-7732383 | M7.25 | 2838 | 0.45 | 0.021 | ||
| Cha J11011944-7732374 | M8.25 | 2632 | 0.00 | 0.0065 | ||
| J11013205-7718249 | ESO H 554 | M8 | 2710 | 0.00 | 0.0046 | |
| J11021927-7536576 | M4.5 | 3198 | 0.27 | 0.062 | ||
| J11022491-7733357 | T11 | K6 | 4205 | 0.07 | 1.2 | |
| J11022610-7502407 | M4.75 | 3161 | 0.14 | 0.075 | ||
| J11023265-7729129 | CHXR 71 | M3 | 3415 | 0.47 | 0.17 | |
| J11024183-7724245 | [LES2004] 423 | M5 | 3125 | 0.72 | 0.049 | |
| J11025504-7721508 | T12 | M4.5 | 3198 | 0.00 | 0.081 | |
| J11034186-7726520 | ISO 28 | M5.5 | 3058 | 0.61 | 0.036 | |
| J11034764-7719563 | Hn 2 | M5 | 3125 | 0.68 | 0.18 | |
| J11035682-7721329 | CHXR 12 | M3.5 | 3342 | 0.20 | 0.21 | |
| J11040425-7639328 | CHSM 1715 | M4.25 | 3234 | 0.74 | 0.045 | |
| J11040909-7627193 | T14 | K5 | 4350 | 0.45 | 0.95 | |
| J11041060-7612490 | CHSM 1982 | M6 | 2990 | 0.11 | 0.019 | |
| J11042275-7718080 | T14A | K7 | 4060 | 0.45 | 0.013 | |
| J11044258-7741571 | ISO 52 | M4 | 3270 | 0.36 | 0.093 | |
| J11045100-7625240 | CHXR 14N | K8 | 3955 | 0.23 | 0.35 | |
| J11045285-7625514 | CHXR 14S | M1.75 | 3596 | 0.23 | 0.26 | |
| J11045701-7715569 | T16 | M3 | 3415 | 1.60 | 0.21 | |
| J11050752-7812063 | M4.75 | 3161 | 0.18 | 0.077 | ||
| J11051467-7711290 | Hn 4 | M3.25 | 3379 | 0.79 | 0.31 | 1 |
| J11052272-7709290 | M4.75 | 3161 | 0.54 | 0.035 | 1 | |
| J11052472-7626209 | M2.75 | 3451 | 0.23 | 0.12 | 1 | |
| J11054300-7726517 | CHXR 15 | M5.25 | 3091 | 0.11 | 0.11 | 1 |
| J11055261-7618255 | T20 | M1.5 | 3632 | 0.11 | 0.35 | 1 |
| J11055780-7607488 | HD 96675 | B6.5 | 13500 | 0.02 | 98 | |
| J11060010-7507252 | M4.5 | 3198 | 0.18 | 0.047 | ||
| J11061540-7721567 | T21 | G5 | 5770 | 0.92 | 16 | 1 |
| J11061545-7737501 | Cam 2-19 | M2.75 | 3451 | 2.82 | 0.44 | |
| J11062554-7633418 | ESO H 559 | M5.25 | 3091 | 1.01 | 0.052 | 1 |
| CHXR 73B | M9 | 2400 | 2.12 | 0.0017 | ||
| J11062877-7737331 | CHXR 73A | M3.25 | 3379 | 1.85 | 0.17 | |
| J11063276-7625210 | CHSM 7869 | M6 | 2990 | 0.45 | 0.0098 | 1 |
| J11063799-7743090 | Cha H 12 | M6.5 | 2935 | 0.18 | 0.024 | 1,2 |
| J11063945-7736052 | ISO 79 | M5.25 | 3091 | 0.77 | 0.0074 | 1,2 |
| J11064180-7635489 | Hn 5 | M4.5 | 3198 | 0.32 | 0.11 | 1 |
| J11064346-7726343 | T22 | M3 | 3415 | 0.99 | 0.42 | 1 |
| J11064510-7727023 | CHXR 20 | K6 | 4205 | 1.08 | 1.1 | 1 |
| J11065733-7742106 | CHXR 74 | M4.25 | 3234 | 0.54 | 0.15 | 1,2 |
| J11065906-7718535 | T23 | M4.25 | 3234 | 0.00 | 0.11 | 1 |
| J11065939-7530559 | M5.25 | 3091 | 0.18 | 0.012 | ||
| J11070324-7610565 | M6 | 2990 | 0.11 | 0.010 | ||
| ESO H 281 | M4.5 | 3198 | 1.05 | 0.057 | 1 | |
| J11070925-7718471 | ISO 91 | M3 | 3415 | 4.51 | 0.25 | |
| J11071148-7746394 | CHXR 21 | M3 | 3415 | 1.04 | 0.34 | 1 |
| J11071181-7625501 | CHSM 9484 | M5.25 | 3091 | 0.50 | 0.018 | 1 |
| J11071206-7632232 | T24 | M0.5 | 3778 | 0.63 | 0.36 | 1 |
| J11071330-7743498 | CHXR 22E | M3.5 | 3342 | 1.35 | 0.22 | 2 |
| J11071668-7735532 | Cha H 1 | M7.75 | 2752 | 0.00 | 0.015 | 1,2 |
| J11071860-7732516 | Cha H 9 | M5.5 | 3058 | 1.62 | 0.046 | |
| J11071915-7603048 | T25 | M2.5 | 3488 | 0.45 | 0.24 | |
| J11072022-7738111 | M4.25 | 3234 | 0.68 | 0.16 | 1,2 | |
| J11072040-7729403 | ISO 99 | M4.5 | 3198 | 0.00 | 0.12 | 1 |
| J11072074-7738073 | T26 | G2 | 5860 | 0.75 | 12 | 1,2 |
| J11072443-7743489 | [LES2004] 429 | M5.75 | 3024 | 1.08 | 0.036 | 1,2 |
| Cha J11072647-7742408 | M9 | 2400 | 0.28 | 0.00043 | 1,2 | |
| J11072825-7652118 | T27 | M3 | 3415 | 0.14 | 0.22 | 1 |
| J11073519-7734493 | CHXR 76 | M4.25 | 3234 | 0.68 | 0.091 | 1 |
| J11073686-7733335 | CHXR 26 | M3.5 | 3342 | 2.26 | 0.66 | |
| J11073775-7735308 | Cha H 7 | M7.75 | 2752 | 0.23 | 0.014 | 1,2 |
| J11073832-7747168 | ESO H 560 | M4.5 | 3198 | 0.63 | 0.078 | 1 |
| J11073840-7552519 | M4.75 | 3161 | 0.27 | 0.034 | ||
| J11074245-7733593 | Cha H 2 | M5.25 | 3091 | 1.06 | 0.11 | 1,2 |
| J11074366-7739411 | T28 | M0 | 3850 | 1.35 | 1.4 | 2 |
| J11074610-7740089 | Cha H 8 | M5.75 | 3024 | 0.45 | 0.037 | 1,2 |
| J11074656-7615174 | CHSM 10862 | M5.75 | 3024 | 0.45 | 0.013 | |
| J11075225-7736569 | Cha H 3 | M5.5 | 3058 | 0.63 | 0.070 | 1,2 |
| J11075588-7727257 | CHXR 28 | K6 | 4205 | 1.54 | 4.0 | |
| J11075730-7717262 | CHXR 30B | M1.25 | 3669 | 3.16 | 0.22 | |
| J11075792-7738449 | T29 | K6 | 4205 | 1.24 | 2.4 | 2 |
| J11075809-7742413 | T30 | M2.5 | 3488 | 1.26 | 0.15 | 2 |
| J11075993-7715317 | ESO H 561 | M5.75 | 3024 | 0.68 | 0.058 | 1 |
| J11080002-7717304 | CHXR 30A | K8 | 3955 | 2.98 | 1.4 | |
| J11080148-7742288 | T31 | K8 | 3955 | 0.72 | 3.0 | 1,2 |
| J11080234-7640343 | [LES2004] 717 | M6 | 2990 | 0.11 | 0.023 | 1 |
| J11080297-7738425 | ISO 126 | M1.25 | 3669 | 1.35 | 0.33 | 2 |
| J11080329-7739174 | T32 | B9.5 | 10010 | 0.72 | 70 | 1,2 |
| J11080609-7739406 | M9 | 2400 | 0.00 | 0.00059 | 1,2 | |
| T33B | K6 | 4205 | 0.52 | 0.78 | 1,2 | |
| J11081509-7733531 | T33A | G7 | 5630 | 0.85 | 2.8 | 1,2 |
| J11081648-7744371 | T34 | M3.75 | 3306 | 0.29 | 0.15 | 1 |
| J11081703-7744118 | Cha H 13 | M5.5 | 3058 | 0.32 | 0.083 | 1,2 |
| J11081850-7730408 | ISO 138 | M6.5 | 2935 | 0.00 | 0.0075 | 1 |
| J11081896-7739170 | Cha H 4 | M5.5 | 3058 | 0.23 | 0.055 | 1,2 |
| Cha J11081938-7731522 | M4.75 | 3161 | 0.45 | 0.00062 | ||
| J11082238-7730277 | ISO 143 | M5 | 3125 | 1.13 | 0.088 | 1 |
| J11082404-7739299 | Cha H 10 | M6.25 | 2962 | 0.11 | 0.0066 | 1,2 |
| J11082410-7741473 | Cha H 5 | M5.5 | 3058 | 0.56 | 0.082 | 1,2 |
| J11082570-7716396 | M8 | 2710 | 0.68 | 0.0014 | 1 | |
| J11082650-7715550 | ISO 147 | M5.75 | 3024 | 0.68 | 0.019 | 1 |
| J11082927-7739198 | Cha H 11 | M7.25 | 2838 | 0.00 | 0.0047 | 1,2 |
| Cha J11083040-7731387 | M9 | 2400 | 0.28 | 0.00033 | 1,2 | |
| J11083905-7716042 | T35 | K8 | 3955 | 1.31 | 0.53 | |
| J11083952-7734166 | Cha H 6 | M5.75 | 3024 | 0.38 | 0.057 | 1,2 |
| J11084069-7636078 | CHXR 33 | M2.5 | 3488 | 1.26 | 0.74 | |
| J11084952-7638443 | M8.75 | 2478 | 0.00 | 0.0014 | 1 | |
| J11085090-7625135 | T37 | M5.25 | 3091 | 0.11 | 0.038 | 1 |
| J11085176-7632502 | [LES2004] 737 | M7.25 | 2838 | 0.59 | 0.011 | 1 |
| J11085421-7732115 | CHXR 78C | M5.25 | 3091 | 0.56 | 0.066 | 1,2 |
| J11085464-7702129 | T38 | M0.5 | 3778 | 0.90 | 0.34 | 1 |
| J11085497-7632410 | ISO 165 | M5.5 | 3058 | 0.63 | 0.035 | 1 |
| J11085596-7727132 | ISO 167 | M5.25 | 3091 | 1.69 | 0.061 | |
| J11090512-7709580 | Hn 7 | M4.75 | 3161 | 0.18 | 0.068 | 1 |
| T39A | M2 | 3560 | 0.34 | 0.33 | 1 | |
| T39B | M3 | 3415 | 0.45 | 0.26 | ||
| Cha J11091363-7734446 | M9 | 2400 | 0.28 | 0.00047 | 1,2 | |
| J11091380-7628396 | CHXR 35 | M4.75 | 3161 | 0.18 | 0.072 | 1 |
| J11091769-7627578 | CHXR 37 | K7 | 4060 | 0.90 | 1.1 | 1 |
| J11091812-7630292 | CHXR 79 | M1.25 | 3669 | 1.92 | 0.55 | |
| J11092266-7634320 | C1-6 | M1.25 | 3669 | 3.27 | 0.80 | |
| J11092379-7623207 | T40 | K6 | 4205 | 0.56 | 0.53 | 1 |
| J11092913-7659180 | [LES2004] 602 | M5.25 | 3091 | 0.45 | 0.024 | 1 |
| J11093543-7731390 | M8.25 | 2632 | 0.00 | 0.0014 | 1,2 | |
| J11093777-7710410 | Cam 2-42 | K7 | 4060 | 3.16 | 2.0 | |
| J11094006-7628391 | CHXR 40 | M1.25 | 3669 | 0.56 | 0.68 | 1 |
| J11094260-7725578 | C7-1 | M5 | 3125 | 1.92 | 0.23 | |
| J11094525-7740332 | ESO H 566 | M5.75 | 3024 | 0.50 | 0.058 | 1,2 |
| J11094621-7634463 | Hn 10E | M3.25 | 3379 | 1.01 | 0.15 | 1 |
| J11094742-7726290 | B43 | M3.25 | 3379 | 2.26 | 0.22 | |
| J11094918-7731197 | KG 102 | M5.5 | 3058 | 0.68 | 0.036 | 1 |
| J11095003-7636476 | T41 | B9 | 10500 | 0.70 | 57 | 1 |
| J11095215-7639128 | ISO 217 | M6.25 | 2962 | 0.68 | 0.023 | 1 |
| J11095262-7740348 | CHSM 15991 | M3 | 3415 | 0.79 | 0.0029 | |
| J11095336-7728365 | ISO 220 | M5.75 | 3024 | 1.71 | 0.030 | |
| J11095340-7634255 | T42 | K5 | 4350 | 1.47 | 3.0 | |
| J11095407-7629253 | T43 | M2 | 3560 | 1.47 | 0.48 | |
| J11095437-7631113 | ISO 225 | M1.75 | 3596 | 1.24 | 0.013 | |
| J11095873-7737088 | T45 | M1.25 | 3669 | 0.56 | 0.84 | 1,2 |
| J11100010-7634578 | T44 | K5 | 4350 | 1.35 | 5.5 | |
| J11100192-7725451 | [LES2004] 419 | M5.25 | 3091 | 2.03 | 0.062 | |
| J11100369-7633291 | Hn 11 | K8 | 3955 | 2.14 | 0.66 | |
| J11100469-7635452 | T45A | M1 | 3705 | 0.54 | 0.43 | 1 |
| J11100658-7642486 | M9.25 | 2350 | 0.00 | 0.0010 | 1 | |
| J11100704-7629376 | T46 | M0 | 3850 | 1.13 | 1.4 | 1 |
| J11100785-7727480 | ISO 235 | M5.5 | 3058 | 2.41 | 0.11 | |
| J11100934-7632178 | OTS 44 | M9.5 | 2300 | 0.00 | 0.00077 | 1 |
| J11101141-7635292 | ISO 237 | K5.5 | 4278 | 1.92 | 1.2 | |
| J11101153-7733521 | M4.5 | 3198 | 0.56 | 0.077 | 1 | |
| J11102226-7625138 | CHSM 17173 | M8 | 2710 | 0.00 | 0.013 | 1 |
| J11102852-7716596 | Hn 12W | M5.5 | 3058 | 0.00 | 0.066 | 1 |
| J11103481-7722053 | [LES2004] 405 | M4 | 3270 | 1.94 | 0.32 | |
| J11103644-7722131 | ISO 250 | M4.75 | 3161 | 2.32 | 0.23 | |
| J11103801-7732399 | CHXR 47 | K3 | 4730 | 1.44 | 2.6 | |
| J11104006-7630547 | M7.25 | 2838 | 0.59 | 0.0082 | 1 | |
| J11104141-7720480 | ISO 252 | M6 | 2990 | 0.97 | 0.022 | 1 |
| J11104959-7717517 | T47 | M2 | 3560 | 1.17 | 0.42 | 1 |
| J11105076-7718031 | ESO H 568 | M4.25 | 3234 | 0.81 | 0.11 | 1 |
| J11105333-7634319 | T48 | M3.75 | 3306 | 0.14 | 0.13 | 1 |
| J11105359-7725004 | ISO 256 | M4.5 | 3198 | 2.55 | 0.070 | |
| J11105597-7645325 | Hn 13 | M5.75 | 3024 | 0.23 | 0.13 | 1 |
| J11111083-7641574 | ESO H 569 | M2.5 | 3488 | 0.68 | 0.0030 | |
| J11112249-7745427 | [LES2004] 436 | M8.25 | 2632 | 0.00 | 0.0022 | |
| J11112260-7705538 | ISO 274 | M4.5 | 3198 | 0.45 | 0.10 | |
| J11113474-7636211 | CHXR 48 | M2.5 | 3488 | 0.23 | 0.21 | |
| J11113965-7620152 | T49 | M2 | 3560 | 0.34 | 0.37 | |
| J11114533-7636505 | [LES2004] 743 | M8 | 2710 | 0.34 | 0.0033 | |
| J11114632-7620092 | CHX 18N | K6 | 4205 | 0.20 | 1.3 | |
| J11115400-7619311 | CHXR 49NE | M2.5 | 3488 | 0.14 | 0.36 | |
| J11120288-7722483 | M6 | 2990 | 0.68 | 0.022 | ||
| J11120327-7637034 | CHXR 84 | M5.5 | 3058 | 0.00 | 0.063 | |
| J11120351-7726009 | ISO 282 | M4.75 | 3161 | 1.01 | 0.030 | |
| J11120984-7634366 | T50 | M5 | 3125 | 0.11 | 0.15 | |
| J11122250-7714512 | M9.25 | 2350 | 0.00 | 0.0015 | ||
| J11122441-7637064 | T51 | K3.5 | 4660 | 0.00 | 1.0 | |
| J11122772-7644223 | T52 | G9 | 5410 | 0.42 | 5.0 | |
| J11123092-7644241 | T53 | M1 | 3705 | 0.79 | 0.39 | |
| J11123099-7653342 | [LES2004] 601 | M7 | 2880 | 0.00 | 0.0074 | |
| J11124210-7658400 | CHXR 54 | M1 | 3705 | 0.34 | 0.41 | |
| J11124268-7722230 | T54 | G8 | 5520 | 0.60 | 4.2 | |
| J11124299-7637049 | CHXR 55 | K4.5 | 4470 | 0.31 | 0.61 | |
| J11124861-7647066 | Hn 17 | M4 | 3270 | 0.09 | 0.053 | |
| J11132012-7701044 | CHXR 57 | M2.75 | 3451 | 0.11 | 0.18 | |
| J11132446-7629227 | Hn 18 | M3.5 | 3342 | 0.14 | 0.073 | |
| J11132737-7634165 | CHXR 59 | M2.75 | 3451 | 0.11 | 0.24 | |
| J11132970-7629012 | CHXR 60 | M4.25 | 3234 | 0.09 | 0.089 | |
| J11133356-7635374 | T55 | M4.5 | 3198 | 0.07 | 0.080 | |
| J11141565-7627364 | CHXR 62 | M3.75 | 3306 | 0.38 | 0.15 | |
| J11142454-7733062 | Hn 21W | M4 | 3270 | 0.72 | 0.11 | |
| J11142611-7733042 | Hn 21E | M5.75 | 3024 | 0.56 | 0.042 | |
| J11142906-7625399 | ESO H 571 | M4.75 | 3161 | 0.18 | 0.037 | |
| J11145031-7733390 | B53 | M2.75 | 3451 | 0.00 | 0.24 | |
| J11152180-7724042 | ESO H 572 | M4.75 | 3161 | 0.41 | 0.096 | |
| J11155827-7729046 | M4.5 | 3198 | 0.00 | 0.057 | ||
| J11160287-7624533 | ESO H 574 | K8 | 3955 | 0.45 | 0.0034 | |
| J11173700-7704381 | T56 | M0.5 | 3778 | 0.16 | 0.39 | |
| J11173792-7646193 | M5.75 | 3024 | 0.00 | 0.013 | ||
| J11175211-7629392 | M4.5 | 3198 | 0.18 | 0.087 | ||
| J11181957-7622013 | CHXR 68B | M2.25 | 3524 | 0.18 | 0.15 | |
| J11182024-7621576 | CHXR 68A | K8 | 3955 | 0.23 | 0.70 | |
| J11183379-7643041 | M5 | 3125 | 0.00 | 0.097 | ||
| J11183572-7935548 | M4.75 | 3161 | 0.00 | 0.21 | ||
| J11194214-7623326 | M5 | 3125 | 0.23 | 0.033 | ||
| J11195652-7504529 | M7.25 | 2838 | 0.00 | 0.0077 | ||
| J11241186-7630425 | M5 | 3125 | 0.77 | 0.047 | ||
| J11242980-7554237 | M4.75 | 3161 | 0.23 | 0.18 | ||
| J11332327-7622092 | M4.5 | 3198 | 0.00 | 0.20 | ||
| J11334926-7618399 | M4.5 | 3198 | 0.23 | 0.058 | ||
| J11404967-7459394 | M5.75 | 3024 | 0.00 | 0.027 | ||
| J11432669-7804454 | M5 | 3125 | 0.27 | 0.096 |