Optical phase diagram of perovskite-type colossal magnetoresistance manganites
with near-half doping
Abstract
We present a systematic optical study for a bandwidth-controlled series of nearly half doped colossal magnetoresistive manganites RE0.55AE0.45MnO3 (RE and AE being rare earth and alkaline earth ions, respectively) under the presence of quenched disorder over a broad temperature region K. The ground state of the compounds ranges from the charge and orbital ordered insulator through the spin glass to the ferromagnetic metal. The enhanced phase fluctuations, namely the short-range charge and orbital correlations dominate the paramagnetic region of the phase diagram above all the ground-state phases. This paramagnetic region is characterized by a full-gap to pseudo-gap crossover towards elevated temperatures where a broad low-energy electronic structure appears in the conductivity spectra over a large variation of the bandwidth. This pseudo-gap state with local correlations is robust against thermal fluctuations at least up to K. For small bandwidth the onset of the long-range charge order is accompanied by an instantaneous increase of the gap. The emergence of the ferromagnetic state is manifested in the optical spectra as a first-order insulator to metal transition for compounds with moderate bandwidth while it becomes a second-order transition on the larger bandwidth side. Unusually large scattering rate of the metallic carriers is observed in the ferromagnetic state which is attributed to orbital correlation with probably rod-like (-like) character.
pacs:
I Introduction
The accumulation of dopant charges in Mott insulators and the dependence of the critical doping level on the relative strength of the Coulomb repulsion have been studied for a large variety of correlated electron systems.Katsufuji95 ; Okimoto95 ; Katsufuji97 ; Tokura98 Generally, with increasing ratio (where is the on-site Coulomb interaction and the effective one-electron bandwidth) the insulating phase becomes more robust against doping-induced insulator to metal transition.
In perovskite-type manganites, due to the strong interplay between electronic charge, spin, orbital, and lattice degrees of freedom, at specific carrier concentrations (so-called commensurate doping levels) several charge and orbital ordered (CO/OO) patterns emerge accompanied by antiferromagnetic ordering.Goodenough55 ; Jirak85 These CO/OO states are inherently insulators and in their vicinity charge and orbital correlation effects are critically intensified. Consequently, for the compounds with relatively narrow one-electron bandwidth the CO/OO ground state remains stable against considerable variation of doping and hence the metallic conduction does not appear.Okimoto00 ; Tomioka02 ; Tomioka04 However, at a fixed carrier concentration, as the bandwidth of the electrons is increased, the CO/OO suddenly collapses and the compound goes through a first order insulator to metal transition and simultaneously an antiferromagnetic to ferromagnetic transition.Tomioka02 ; Tomioka04 This tendency is discerned in Fig. 1(a) in the bandwidth-temperature phase diagram typical of RE1-xAExMnO3 materials close to half doping, namely for in the present case. Throughout the paper we shall refer the averaged radius of RE1-xAEx as a measure of the one-electron bandwidth, in the sense that it reflects the magnitude of the double exchange interaction responsible for the ferromagnetic metallic phase (FM).Furukawa95 The competition of spin-orbital exchange interaction energies, further balanced by strong coupling to the lattice, is clearly manifested in the first-order nature of the transition between the two robust phases with ordering temperatures ( and , respectively) higher than K. The first-order transition line separating the two ordered phases is terminated by a bicritical point at as high temperature as K, indicating the stability of the both phases against thermal fluctuations. In contrast, the application of magnetic fields of a few tesla efficiently induce the CO/OO AFI to FM transition implying the precise balance of the free energy for the two neighboring ground states.Tomioka96 ; Tokura00 ; Okimoto00 ; Tomioka02 ; Tomioka06 These result in gigantic phase fluctuations above the bicritical point and cause that the onset of the ordered phase with decreasing temperature also occurs in a first-order-transition manner on either side of the bicritical point.Murakami03 ; Adams04 ; Kim02 ; Tomioka04 Among macroscopic quantities, colossal magnetoresistance (CMR) is the most dramatic manifestation of this phase-fluctuation induced phenomenon.Tokura-book ; Tokura06
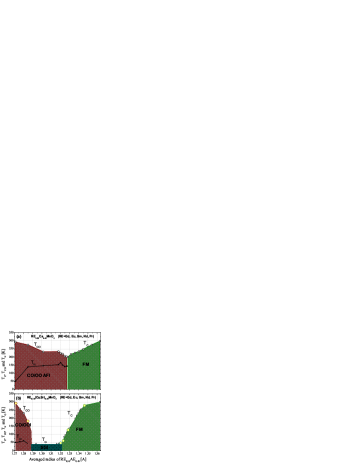
In perovskite-type manganites the carriers are doped via the partial substitution of the rare earth component (RE) with divalent ions in the form of RE1-xAExMnO3 where usually AECa, Sr, and Ba. In addition to the change of the band filling, this random doping introduces quenched disorder into the lattice which can result in a critical suppression of the long range order on the both sides of the bicritical point (Fig. 1(b)). The variance of the ionic radius at the perovskite site was found to well represent the degree of disorder.Rodriguez98 ; Rodriguez00 For the compounds in Fig. 1(a) the variance is rather low while it is considerably large for those in Fig. 1(b) and therefore they will be referred to as low- and high-disorder phase diagram, respectively.
The long-range CO/OO AFI state is primarily sensitive to the local lattice distortion and looses territory towards larger variance. The broad intermediate region bounded by the two ordered phases in Fig. 1(b) is characterized by short-range CO/OO correlation enhanced toward low temperatures and finally frozen to an insulating glassy state below . The weakening of the ferromagnetism or the critical suppression of close to the bicritical point is probably the result of CO/OO fluctuations, as well. This was indeed observed in recent x-ray diffuse scattering and Raman scattering experiments: Similarly to the temperature region above and ,Shimomura99 ; Shimomura00 ; Jirak00 ; Mathieu04 for larger bandwidth the CO/OO correlation is also critically enhanced toward low temperatures where it was suddenly cut by the first-order FM transition.Tomioka03 ; Motome03 Therefore, it seems very plausible to consider that the paramagnetic region above all the ground-state phases is essentially governed by strong short-range correlation of the CO/OO phase in addition to FM spin fluctuations.
In an effort to understand the details of the CMR effect for nearly half-doped perovskite manganites with high quenched disorder – beyond the basic picture capturing the role of competing magnetic exchange interactions and interlocking of spin, charge, orbital, and lattice degrees of freedom Furukawa94 ; Millis95 – several intrinsic and extrinsic mechanisms have been proposed. The formers treat CMR as a result of strong fluctuations of a homogeneous quantum phase,Tokura00 ; Murakami03 ; Mathieu04 while the latters consider disoder-induced phase separation and percolation effects indispensable for the description of the phenomenon.Uehara99 ; Dagotto02 Recently, the existence of topological defects in the orbital order, namely orbital solitons carrying charge, for manganites close to half doping were also suggested as a natural explanation of nanoscale inhomogeneities in these materials.Brey05
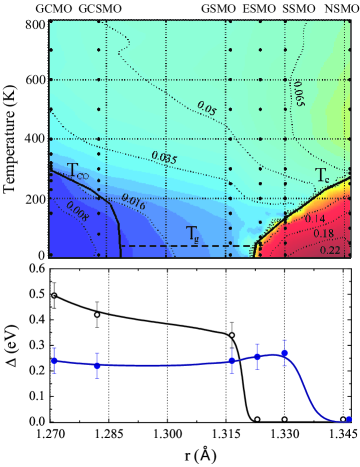
In order to investigate the influence of the dramatic phase change and enhanced CO/OO fluctuations on the low-energy electronic states of CMR manganites, we performed a systematic optical study over the compounds highlighted in Fig. 1b. Changing the chemical composition along this series results dominantly in a variation of the bandwidth while the level of quenched disorder is kept relatively high. The presence of neighboring phases with different types of orbital order in nearly half-doped perovskite manganites Konishi99 ; Tobe04 ; Endoh05 ; Tokura06 also gives the hint that critical amplification of orbital fluctuations may play a unique role in CMR effect. The main goal of the paper is to follow the fingerprints of short-range CO/OO correlation in the low-energy optical conductivity spectra of RE0.55AE0.45MnO3 compounds over a broad range of the bandwidth-temperature phase diagram. The systematics of the low-energy electronic structure, obtained in the course of the present optical study and discussed in the body of the paper, are visualized in Fig. 2.
II Experimental details
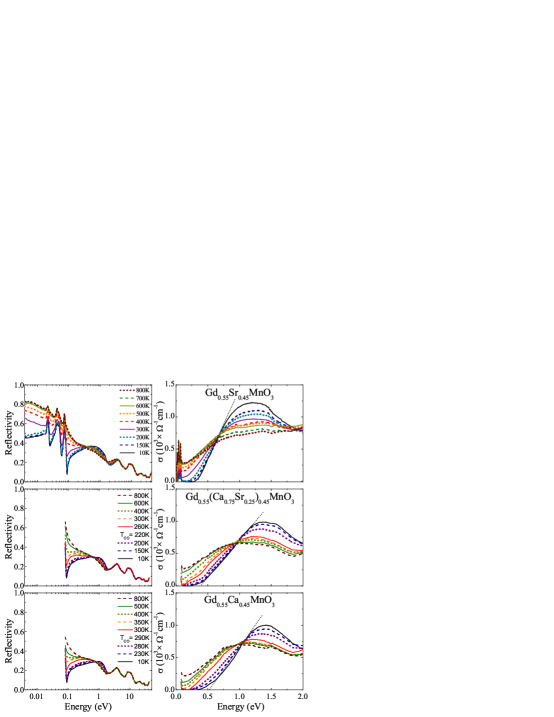
All of the RE0.55AE0.45MnO3 samples (RENd, Sm, Eu, and Gd; AECa and Sr) investigated here were single crystals grown by a floating-zone method. Throughout the paper, for Nd0.55Sr0.45MnO3, Sm0.55Sr0.45MnO3, Eu0.55Sr0.45MnO3, Gd0.55Sr0.45MnO3, Gd0.55(Ca0.75Sr0.25)0.45MnO3, Gd0.55Ca0.45MnO3 we use the abbreviations NSMO, SSMO, ESMO, GSMO, GCSMO, and GCMO, respectively. In the CO/OO state, these compounds are characterized by electron dynamics with nearly isotropic optical conductivity within the -plane and with reduced low-energy spectral weight for polarization along the -axis.Tobe04 Therefore, in the present systematic study of the optical properties over a broad range of the bandwidth-temperature plane, we used oriented single crystals and measured reflectivity spectra at nearly normal incidence on the (001) crystallographic plane (in the pseudocubic setting). The samples were cut and polished with alumina powder to the optical flatness. In order to eliminate residual strains of surface layers induced by mechanical polishing the crystals were annealed at C for about hours.Saitoh99
Reflectivity spectra were investigated in a photon-energy range of meV eV below room temperature and in a slightly limited range ( meV) for K. For the proper Kramers-Kronig analysis the room temperature measurements were extended up to eV with use of synchrotron radiation at UV-SOR, Institute for Molecular Science. Although the obtained conductivity spectra cover the whole range of representative charge-transfer excitations,Arima95 here we focus on the low-energy part governed by correlation effects. In our convention denotes the real part of the optical conductivity simply referred to as the optical conductivity.
III Evolution of the ground state
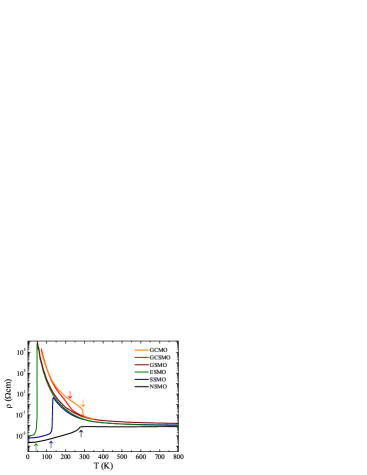
The temperature dependence of the dc resistivity measured on the respective single crystals by the standard four-probe method is shown in Fig. 3. The onset of the CO/OO or the FM transition is clearly manifested in the resistivity curves as indicated by arrows. As a general tendency, with increasing bandwidth steeply decreases. In case of Gd0.55Sr0.45MnO3 with the glassy ground state, although the long-range CO/OO order is lost, the system remains insulating. Upon further increase of the bandwidth, the low-temperature phase becomes a ferromagnetic metal as discerned in Fig. 3 for REu, Sm, and Nd. Irrespective of the ground-state nature, the curves tend to converge in the high-temperature disordered phase. In fact, the difference at room temperature is only one order of magnitude and it is further reduced down to a factor of at the elevated temperature, .
For the study of the bandwidth-controlled low-energy spectral changes, we mostly focus on the intraband transitions of the Mn electrons (hybridized with O states) located below eV. The ground state conductivity spectra for the two end-compounds are plotted over a broader energy range up to eV in the inset of Fig. 4. Gd0.55Ca0.45MnO3 is an insulator with a charge gap eV. The broad peak located at around eV corresponds to optical transition of and electrons to the neighboring site with parallel spin and therefore related to the intersite Coulomb interaction. It is separated by a clear minimum from the higher-lying Mn O charge-transfer excitations centered at eV. On the other hand, Nd0.55Sr0.45MnO3 shows metallic-like optical response. Parallel to the enhanced low-energy spectral weight, the oscillatory strength of the charge-transfer peak is reduced, indicating stronger hybridization between Mn and O electrons, as expected within the framework of double exchange mechanism.
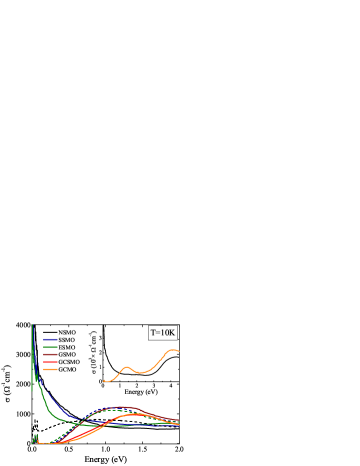
The evolution of the low-energy optical conductivity spectra with the variation of the bandwidth is discerned in Fig. 4. Three distinct spectral shapes are observed: (i) the two CO/OO compounds have a charge gap eV followed by the broad peak at eV; (ii) in case of Gd0.55Sr0.45MnO3 with the glassy ground state the presence of the charge gap is still clear although it is smaller in magnitude and the is simultaneously reduced; (iii) the three FM compounds exhibit broad metallic conductivity spectra with strong incoherent, i.e. only gently -dependent, character up to eV which is typical of CMR manganites. Since the spin sector is fully polarized at low temperatures, orbital fluctuations are likely responsible for the enhanced scattering amplitude. Besides the ground state spectra, the optical conductivity just above is also plotted for the FM compounds. Except for Nd0.55Sr0.45MnO3 with the largest bandwidth, they resemble that of Gd0.55Sr0.45MnO3 in its glassy ground state; the charge gap characteristic to the short-range CO/OO phase is already developed at elevated temperatures above the onset of the ferromagnetic metallic state. We just note here and discuss later in detail that the gap of the two CO/OO materials shows a discontinuous decrease at and that just above the CO/OO transition it is also close to the ground state value of Gd0.55Sr0.45MnO3.
IV Crossover towards the high-temperature phase
Here we turn to the analysis of the temperature-induced spectral-weight transfer both for the insulating and metallic compounds. While the charge gap in the CO/OO state of GCMO and GCSMO shows only a weak temperature dependence up to , the loss of the long-range order results in a sudden decrease of the gap energy as shown in Fig. 5. The shape of their optical conductivity spectra just above the transition resemble that of GSMO in the ground state. Above the gap is gradually filled by thermal fluctuations and a fully incoherent low-energy conductivity emerges. In both compounds the spectral-weight is transfered dramatically through an equal-absorption (isosbestic) point at eV. On the other hand, in GSMO the closing of the gap occurs in a smooth way. Although in either of the three insulators the metallic conductivity is not fully recovered at any temperatures, the development of an incoherent contribution to the optical conductivity implies the partial liberation of the orbital degrees of freedom in the sector. More specifically, the reduced gap in the glassy ground state of GSMO and above in the CO/OO insulators is due to orbital redistribution of the excess electrons ( relative to the commensurate level) which occupy orbitals of originally sites in the long-range ordered state.Jirak85 Their optical transitions dominating the -axis conductivity are characterized by a remarkably smaller gap energy as observed in Pr0.6Ca0.4MnO3.Okimoto00 The melting of this CO/OO phase means the emergence of a charge-orbital liquid state in which the local CO/OO correlations are still dominant and together with dynamical Jahn-Teller effect preserve electron localization. Towards high temperatures the electronic state of the three insulators become similar as manifested in their nearly identical optical conductivity spectra above K.

At the metallic side of the phase diagram the gradual transfer of the low-energy spectral weight to the eV peak occurs when is approached (see Fig. 6). In this case the isosbestic behavior is also discerned with an equal-absorption point at eV. This energy scale is considerably lower than in the CO/OO insulators but close to that of GSMO. The ferromagnetic to paramagnetic transition is associated with a dramatic redistribution of the spectral weight, especially in ESMO and SSMO where the instantaneous opening of the charge gap is observed above . In NSMO with larger bandwidth (and equivalently with higher Curie temperature) the transition occurs in a continuous manner and only a pseudo-gap develops in the paramagnetic (PM) phase. The change in the character of the FM transition (from first to second order) between SSMO and NSMO can be well followed in lower panel of Fig. 2 as well, where the charge gap is plotted for the whole series of the compounds both along the and phase boundaries. With increasing bandwidth, the gap evaluated at the lowest temperature of the PM phase shows only tiny variation around eV till SSMO while it completely vanishes for NSMO. Detailed magneto-transport and magnetization studies also evidence that the first-order PM-FM phase boundary is terminated between SSMO and NSMO and the transition becomes continuous for larger bandwidth.Demko08 The presence of first-order phase boundaries (indicated by thick line in both panels of Fig. 1) separating the FM state both from the CO/OO and PM phase implies dramatic change in the orbital character of electrons. Although it is a central issue in the CMR physics, the orbital nature of the FM state has not utterly been clarified. In the present optical study this question is also to address in the context of the large scattering rate observed in the fully spin polarized low-temperature state. For the present metals three possible scenarios have been proposed: (i) a disordered phase involving both and orbitals Tobe04 or strong ferro-orbital correlations of either (ii) the planar -type Ishihara97 ; Khaliullin00 or (iii) the rod-like -type.Endoh05 In case of SSMO, the development of rod-like order is supported by recent neutron scattering experiments; the anomalously large fourth-neighbor interaction along (or or ) direction, , implies the extended one-dimensional exchange path reflecting the rod-like orbital correlation.Endoh05 The effect of the orthorhombic lattice distortion is almost negligible for SSMO (which is also the case for ESMO and NSMO); the spatial and temporal fluctuations of the nearly equivalent [001], [010], and [100] domains prevent the onset of a static long-range orbital ordering for the investigated temperature region. Therefore, we ascribe the large scattering rate of the spin-polarized phase to these orbital fluctuations. The optical isotropy of the -plane also implies the lack of long-range order above K, thus the robust enhancement of the metallic conductivity in the vicinity of the ferromagnetic transition is attributable to the nearly temperature-independent spin-polarization up to .
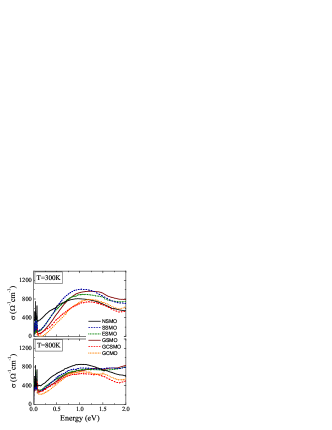
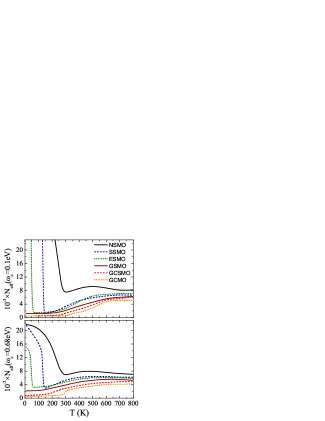
At room temperature which is slightly above both the FM and CO/OO phases, the optical conductivity spectra of the respective materials are close to each other irrespective of the nature of the ground state. They further converge and become nearly identical at the highest temperature of the present optical study, K, as discerned in Fig. 7. A systematic analysis of the low-energy spectral changes is given in Fig. 8 where the temperature dependence of the spectral weight, i.e. the effective number of electrons defined as , for eV and eV is simultaneously plotted for each compound. The former solely represents the metallic conductivity, while the latter corresponds to energy scale of the equal absorption point, therefore includes the strong incoherent mid-infrared contribution. Except for the FM phase where a stronger enhancement due to the development of coherent conduction is found in , the temperature dependence of the spectral weight is rather similar for the both energy scales. This implies that the low-energy excitations, i.e. the in-gap states, are fully governed by CO/OO correlations.
The variation of the total spectral weight, represented by , is also visualized over the whole phase diagram in the color contour plot of Fig. 2. Both the dramatic increase in below and its reduction below are clearly manifested in the contour plot. The light-blue region of the phase diagram characterized by a flat low-energy conductivity spectrum demonstrates the strong CO/OO fluctuations extending above all the three underlying phases. The pseudo-gap like feature of the optical spectra (i.e. the presence of the mid-infrared peak and the reduced optical weight below it) is preserved and the metallic conductivity is not recovered up to K, indicating the subsisting CO/OO correlations up to higher temperatures in this critically doped series of CMR manganites. On the other hand, x-ray experiments on the same materials could detect the diffuse scattering arising from the short-range orbital ordering, but no longer than up to K.Tomioka03 This means that above this temperature the correlation length of the lattice distortion is limited to the scale of the unit cell. However, infrared optical excitations can still sensitively pick up the local orbital configuration and thus give a direct tool for charge-orbital correlation effects in these materials.
V Conclusions
The aim of the present optical study of nearly half-doped colossal magnetoresistive manganites RE0.55AE0.45MnO3 with large quenched disorder was to characterize the nature of the low-energy electronic states responsible for the CMR effect. We have investigated the systematics of the optical conductivity spectrum over a broad area of the bandwidth vs temperature plane. The ground state of the compounds ranges from the charge and orbital ordered insulator through the spin glass to the ferromagnetic metal. The key role of critically enhanced phase fluctuations, most typically the short-range CO/OO correlation, was found in the paramagnetic region of the phase diagram above all the ground-state phases. This charge-orbital liquid state is characterized by a pseudo-gap below eV in the optical conductivity and flat low-energy optical conductivity spectrum over a large variation of the bandwidth. It is robust against thermal agitations and extends up to as high temperature as K. The onset of the long-range charge order is accompanied by an instantaneous increase of the gap. The emergence of the ferromagnetic state is manifested in the optical spectra as a first order insulator to metal transition for compounds with moderate bandwidth while it becomes a continuous transition on the largest bandwidth side. Unusually large scattering rate of the metallic carriers is observed in the ferromagnetic state which is attributed to orbital correlation probably with rod-like character.
Acknowledgement
The authors are grateful to N. Nagaosa and S. Onoda for enlightening discussions. This work was supported in part by a Graint-In-Aid for Scientific Research, MEXT of Japan. I. K. acknowledges support from Bolyai János Fellowship and the Hungarian Scientific Research Funds OTKA under grant Nos. F61413 and K62441.
References
- (1) T. Katsufuji, Y. Okimoto, and Y. Tokura, Phys. Rev. Lett. 75, 3497 (1995).
- (2) Y. Okimoto, T. Katsufuji, Y. Okada, T. Arima, and Y. Tokura, Phys. Rev. B51, 9581 (95).
- (3) T. Katsufuji, Y. Taguchi, and Y. Tokura, Phys. Rev. B56, 10145 (1997).
- (4) M. Imada, A. Fujimori, and Y. Tokura, Rev. Mod. Phys. 70, 1039 (1998).
- (5) J.B. Goodenough, Phys. Rev. 100, 564 (1955).
- (6) Z. Jirak, S. Krupicka, Z. Simsa, M. Dlouha, and S. Vratislav, J. Magn. Magn. Mat. 53, 153 (1985).
- (7) Y. Okimoto and Y. Tokura, J. Supercond. 13, 271 (2000).
- (8) Y. Tomioka and Y. Tokura, Phys. Rev. B66, 104416 (2002).
- (9) Y. Tomioka and Y. Tokura, Phys. Rev. B70, 14432 (2004).
- (10) N. Furukawa, J. Phys. Soc. Jpn. 64, 2734 (1995).
- (11) Y. Tomioka, H. Hiraka, Y. Endoh, and Y. Tokura, Phys. Rev. B74 104420 (2006).
- (12) Y. Tomioka, A. Asamitsu, H. Kuwahara, and Y. Tokura, Phys. Rev. B53, R1689 (1996).
- (13) Y. Tokura and N. Nagaosa, Science 288, 462 (2000).
- (14) S. Murakami and N. Nagaosa, Phys. Rev. Lett. 90 197201 (2003).
- (15) C.P. Adams, J.W. Lynn, V.N. Smolyaninova, A. Biswas, R.L. Greene, W. Ratcliff, S.W. Cheong, Y.M. Mukovskii, D.A. Shulyatev, Phys. Rev. B70, 134414 (2004).
- (16) K.H. Kim, S. Lee, T.W. Noh, S.W. Cheong, Phys. Rev. Lett. 88,167204 (2002)
- (17) Y. Tokura, ed., Colossal Magnetoresistive Oxides, Gordon & Breach, London (2000).
- (18) Y. Tokura, Rep. Prog. Phys. 69, 797 (2006).
- (19) L.M. Rodriguez-Martinez and J.P. Attfield, Phys. Rev. B54, R15622 (1998).
- (20) L.M. Rodriguez-Martinez and J.P. Attfield, Phys. Rev. B63, 24424 (2000).
- (21) S. Shimomura, N. Wakabayashi, H. Kuwahara, and Y. Tokura, Phys. Rev. Lett. 83, 4389 (1999).
- (22) S. Shimomura, T. Tonegawa, K. Tajima, N. Wakabayashi, N. Ikeda, T. Shobu, Y. Noda, Y. Tomioka, and Y. Tokura, Phys. Rev. B62, 3875 (2000).
- (23) Z. Jirak, F. Damay, M. Herview, C. Martin, B. Raveau, G. Andre, and F. Bouree, Phys. Rev. B61, 1181 (2000).
- (24) R. Mathieu, D. Akahoshi, A. Asamitsu, Y. Tomioka, and Y. Tokura, Phys. Rev. Lett. 93 227202 (2004).
- (25) Y. Tomioka, Y. Okimoto, J.H. Jung, R. Kumai, and Y. Tokura, Phys. Rev. B68, 94417 (2003).
- (26) Y. Motome, N. Furukawa, and N. Nagaosa, Phys. Rev. Lett. 91, 167204 (2003).
- (27) A.J. Millis, P.B.Littlewood, and B.I. Shraiman, Phys. Rev. Lett. 74, 5144 (1995).
- (28) N. Furukawa, J. Phys. Soc. Jpn. 63, 3214 (1994).
- (29) M. Uehara, S. Mori, C.H.Chen, and S-W. Cheong, Nature 399, 560 (1999).
- (30) E. Dagotto, Nanoscale Phase Separation and Colossal Magnetoresistance: The Physics of Manganites and Related Compounds, Springer-Verlag, New York (2002).
- (31) L. Brey and P.B. Littlewood, Phys. Rev. Lett. 95, 117205 (2005).
- (32) Y. Konishi, Z. Fang, M. Izumi, T. Manako, M. Kasai, H. Kuwahara, M. Kawasaki, K. Terakura, and Y. Tokura, J. Phys. Soc. Jpn. 68, 3790 (1999).
- (33) K. Tobe, T. Kimura, and Y. Tokura, Phys. Rev. B69, 14407 (2004).
- (34) Y. Endoh, H. Hiraka, Y. Tomioka, Y. Tokura, N. Nagaosa, and T. Fujiwara, Phys. Rev. Lett. 94, 17206 (2005).
- (35) E. Saitoh, Y. Okimoto, Y. Tomioka, and Y. Tokura, Phys. Rev. B60, 10362 (1999).
- (36) T. Arima and Y. Tokura, J. Phys. Soc. Jpn. 64, 2488 (1995).
- (37) L. Demkó et al., unpublished.
- (38) G. Khaliullin and R. Kilian, Phys. Rev. B61, 3494 (2000).
- (39) S. Ishihara, M. Yamanaka, and N. Nagaosa, Phys. Rev. B56, 686 (1997).