It’s a wonderful tail: the mass loss history of Mira
Abstract
Recent observations of the Mira AB binary system have revealed a surrounding arc-like structure and a stream of material stretching 2 degrees away in opposition to the arc. The alignment of the proper motion vector and the arc-like structure shows the structures to be a bow shock and accompanying tail. We have successfully hydrodynamically modelled the bow shock and tail as the interaction between the asymptotic giant branch (AGB) wind launched from Mira A and the surrounding interstellar medium. Our simulations show that the wake behind the bow shock is turbulent: this forms periodic density variations in the tail similar to those observed. We investigate the possiblity of mass-loss variations, but find that these have limited effect on the tail structure. The tail is estimated to be approximately 450 000 years old, and is moving with a velocity close to that of Mira itself. We suggest that the duration of the high mass-loss phase on the AGB may have been underestimated. Finally, both the tail curvature and the rebrightening at large distance can be qualitatively understood if Mira recently entered the Local Bubble. This is estimated to have occured 17 pc downstream from its current location.
1 Introduction
In the Mira binary system, Mira A is an evolved star which is undergoing a period of enhanced mass-loss as it moves along the asymptotic giant branch (AGB) on route to becoming a white dwarf. The companion star, previously classified as a white dwarf, now has a less clear classification (Karovska et al., 2005; Ireland et al., 2007) but is less luminous and any stellar outflow is comparably insignificant to Mira A in terms of mass-flux and energetics.
New UV observations of the Mira system (Martin et al., 2007) have revealed a comet-like tail extending 2 degrees away to the North and an arc-like structure in the South. Martin et al. (2007) postulated that these features are a bow shock and a ram-pressure-stripped tail stretching away in opposition to the bow shock caused by motion through the interstellar medium (ISM). Their postulation is consistent with Mira’s proper motion (Turon et al., 1993) of 225.8 milli-arcseonds per year in the direction 187.1 degrees East of North (corrected for solar motion). Further, they note that at the revised Hipparcos-based distance (Knapp et al., 2003) of 107 pc, the large space velocity of 130 , calculated from the proper motion and the radial velocity (Evans, 1967) of 63 , is further consistent with the bow shock structure.
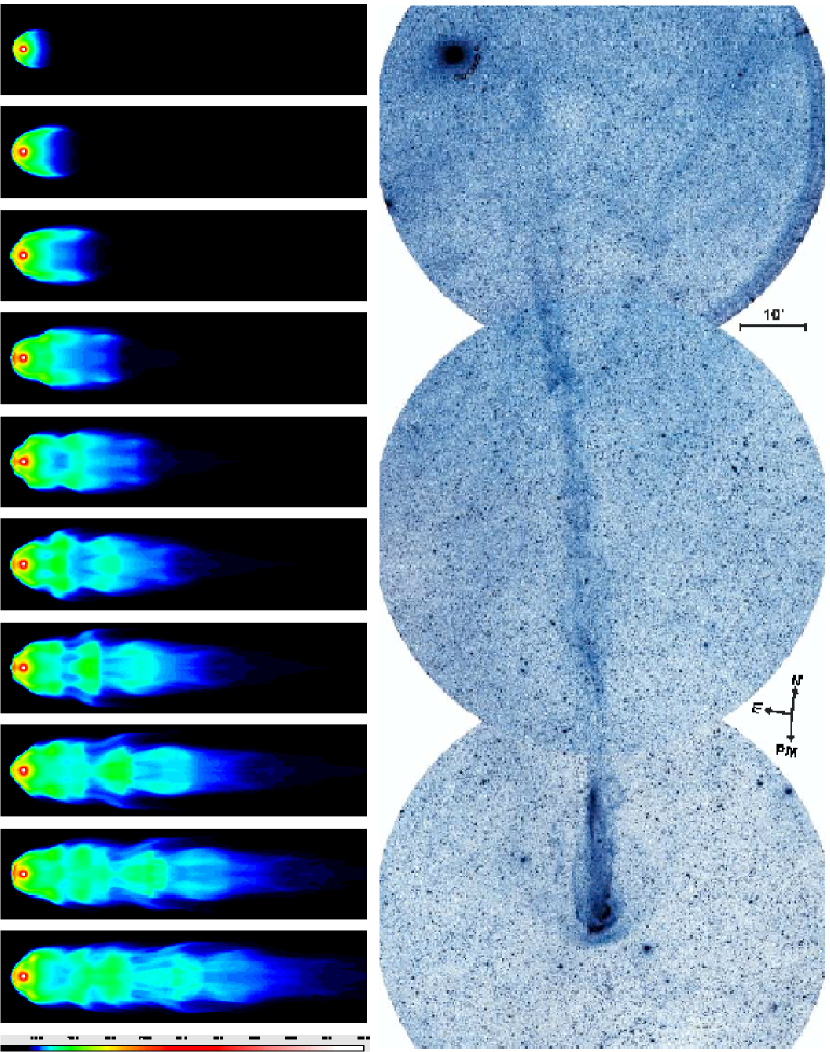
In this paper, we present hydrodynamical modelling of the Mira system and discuss the implications with respect to postulation of Martin et al. (2007). We are aiming to fit the position of the bow shock ahead of the central star, the width across the central star, the undulating density profile along the tail, the length of the tail and the ring-like structure one third the way down the tail. We show the GALEX observation in Figure 1.
2 Simulations
We have used a two-wind model consisting of a slow, dense AGB wind ejected from the position of the mass-losing star and a second wind representing the motion through the ISM. This model is the same as that used to successfully model the circumstellar structures around the evolved star R Hya (Wareing et al., 2006b) and the planetary nebula Sh 2-188 (Wareing et al., 2006a, 2007b). We have employed the same hydrodynamical scheme to simulate this model, with a numerical domain of cells and the central star placed at cell coordinates (,,) = (50,100,100). Each cell is a regular cube pc on a side giving a physical domain of pc3. The scheme is second order accurate and based on a Godunov-type method developed by Falle (1991) using a Riemann solver due to van Leer (1979). The scheme has recently been parallelised and extensively tested using standard computational fluid dynamics tests and astrophysical tests (Wareing, 2005) and includes the effect of cooling above 104 K via cooling curves calculated by Raymond et al. (1976). Mass-loss is effected by means of artificially resetting the hydrodynamical variables at the start of every timestep in a volume-weighted spherical region of radius 5 3/4 cells centred on the position of the central star.
In our yr simulation, we have used a mass-loss rate in the AGB wind of and a velocity of 5 . These are based upon observations of the CO lines (Ryde et al., 2000). An unphysical temperature of K was used for the temperature of the wind as the cooling curves extend no further but this does not affect the overall result (Wareing et al., 2006b). For the parameters of the ISM, we have considered a ram-pressure balance between the AGB wind and the ISM. In the direction of motion, the inner rim of the bow shock is 3.2 arc-minutes South of the system. At D = 107 pc, this corresponds to a distance of cm, implying a local ISM density of nH = 0.03 cm-3. The ISM density depends directly on AGB wind mass-loss rate and velocity.
The simulation begins at the onset of mass-loss and is performed in the frame of reference of the star. The wind from the star drives a shock into the ISM, which forms into a bow shock upstream of the star. Such bow shocks have been simulated in other cases of winds interacting with injected flows (Villaver, Garcia-Segura & Manchado, 2003; Pittard et al., 2005). Eventually, the simulation shows the bow shock reaches a maximum distance ahead of the star which can be understood in terms of a ram pressure balance between the stellar wind and the ISM. Strong shock theory predicts the temperature of the shocked material at the head of the bow shock: T . Our simulation is consistent with this. Ram-pressure-stripped material from the head of the bow shock forms a tail behind the nebula and as material moves down the tail, it deccelerates, cools and mixes with ISM material.
3 Results
In the left column of Figure 1 we show images of the density datacube collapsed along a line of sight perpendicular to the direction of motion and parallel to the y-axis of the simulation domain, at 50,000 year intervals through the simulation. In the right column of Figure 1 we show an adaptation of figure 1(a) from Martin et al. (2007) for comparison. The simulation best fits the observational characteristics of the bow shock and tail approximately 450,000 years into its AGB evolution; in particular, this reproduces the distance to the bowshock, the total width of the bowshock (0.55 pc across the position of the star) and the length of the tail ( pc). Our choice of ISM density correctly reproduces the position and width of the bow shock. The temperature of the ISM is less constrained as it has little effect on the ram pressure. The narrowness of the tail suggests that the pressure in the ISM dominates over the AGB wind confining it behind the star. This is understandable, as Mira has a high velocity through the ISM combined with a low mass-loss rate and outflow velocity for an AGB star.
The derived ISM density, 0.03 cm-3 is lower than derived by Martin et al. (2007) who find 0.8 cm-3; we cannot reproduce the location of the bow shock with such a high ISM density. The density is comparable to that of the Local Bubble, a low-density region of about 100 pc across in which the Sun is also located. An approximate 3-d map of the Local Bubble is presented by Lallement et al. (2003): on their maps Mira would be located close to the edge but inside of the higher density shell.
Our simulations imply the tail is far older than it appears from its spatial extent. Martin et al. (2007) derive an age of yr, based on the space velocity of Mira, assuming the tail is stationary with respect to the ISM. However, we find this age to be a lower limit. The material in the tail does not instantaneously decelerate to the ISM velocity. Instead, the gas being shed from the bow shock into the tail travels only marginally slower than Mira itself, at a relative velocity lag of 10-15 . This lag increases as material moves down the tail, which can be thought of as a decceleration with time. Comparing this to our simulation, the tail’s two degree extent on the sky corresponds to an age of yr. This can also be seen directly from Figure 1 which shows the tail has only grown to a length comparable to the observations after years of evolution. Thus, to reproduce a 4 pc tail in the simulation requires 450,000 years of mass-loss history. It is possible that in reality, deceleration in the tail is faster than the simulation indicates. This depends amongst others things on the friction between the tail and the ISM. The viscosity in the simulation is a fixed but artificial parameter, the value of which is chosen to avoid the Quirk effect (Quirk, 1994) which can cause accuracy issues near the axes of the simulation. A higher viscosity may yield a narrower width of the tail. Measurements of the velocity of the tail gas would help constrain this parameter. This may also reduce the age of the tail, which would be more comparable with the emission mechanisms suggested by Martin et al. (2007). We therefore suggest that the true age of the tail is somewhere between 30,000 and 450,000 years. For the rest of this paper, we use the latter age.
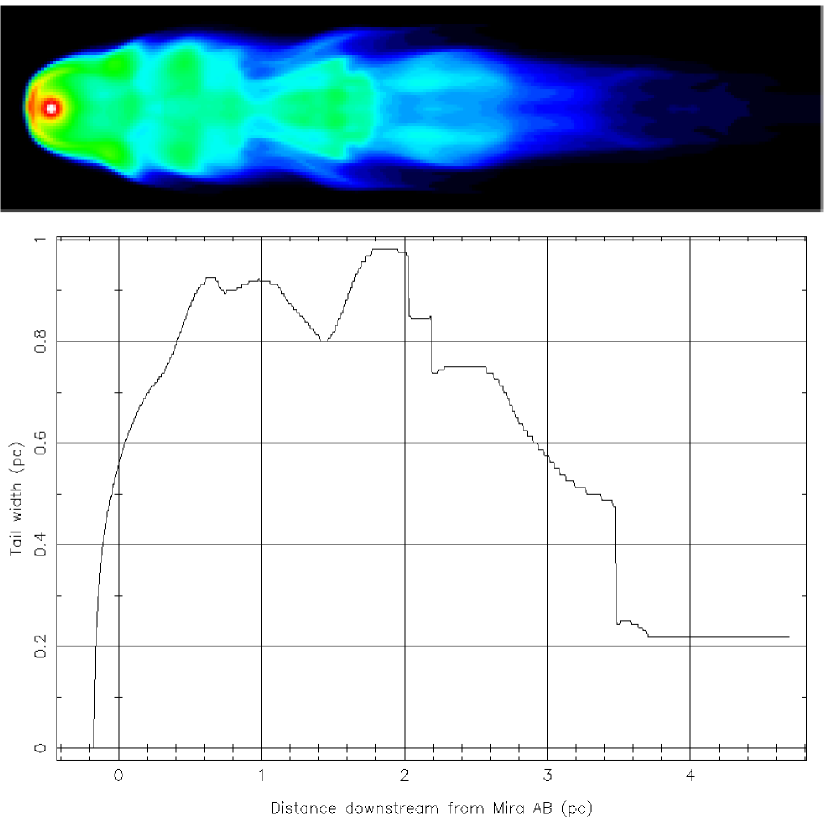
In Figure 2, we show the variation of the tail width along the length of the tail. The tail in our simulation is somewhat wider than the observed width, but does reproduce similar periodic structure along its length. The observed tail becomes more collimated with increasing distance from the bow shock. We do not reproduce this effect. This may be another consequence of friction between the tail and the ISM. Martin et al. (2007) has three possible explanations of the variation along the length of the tail: mass-loss variations, turbulence in the ISM and variations in the ISM density. Our simulation shows that undulations along the tail arise even when the mass loss and ISM density are assumed constant with time.
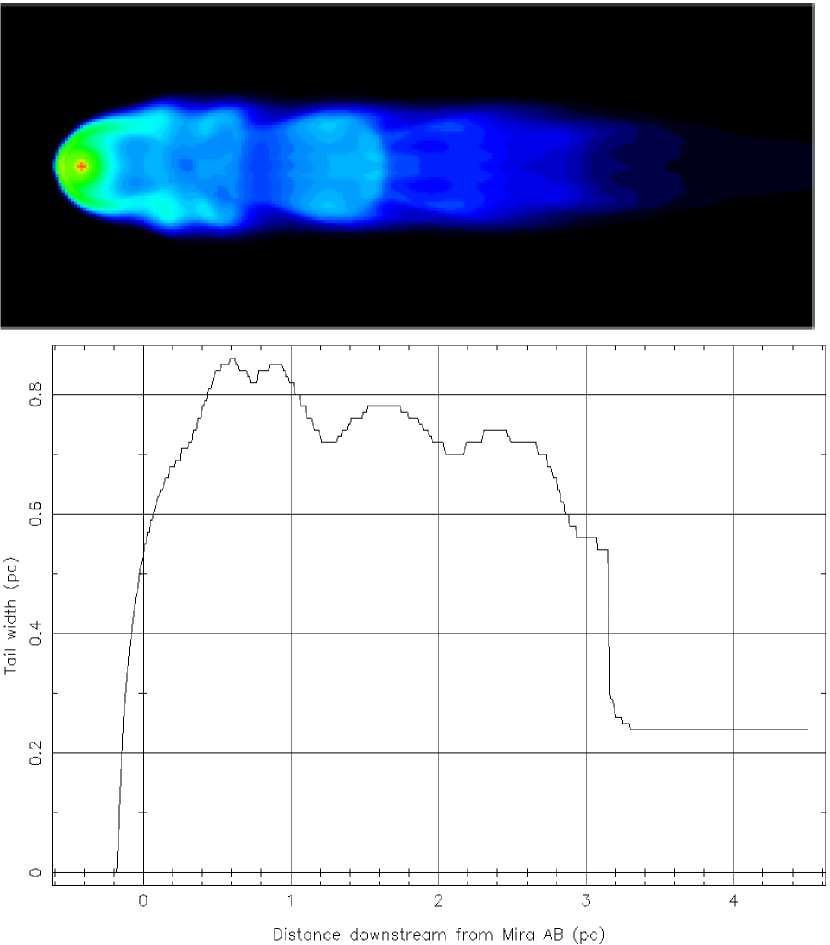
We have also explored the effects of time-variable mass-loss rates. The mass loss is expected to vary over the thermal pulse cycle (Vassiliadis & Wood, 1993): a long phase of fairly constant mass loss during the hydrogen burning phase, with a short spike during the helium flash followed by much lower rate during the phase of quiescent helium burning. As a guide, the H-burning lasts yr, the helium flash yr and the quiescent helium burning yr. We assume that the ISM density is constant over the length of the tail (4 pc) and vary the mass-loss rate by a factor of three increase during the Helium flash phase and a factor of three decrease during quiescent helium burning.
We show the results of this second simulation in Figure 3. Variation in the mass-loss rate has not greatly affected the characteristics of the bow shock and tail. Throughout the second simulation, the bow shock is in the same position and has the same width across the central star as it has in the first simulation. Structures in the tail which were a result of turbulence in the first simulation are in the same position, suggesting that structures observed in Mira’s tail are an effect of turbulence rather than of variations in the mass-loss rate. The tail is slightly narrower as can be seen from the lower panel of Figure 3. This is in better agreement with the observations, although still not as narrow as observed, possibly due to reasons discussed previously.
4 Discussion
4.1 Mass loss history
The age of the tail has implications for the evolution of Mira. At its current mass-loss rate, over yr Mira A will have lost 0.15 M⊙. A younger tail would proportionately reduce this value. This is a signicant change in stellar mass, sufficient to change the stellar radius and pulsation period. The models of Vassiliadis & Wood (1993) do not show any phase of mass loss at the rate shown by Mira lasting for such a long time. Higher rates are reached during the final phase of AGB evolution, the so-called superwind, but these are short-lasting. This suggests that the theoretical mass-loss rates for stars on the early thermal-pulsing AGB are underestimated.
Mira is a known binary and there has been a claim that the binary is causing asymmetric mass loss from the Mira system (Josselin et al., 2000). We do not see any effect from the binary companion or binary motion on the tail and bowshock and reproduce the observed structure without introducing an asymmetry into the AGB wind. This is not unexpected, as the size and time scales of the tail are very much larger than those of the binary system.
4.2 Mira and the Local Bubble
Over the previous 450,000 years, Mira has travelled approximately 60 pc. The slow deceleration from the system velocity of 130 explains why all the material released over this time is still within 4 pc of Mira. Mira’s Galactic position is (l,b) = (168,-58) (Perryman et al., 1997), about 90 pc South of the Galactic plane. Mira is traveling away from the Galactic plane: . The outermost extent of the tail was ejected while Mira was much closer to the plane. The star is likely to have experienced considerable changes in ISM density on its trajectory. Two aspects of the tail may best trace this: the narrowness and rebrightening of the tail starting about 40′ from Mira, and the bend in the tail starting at the same position. Assuming the 10 deceleration of the tail, this point corresponds to material ejected some 130,000 yr ago, 17 pc downstream from Mira’s current location.
The observed changes along the tail can be interpreted as an indication for a significantly higher ISM density at this location, 17 pc downstream, compared to Mira’s current environment. A higher ISM density would cause the bow shock to be closer to the star, and the tail to become narrower as a result. The swept-up mass would be higher, causing the brightening of the tail.
It is interesting to compare this with Mira’s location in the Local Bubble. Using the images of Lallement et al. (2003) (we use their figure 4), Mira is located within but close to the edge of the Local Bubble. The velocity vector, based on proper motion and radial velocity, is and where a correction was applied for the solar motion. With this motion, Mira may have passed into the Local Bubble some 30 pc back. This should not be overinterpreted as there are significant uncertainties in the extent of the Local Bubble, and the map used is for while Mira is at . However, this shows that the brightening along the tail can conceivably be caused by Mira passing through the neutral wall of the Local Bubble.
This is also the approximate point where the tail begins to show curvature. The difference between the proper motion vector and the tail direction measures the deceleration of the tail: the tail gas follows a slightly different orbit from Mira itself, remaining slightly closer to the Galactic plane than Mira was at that point in its orbit. A full simulation of this is beyond the scope of this paper, or the hydrodynamical code used. The curvature is probably caused by a larger deceleration of the gas in the tail, beyond this point of 17 pc downstream. A larger deceleration is expected for a higher ISM density, and so is consistent with Mira having recently moved out of a denser environment.
Following the entry of of Mira into the Local Bubble, the bow shock would have taken yr to re-establish itself (or to grow to its current size), and the tail may have taken yr to re-establish. This would correspond to the gap in the tail between 25′ and 35′ downstream. An equally likely explanation is that the gap is complete Hii dissociation in this low-density part of the tail.
The observations reveal a ring-like structure west of the tail, about 20 arcmin downstream. Wareing et al. (2007a) show that under some conditions, instabilities at the head of the bow shock cause von-Karman-like vortex shedding into the ram-pressure stripped tail. For the case of Mira, the simulations show turbulence, but this does not grow further into vortices. However, Wareing et al. (2007a) also postulated that variations in the ISM could seed or enhance bow shock instabilities and this could lead to vortex shedding. The reformation of the bow shock after the entry into the Local Bubble could have been the trigger for the initial instability leading to its single vortex.
4.3 One of a kind?
Observationally, the tail of Mira is unique. However, all evolved AGB stars show similar or stronger winds to Mira. This raises the question whether Mira is a proto-type or an exception, regarding its tail.
The main observational difference between Mira and typical similar stars is in the space velocity. This will have two effects: first, the tail narrows at higher velocities; second, the viscosity heats the surface layers of the tail, as the tail gas itself also moves at appreciable velocities with respect to the ISM. We suggest that this secondary heating has strong effects on the observability. Slower tails may not generate sufficient heating to produce observable UV emission.
We therefore suggest that Mira-like tails may be common, albeit in most cases not as narrow. However, they are not evident in current emission line surveys. An emission-line study of lower excitation lines may be worthwhile.
It is of interest to speculate on the future appearance of the planetary nebula Mira will eventually form. As the planetary expands it will strongly brighten when it reaches the bow shock. At this stage, its appearance may well be similar to that of the one-sided appearance of Sh 2-188 (Wareing et al., 2006a). The evolution of planetary nebula within a non co-moving ISM is discussed in Wareing et al. (2007b).
5 Conclusion
Our models for Mira’s evolution suggest that the tail traces half a million years of mass-loss history and ISM interaction. An instability at the bow shock is the cause of the fluctuations seen in the tail. Mass-loss variations of Mira A have much less effect. The curvature in the tail is caused by the differential velocity between Mira and its tail leading to different Galactic orbits. We attribute a gap in the tail to Mira entering the local bubble, 17 pc downstream from its current location. The time to reestablish the bow shock directly leads to the gap in the tail. A ring-like structure is attributed to a vortex shed into the tail just before the bow shock reached its equilibrium position. The tail therefore traces not only the history of Mira itself, but also the structure of the ISM along its path. It’s a wonderful prospect.
References
- Evans (1967) Evans, D. S. 1967, IAU Symp. 30, 57
- Falle (1991) Falle, S. A. E. G. 1991, MNRAS, 250, 581
- Ireland et al. (2007) Ireland, M. J. et al. 2007, ApJ, 662, 651
- Josselin et al. (2000) Josselin, E., Mauron, N., Planesas, P., Bachiller, R. 2000, A&A, 362, 255
- Karovska et al. (2005) Karovska, M., Schlegel, E., Hack, W., Raymond, J. C., Wood, B. E. 2005, ApJ, 623, L137
- Knapp et al. (2003) Knapp, G. R., Pourbaix, D., Platais, I., Jorissen, A. 2003, A&A, 403, 993
- Lallement et al. (2003) Lallement, R., Welsh, B.Y., Vergely, J.L., Crifo, F., Sfeir, D. 2003, A&A, 411, 447
- van Leer (1979) van Leer, B. 1979, J. Chem. Phys., 32, 101
- Martin et al. (2007) Martin, D.C. et al. 2007, Nature, 448, 780
- Perryman et al. (1997) Perryman, M.A.C. et al. 1997, A&A, 323, L49
- Pittard et al. (2005) Pittard, J.M., et al., 2005, MNRAS, 361, 1077
- Quirk (1994) Quirk, J. J. 1994, Int. J. Numer. Meth. Fl., 18, 555
- Raymond et al. (1976) Raymond, J.C., Cox, D.P., Smith, B. W. 1976, ApJ, 204, 290
- Ryde et al. (2000) Ryde, N, Gustafsson, B., Eriksson, K, Hinkle, K. H. 2000, ApJ, 545, 945
- Turon et al. (1993) Turon, C. et al. 1993, Bulletin d’Information du Centre de Donnees Stellaires, 43, 5
- Vassiliadis & Wood (1993) Vassiliadis, E., Wood, P.R. 1993, ApJ, 413, 641
- Villaver, Garcia-Segura & Manchado (2003) Villaver, E., Garcia-Segura, G., Manchado, A., 2003, ApJL, 585, L49
- Wareing (2005) Wareing, C. J. 2005, PhD thesis, Univ. of Manchester
- Wareing et al. (2006a) Wareing, C. J., et al., 2006a, MNRAS, 366, 387
- Wareing et al. (2006b) Wareing, C. J., et al., 2006b, MNRAS, 372, L63
- Wareing et al. (2007a) Wareing, C. J., Zijlstra, A. A., O’Brien, T. J. 2007, ApJ, 660, L129
- Wareing et al. (2007b) Wareing, C. J., Zijlstra, A. A., O’Brien, T. J. 2007, MNRAS, in press. Preprint (astro-ph/0709.2848)
- Zijlstra & Weinberger (2002) Zijlstra, A. A., Weinberger, R. 2002, ApJ, 572, 1006