119–126
CO, HI, Recent Spitzer SAGE Results in the Large Magellanic Cloud
Abstract
Formation of GMCs is one of the most crucial issues in galaxy evolution. I will compare CO and HI in the LMC in 3 dimensional space for the first time aiming at revealing the physical connection between GMCs and associated HI gas at a pc scale. The present major findings are 1) [total CO intensity] [total HI intensity]0.8 for the 110 GMCs, and 2) the HI intensity tends to increase with the evolution of GMCs. I argue that these findings are consistent with the growth of GMCs via HI accretion over a time scale of a few 10 Myrs. I will also discuss the role of the background stellar gravity and the dynamical compression by supershells in formation of GMCs.
keywords:
stars: formation, ISM: atoms, evolution, molecules, Magellanic Clouds, galaxies: star clusters1 Introduction
The Magellanic system including the LMC, SMC, and the Bridge is an ideal laboratory to study star formation and cloud evolution because of its proximity to the sun. In particular, the LMC offers the best site because of its unrivaled closeness and of the nearly face-on view to us. Among the various objects in the LMC, the molecular clouds which are probed best in the millimetric CO emission, provide a key to understand star formation and galaxy evolution. This is because the molecular clouds are able to highlight the spots of star formation due to their highly clumped distribution both in space and in velocity. The situation should be contrasted with atomic hydrogen gas having lower density and more loosely coupled to the star formation spots.
The key issue I would like to focus on in this talk is the formation of giant molecular clouds (GMC) in the LMC. GMCs are the major site of the star formation and the GMC formation must be a crucial step in the evolution of a galaxy. In order to address this issue, I will make (1) a comparison between HI and CO in 3 dimensional space to understand their physical correlation, (2) a comparison between stellar distribution which is dynamically controlling the HI density, and (3) a comparison with some of the most recent Spitzer SAGE results. The contents of sections 3 and 4 are mainly based on the collaboration with Hinako Iritani and Akiko Kawamura of Nagoya University and Tony Wong of ATNF and will be published elsewhere.
2 Three Classes of GMCs
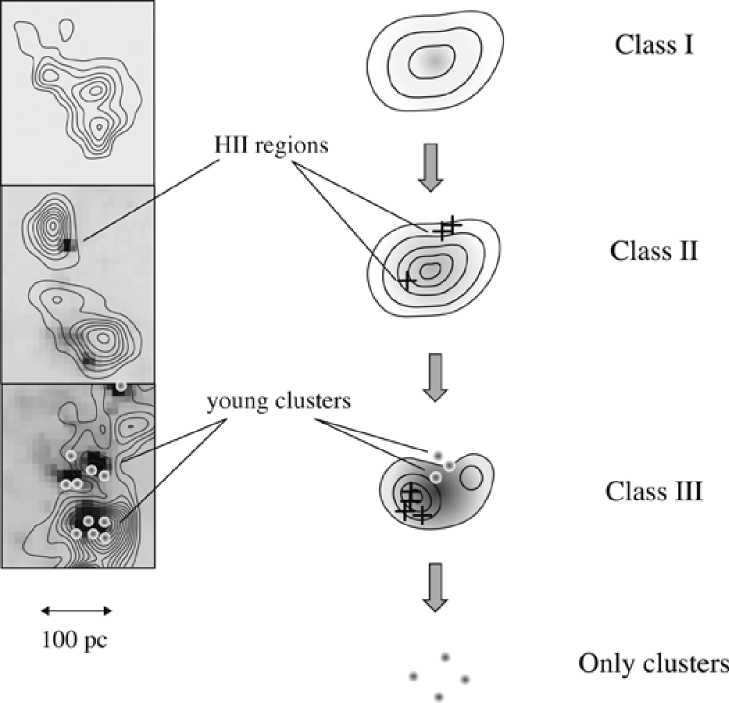
The NANTEN CO survey of the LMC has revealed that there are three classes of GMCs according to the association of young objects (Fukui et al. 1999; Yamaguchi et al. 2001b; Figure 1). Class I has no apparent sign of star formation and Class II is associated with small HII region(s) only but without stellar clusters. Class III is most actively forming stars as shown by huge HII regions and young stellar clusters. This classification was presented by Fukui et al. (1999) based on the first results of the NANTEN survey (see also Mizuno et al. 2001; Yamaguchi et al. 2001b). The basic scheme of the classification remains valid in the subsequent sensitive survey with NANTEN while the number of GMCs in each class has been increased by a factor of three (Fukui et al. 2001; Fukui et al. 2006; see also Blitz et al. 2006). These Classes are interpreted as indication of the evolutionary sequence from I to III and the life time of a GMC is estimated to be a few 10 Myrs in total (Fukui et al. 1999). A comparison of physical parameters indicates that size and mass tend to increase from Class I to Class III, and Class III GMC has the largest size and mass among the three. The stage after Class III is perhaps a very violent dissipation of GMCs due to UV photons and stellar winds from formed clusters as seen in the region of 30Dor most spectacularly. More details on this classification are discussed elsewhere in these proceedings (Kawamura et al. 2006).
3 HI vs. CO
3.1 3-D correlation
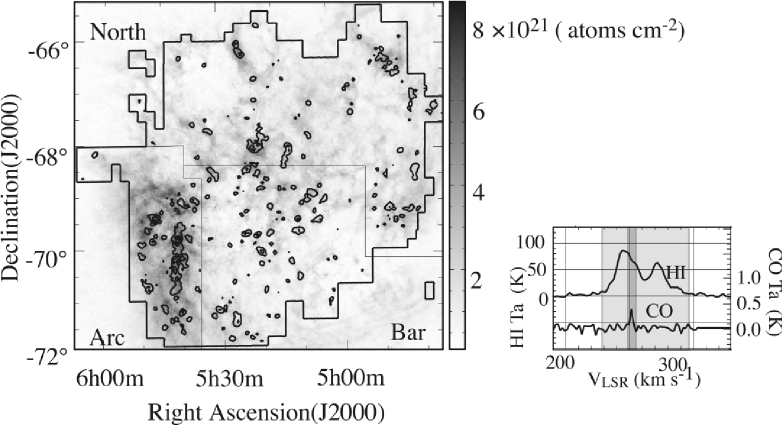
Previous studies of star formation in galaxies employed 2-D (2 dimensional) projection of HI intensity at large spatial averaging over 100 pc – 1 kpc (e.g., Schmidt 1972 ). We shall here test a 3-D (3 dimensional) comparison of CO and HI in the LMC where the 3-D datacube has a velocity axis in addition to the two axes in the sky. We use the 3-D datacube of CO with NANTEN (Fukui et al. 2006) and of HI with ATCA (Kim et al. 2003), where CO traces GMCs and HI less dense atomic gas.
Figure 2 shows an overlay of CO and HI and represents that GMCs are located often towards HI filaments. This shows that the CO emission is certainly located towards HI peaks while there are also many HI peaks or filaments without CO emission,
suggesting that HI is the placental site of GMC formation (Blitz et al. 2006). We should note that this overlay is of the integrated intensities along the line of sight in velocity space. Figure 2 shows typical CO and HI profiles in the LMC, indicating that the CO emission is highly localized in velocity; the HI emission ranges over 70 km s-1 while the CO emission has a width less than 10 km s-1. The large velocity dispersion of HI is most likely due to physically unrelated velocity components in the line of sight and the HI gas associated with the CO gas is a small fraction of HI whose velocity is close to that of CO. Previous studies to correlate HI and CO using such velocity integrated 2-D data obviously overestimates the HI intensity.
The present 3-D analysis is able to pick up the HI gas physically connected to the molecular clouds. Accordingly, we expect it reveals the exact connection of the ambient atomic gas to the dense molecular gas. The present HI and CO datasets have a pixel size of 40 pc 40 pc 1.7 km s-1 and consist of 2million pixels. The HI and CO intensities are expressed as averaged (K) in a pixel with the lowest value, the 3 noise level, in each.
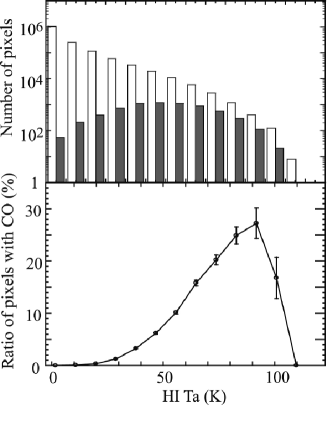
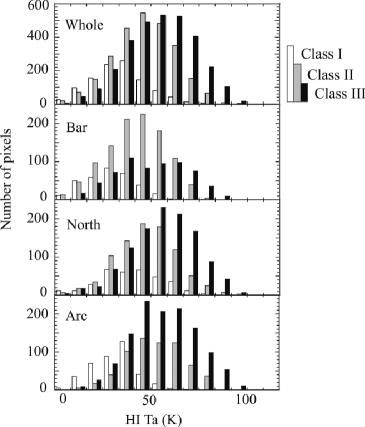
Figure 3 shows a histogram of the HI integrated intensity in 3-D and the pixels with the significant CO emission (greater than 0.7 K km s-1) are marked. This histogram shows that the CO fraction increases steadily with the HI intensity, suggesting the HI provides a necessary condition to form GMCs. About one third of the pixels exhibit CO emission near (HI) of K and it seems that there is no sharp threshold value for GMC formation with respect to the HI intensity.
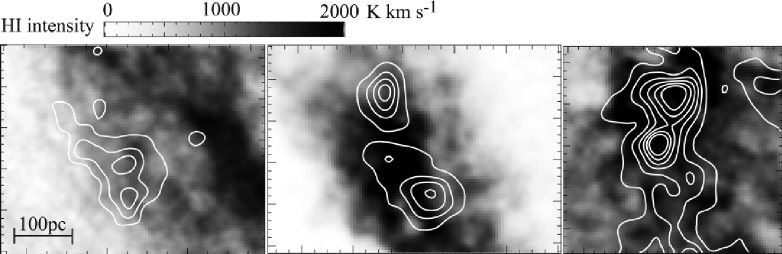
Figure 4 shows a histogram of the HI intensity for the three GMC Classes. This clearly shows that the HI intensity tends to increase from Class I to Class III while the dispersion is not so small. The average HI intensity over the whole LMC is 34 16 K, 47 17 K and 56 19 K for Class I, II and III, respectively. The HI intensity surrounding GMCs becomes greater with the GMC evolution and star formation. In order to test the variation within the galaxy, we shall divide the galaxy into three regions, i.e., Bar, North and Arc (see the left panel of Figure 2). Histograms for each shown in the lower three panels of Figure 4 again indicate the same trend.
Three images in Figure 5 show the HI distribution associated with GMCs of the three Classes. The CO distribution has detailed structures of pc or less and the HI seems to be associated with the GMC at a scale of 50–100 pc. The HI is not always isotropic with respect to a GMC but indicates close spatial correlations so that the HI is more or less enveloping a GMC. The typical HI velocity width associated is estimated to be 10–14 km s-1, and beyond this velocity span the associated HI peaks generally becomes much weaker or disappear.
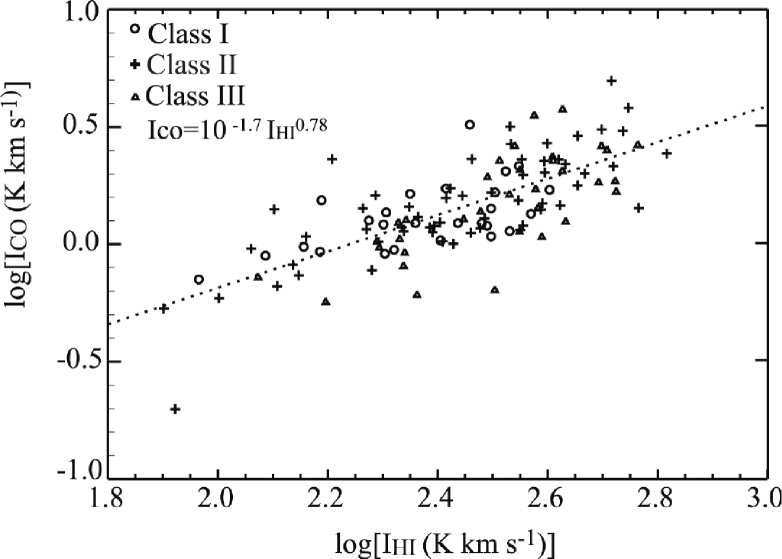
We have chosen 110 GMCs with five or more pixels in the two axes in the sky and estimated in the velocity range where CO is detected. Then we divide the by the apparent size of a GMC. This gives an average CO intensity. For each GMC we chose the pixels where the CO emission is significantly detected and tested HI and CO correlation (Figure 6), where only the HI pixels with CO are counted. The regression shown in Figure 6 is well fitted by a power law with a negative index of 0.8, indicating a nearly linear correlation between CO and HI in a GMC. We shall note that this index should become larger as 1.5 if we use 2-D correlation because the velocity integrated HI intensity has large offsets unrelated with CO.
3.2 Dressed GMCs; Growth of GMCs via HI Accretion
The dependence of HI intensity on Class of GMC indicates that the surroundings of a GMC change appreciably depending on the Class at a time scale of 40–100pc. The HI intensity is generally a product of the spin temperature and the optical depth, and the correlation indicates temperature and/or density is dependent on Class. The spin temperature of HI is generally estimated to be 100 K in the Milky Way. Since the HI spin temperature may be higher in the LMC where UV is more intense and dust opacity is less than in the Milky Way. The typical HI intensity less than 100 K suggests that the HI emission is optically thin. If so, the HI intensity should represent HI density. We therefore infer that GMCs are “dressed” in HI and that the “HI dress” grows in time.
The correlation between HI and CO is nearly linear (Figure 6). This alone does not provide a strong constraint on the formation of a GMC. Nonetheless, the apparent association of HI with GMCs suggests that the HI is enveloping each GMC and the HI density increases with the cloud evolution. We infer that this represents the enveloping HI gas is accreting onto GMCs and is converted into H2 due to increased optical depth. This leads to increase the molecular mass of GMC, i.e., the observed mass increase from Class I to III (see section 2). The timescale of the GMC evolution is 10 Myrs and the increased molecular mass is in the order of . Namely, a mass accretion rate of yr-1 is required. We roughly estimate that this rate is consistent with that calculated for a spherical accretion of the HI gas having (HI) cm-3 at an infall speed of 7 km s-1.
4 Stellar Gravity and Triggering in GMC Formation
We shall examine two effects which may be important in converting HI to H2: one is the stellar gravity and the other supershells driven by OB stars and/or SNRs.
4.1 Stellar gravity
We shall here use the K-band image of 2MASS which represents relatively old stellar population dominating the gravity (Sergei et al. 2000). This will allow us to test the effects of stellar gravity on GMC formation. The young stars associated with GMCs are small in mass and are not important in such gravity.
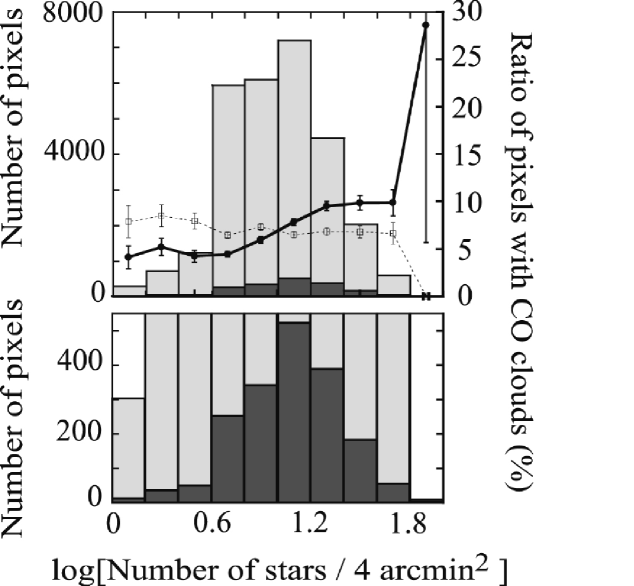
Figure 7 shows a histogram of CO clouds vs. K-band stellar density. We find that the number density of CO clouds increases with the increase of the stellar density. It seems that there is a threshold value at in log (number of stars/4 arcmin2) for the HI - H2 conversion where the number density of CO clouds increases beyond % of the pixel number.
Wong and Blitz (2002) argue that the pressure exerted on HI gas may play a role in converting HI to H2. They studied several spiral galaxies to show that the HI gas is associated with CO only in the inner part of galaxies where the stellar gravity is strong. The pressure should be basically dominated by the stellar gravity as long as the stars are the dominant source of gravity and the present result on the LMC supports that the pressure plays a role in converting HI into H2.
4.2 SAGE Results
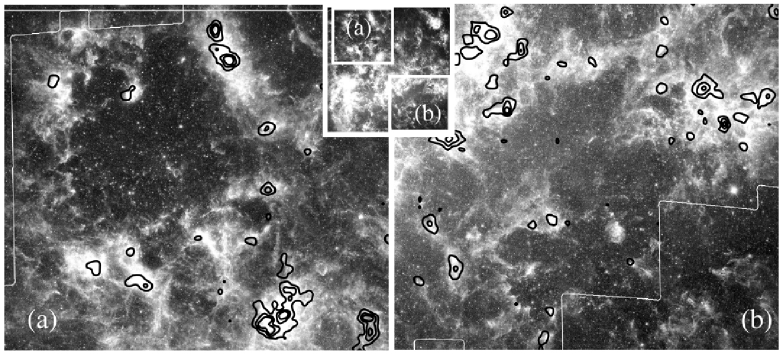
The Spitzer satellite has been used to make an extensive study of the LMC at infrared wavelengths from 3.6–160m. This is the SAGE project headed by M. Meixner. Figure 8 shows the 3.6–24 m 3-color composite image (3.6m, 8.0m and 24m in blue, gree, and red) from the SAGE project (NASA/Caltech-JPL/Meixner STScI and the SAGE Legacy Team) with NANTEN CO distribution (Fukui et al. 2006). This presents that CO clouds are well correlated the far-infrared distribution and future comparisons should reveal considerable details of the dust-gas relationship quantitatively.
In connection with the GMC formation, we note that the SAGE image indicates numerous good candidates for apparently swept-up matter perhaps by supershells owing to the better angular resolution. Yamaguchi et al. (2001a) made a comparison between H supershells and CO and concluded that of the GMCs may be associated with supergiant shells. Since more candidates may be identified from the SAGE image, triggering of GMC formation by supershells may be more important than previously thought by Yamaguchi et al. (2001a).
5 Summary
I shall summarize this contribution as follows;
1) 3-D comparison between CO and HI has revealed GMCs are associated with HI gas at a 40pc scale; these are “HI dressed GMCs”.
2) There is a clear increase of the HI intensity around GMCs from GMC Class I to Class III. Growth of GMCs in mass via HI accretion has been suggested over a time scale of a few 10 Myrs.
3) This correlation has a form, [CO intensity] [HI intensity]0.8, for selectec 110 major GMCs.
4) The background stellar gravity and dynamical compression by supershells may be important in converting HI into H2, i.e. in GMC formation.
Acknowledgements.
The NANTEN project is based on a mutual agreement between Nagoya University and the Carnegie Institution of Washington. We greatly appreciate the hospitality of all the staff members of the Las Campanas Observatory. We, NANTEN team, are thankful to many Japanese public donors and companies who contributed to the realization of the project. We would like to acknowledge Drs. L. Staveley-Smith and S. Kim for the kind use of their HI data. We are also thankful to IRAC and MIPS pipeline team to create a beautiful images of the LMC by Spitzer. This work is financially supported in part by a Grant-in-Aid for Scientific Research from the Ministry of Education, Culture, Sports, Science and Technology of Japan (No. 15071203) and from JSPS (No. 14102003, core-to-core program 17004 and No. 18684003).References
- [Blitz et al 2006 in PPV] Blitz, L., Fukui, Y., Kawamura, A. Leroy, A., Mizuno, N.,& Rosolowsky, E. 2006 in: B. Reipurth, D. Jewitt & K. Keil (eds.), Protostars and Planets V (Tucson: Univ. of Arizona) in press
- [Fukui et al. 1999] Fukui, Y., Mizuno, N., Yamaguchi, R., Mizuno, A., Onishi, T., Ogawa, H., Yonekura, Y., Kawamura, A., et al. 1999, PASJ, 51, 745
- [Fukui et al. 2001] Fukui, Y., Mizuno, N., Yamaguchi, R., Mizuno, A., & Onishi, T. 2001, textitPASJ, 53, L41
- [Fukui et al. 2006] Fukui, Y., Kawamura, A., Minamidani, T., Mizuno, Y., Kanai, Y., Onishi, T., Mizuno, N., Yonekura, Y., Mizuno, A., & Ogawa,H. 2006, ApJ, submitted
- [Kawamura] Kawamura, A. et al. 2006, in these proceedings
- [Kim et al. 1999] Kim, S., Dopita, M. A., Staveley-Smith, L., & Bessell, M. S. 1999, AJ, 118, 2797
- [Kim et al. 2003] Kim, S., Staveley-Smith, L., Dopita, M. A., Sault, R. J., Freeman, K. C., Lee, Y., & Chu, Y.-H. 2003, APJS, 148, 473
- [Meixner] Meixner, M. et al. 2006, AJ in press
- [Mizuno et al. 2001] Mizuno, N., Yamaguchi, R., Mizuno, A., Rubio, M., Abe, R., Saito, H., Onishi, T., Yonekura, Y., Yamaguchi, N., Ogawa, H., & Fukui, Y. 2001, textitPASJ, 53, 971
- [Nikolaev] Nikolaev, S. & Weinberg, M. D. 2000, ApJ,542,804
- [e.g., Schmidt 1972] Schmidt,Th. 1972,Astr.Ap., 16, 95
- [Wong & Blitz (2002)] Wong, T. & Blitz, L. 2002, ApJ, 569, 157
- [y1] Yamaguchi, R., Mizuno, N., Onishi, T., Mizuno, A., & Fukui, Y. 2001a, PASJ, 53, 959
- [y1] Yamaguchi, R., Mizuno, N., Mizuno, A., Rubio, M., Abe, R., Saito, H., Moriguchi, Y., Matsunaga, K., Onishi, T., Yonekura, Y., & Fukui, Y. 2001b, PASJ, 53, 985