Discovery of 21cm absorption in a DLA towards TXS 0311+430: The first low spin temperature absorber at .
Abstract
We report the detection of H i 21 cm absorption from the damped Lyman- system (DLA) towards TXS 0311+430, with the Green Bank Telescope. The 21 cm absorption has a velocity spread (between nulls) of km s-1 and an integrated optical depth of km s-1. We also present new Giant Metrewave Radio Telescope 602 MHz imaging of the radio continuum. TXS 0311+430 is unresolved at this frequency, indicating that the covering factor of the DLA is likely to be high. Combining the integrated optical depth with the DLA H i column density of N(H i) = cm-2, yields a spin temperature of K, assuming a covering factor of unity. This is the first case of a low spin temperature ( K) in a DLA and is among the lowest ever measured in any DLA. Indeed, the measured for this DLA is similar to values measured in the Milky Way and local disk galaxies. We also determine a lower limit (Si/H) solar for the DLA metallicity, amongst the highest abundances measured in DLAs at any redshift. Based on low redshift correlations, the low , large 21 cm absorption width and high metallicity all suggest that the DLA is likely to arise in a massive, luminous disk galaxy.
keywords:
galaxies: high-redshift – galaxies: ISM – radio lines: galaxies.1 Introduction
Damped Lyman- systems (DLAs) are the highest column density absorbers seen along QSO lines-of-sight, with neutral hydrogen column densities N(H i) cm-2. They have long been identified as the precursors of today’s galaxies and the primary gas reservoir for star formation at high redshifts. Despite the recognised importance of the absorbers, their typical size, structure and internal physical conditions remain issues of controversy (e.g. Wolfe et al. 2005). For example, DLA metallicities, now measured in over 100 absorbers, show very little evolution between and , with low-metallicity ( [Z/H] , where Z Zn, S or Si111In the usual notation, [Z/H] log(N(Z)/N(H i))log(N(Z)/N (H i))⊙. We use solar values from Lodders (2003).) absorbers the norm at all redshifts (e.g. Kulkarni et al. 2005). This lack of metallicity evolution runs contrary to expectations that the interstellar metallicity should rise towards lower redshifts if DLAs trace the bulk of gas in galaxies. Moreover, only a few tens of DLAs have their galactic counterparts identified, of which only a small fraction have been spectroscopically confirmed (e.g. Chen & Lanzetta 2003). Our understanding of the basic physical properties of the absorbing galaxies, such as their mass, size, star formation rates and luminosity, remains very limited.
H i 21 cm absorption studies of DLAs towards radio-loud quasars provide an independent probe of physical conditions in the absorbers. They can be combined with optical measurements of the H i column density of the DLA (from the Lyman- line) to obtain the column-density-weighted harmonic mean spin temperature of the absorbing gas, allowing one to determine the temperature distribution of the H i along the line of sight. Measurements of in a large number of DLAs may ultimately be used to infer other galactic properties of high redshift systems. For example, in the local Universe, large spiral disks like the Milky Way and M31 typically have low values ( K; Braun & Walterbos 1992) while high values ( K; Young & Lo 1997) are more common in dwarf galaxies. Tentative evidence for a similar trend has been found in low DLAs, out to (Kanekar & Chengalur, 2003). If such correlations hold for DLAs at all redshifts, measurements of , and its evolution, would provide interesting insights into galaxy evolution.
Unfortunately, despite a number of searches over the past two and a half decades (e.g. Briggs & Wolfe 1983; Carilli et al. 1996; Chengalur & Kanekar 2000; Kanekar & Chengalur 2003), spin temperature estimates are available for only DLAs (of which are lower limits) at (Kanekar et al, in preparation). All of these previous high measurements yield high spin temperatures of K. There are a number of reasons why the crop of estimates has increased slowly over the last 25 years, including observational issues such as the frequency coverage of radio telecopes and widespread radio frequency interference (RFI) at the low frequencies ( GHz) of the redshifted 21 cm line. However, an additional important reason for the relatively-small present 21 cm absorption sample is simply the dearth of known DLAs towards radio-loud QSOs suitable for 21 cm absorption follow-up. We have hence been conducting an optical survey of low-frequency-selected radio-loud quasars, specifically designed to increase the number of estimates in the redshift range . While the survey is still in progress, we report here its first results, the detection of 21 cm absorption from the DLA towards TXS 0311+430, the first case of a low spin temperature in a high- DLA.
2 Observations and data analysis
2.1 Optical observations
Optical observations of 50 QSOs selected from the Texas 365 MHz survey (Douglas et al., 1996) have been conducted at various facilities in order to identify DLAs suitable for 21 cm follow-up. As part of this campaign, we observed TXS 0311+430 (B=21.5, ) with the Gemini Multi-Object Spectrograph (GMOS) on the Gemini-North telescope. We obtained seven 2300-second and one 1700-second long-slit spectra of TXS 0311+430, with a 1.0 arcsecond slit and the B600_G5303 disperser. The central wavelength was set to 4590 Å for four of the exposures and to 4620 Å for the other four, so as to achieve continuous wavelength coverage despite the gap between CCD chips in the GMOS detector. The CCD was binned . The final spectrum has a resolution of 4.1 Å (full-width-at-half-maximum) and extends from to 6050 Å; this range allows the detection of DLAs in the redshift interval , with the upper limit set by the quasar redshift.
The GMOS data were reduced using standard IRAF routines including bias subtraction, flatfield correction, extraction using APALL, wavelength fitting [the root-mean-square (RMS) error on the wavelength fits was Å], and finally, vacuum and heliocentric velocity wavelength corrections; the full procedure for this and the other optical spectra of our survey will be described in York et al. (in preparation). The final signal-to-noise ratio (S/N) ranged from per pixel at 3600 Å to per pixel at 6000 Å. The GMOS observations resulted in the detection of a DLA at (see Section 3.1).
2.2 Radio observations
An initial search for 21 cm absorption at the DLA redshift was carried out with the PF1-450 MHz receiver of the Green Bank Telescope (GBT; program AGBT-06B-042) on September 12, 2006. We used the GBT Spectral Processor as the backend, with a bandwidth of 1.25 MHz centred at 431.808 MHz, two circular polarizations, 1024 spectral channels and a spectral resolution of km/s (before any smoothing). The data were taken in total power mode, with On/Off position-switching (with a 10-minute On/Off cycle made up of 2-second integrations) and online measurements of the system temperature using a noise diode. The total on-source time was minutes.
Weak absorption was detected at the expected redshifted 21cm frequency ( MHz) in the September run. We hence repeated the observations on October 20, 2006, and January 4, 2007, to confirm the feature. The same observational setup was used in these observing sessions, except for the use of linear instead of circular polarizations (as laboratory calibration information was not available for the circular polarizations; we will hence not further discuss the September data). The total on-source time on TXS 0311+430 was minutes and minutes in October and January, respectively. A calibrator, PKS B0316+162, was also observed during the October session, with the same setup, to test for RFI at the observing frequency. The calibrator was observed for a total of 25 on-source minutes, broken into two runs, alternating with two runs on TXS 0311+430.
The GBT data were analyzed in AIPS++ using the dish package of single-dish routines. After the initial data-editing, to remove scans with correlator problems and RFI, the data were calibrated (assuming a telescope gain of 2 K/Jy) and averaged together to measure the flux density of TXS 0311+430. This yielded flux densities of Jy in October and Jy in January, where the errors include those from confusing sources in the primary beam (note that Ficarra et al. 1985 measured Jy at 408 MHz). A second-order spectral baseline was then fit to RFI- and line-free channels for each 2-second spectrum (during calibration) and subtracted out. The residual 2-second spectra were then averaged together and Hanning-smoothed to obtain the final spectrum for each epoch. A similar procedure was followed to obtain the final spectrum towards PKS B0316+162, whose flux density was measured to be Jy in the October session. Intermittent low-level RFI was seen near the absorption frequencies in all three runs and careful data-editing was hence necessary, especially in the January data.
We also obtained a 602-MHz continuum image of TXS 0311+430 with the Giant Metrewave Radio Telescope (GMRT) in March 2007, to determine the spatial structure of the quasar radio emission and derive an estimate of the covering factor. The total on-source time was 1.5 hours, with a 16 MHz bandwidth centred at a frequency of 602 MHz and sub-divided into 128 channels. The standard calibrator 3C48 was used for flux density and bandpass calibration. These data were analysed in classic AIPS, using standard procedures (e.g. Kanekar et al. 2007).
3 Spectra and results
3.1 Lyman- and metals
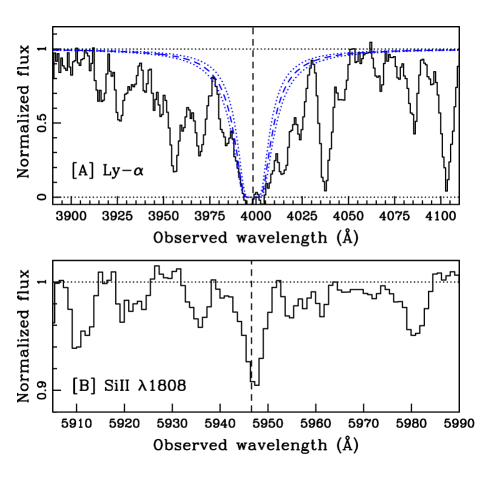
Damped Lyman- absorption is clearly visible in the GMOS spectrum towards TXS 0311+430, at . The Lyman- profile, shown in Fig. 1[A], yields an H i column density of N(H i) cm-2, derived by overlaying damped profiles using the Starlink dipso software. We quote a conservative error of 25%, to encompass the range of reasonable ‘by-eye’ profiles as well as systematic errors from the continuum fit. Next, although our spectral coverage was such that only a few metal lines associated with the DLA are outside the Lyman- forest, we were able to detect the Si ii 1526, Si ii 1808 and Al ii 1670 transitions at the DLA redshift; their equivalent widths are listed in Table 1 and the Si ii 1808 profile shown in Fig. 1[B]. Despite the low resolution of our spectrum ( km s-1), all three metal lines have resolved structure, indicating a large velocity width and multiple spectral components. Both the Al ii 1670 and Si ii 1526 lines are usually very strong and heavily saturated in DLAs and the high rest frame equivalent widths indicate that this is indeed the case for the absorber towards TXS 0311+430. Conversely, Si ii 1808 is often unsaturated in DLA spectra and can therefore be used to derive an abundance for silicon. However, in the present case, the high rest frame equivalent width of the Si ii 1808 line suggests that it too is likely to be saturated. Nonetheless, by assuming that the Si ii 1808 line is in the linear part of the curve of growth, it is possible to obtain a lower limit on the Si ii column density and hence, on the metallicity of the DLA. The Si ii column density is (Si ii) cm-2, giving [Si/H] . This is an unusually high metallicity among DLAs, including those in radio-selected QSOs (Akerman et al., 2005). Among the 104 DLAs at in the compilation by Prochaska et al. (2007), there are only three absorbers with higher values of the silicon abundance.
Our estimates of (Si ii), and hence [Si/H], may be lower limits, because we have assumed no line saturation and no depletion of Si onto dust grains. On the other hand, it is possible that we may have over-estimated the equivalent width of the Si ii absorption line through unrecognised blending with other features in our low resolution GMOS spectrum. The work of Herbert-Fort et al. (2006) —see, in particular, their Figure 5— shows that in low resolution spectra from the Sloan Digital Sky Survey this effect can lead one to overestimate (Si ii) by as much as a factor of three. Higher resolution spectra, and observations of other spectral lines such as Zn ii , should help resolve these ambiguities.
We also examined the GMOS spectrum for possible absorption at other redshifts and detected a strong Mg ii system at . The large rest frame equivalent widths of the Mg ii 2796,2803 doublet ( Å) and the Fe ii 2600 line ( Å) in this absorber (see Table 1) imply that it too is likely to be a DLA (Rao et al., 2006).
| Transition | EW (mÅ) | |
|---|---|---|
| Si ii 1526 | ||
| Al ii 1670 | ||
| Si ii 1808 | ||
| Fe ii 2344 | ||
| Fe ii 2374 | ||
| Fe ii 2382 | ||
| Fe ii 2586 | ||
| Fe ii 2600 | ||
| Mg ii 2796 | ||
| Mg ii 2803 | ||
| Mg i 2852 |
3.2 Radio spectroscopy and imaging

The final H i 21 cm spectra from the October and January observing sessions are shown in panels [A] and [B] of Figure 2, with the vertical shaded region in each panel marking a frequency range that was affected by regular RFI in both runs. The RMS noise values are mJy and mJy per 1.7 km s-1 channel in October and January, respectively. A strong absorption feature is visible in both spectra between and MHz. No spectral features were seen in this frequency range in the October spectrum towards the calibrator PKS B0316+162 (not shown here), which has an RMS noise of mJy per 1.7 km s-1 channel. The absorption towards TXS 0311+430 also showed the expected doppler shift ( kHz) between the October and January runs. The lack of any absorption towards the calibrator source, combined with the expected doppler shift over a 3-month period, rule out RFI as a possible cause for the absorption seen towards TXS 0311+430.
Figure 2[C] shows the final GBT 21cm spectrum towards TXS 0311+430, obtained by averaging the spectra from October and January with appropriate weights (based on the RMS noise values), after scaling the January spectrum to a flux density of Jy. Regions affected by RFI in either spectrum have been blanked out (note that these are well-removed from the absorption feature and thus do not affect our optical depth measurement). The RMS noise on this spectrum is mJy per km s-1 channel. The 21 cm absorption is complex, extending over km s-1 (between nulls), with peak opacity at 431.765 MHz, i.e. at . The integrated optical depth is km s-1, with the error dominated by the uncertainty in the source flux density.
Figure 3 shows the GMRT 602 MHz continuum image of TXS 0311+430. The image has a resolution of (i.e. a spatial resolution of kpc2 at 222We use the standard CDM cosmology, with , and H km s-1 Mpc-1.) and an RMS noise of 0.6 mJy/Bm; no evidence for extended structure can be seen. A single elliptical Gaussian component provides a good fit, yielding an integrated flux density of Jy and a deconvolved angular size of ; this gives a spatial extent of kpc2 at . Of course, this estimate of the source size should be treated as an upper limit, because any residual phase errors will increase the observed size. Further, while the continuum image is at a somewhat different frequency from the redshifted 21 cm line, the lack of any detected extended emission suggests that the quasar is also very compact at the latter frequency.

3.3 The Spin Temperature
For 21 cm absorption studies of DLAs towards radio-loud QSOs, the 21 cm optical depth, H i column density N(H i) and spin temperature are related by the expression
| (1) |
where N(H i) is in cm-2, in K, d in km s-1 and the 21 cm absorption is assumed to be optically thin. In the case of multiple H i clouds along the line of sight, is the column-density-weighted harmonic mean of the spin temperatures of the individual clouds. Note that the use of the above equation to estimate the spin temperature of the DLA implicitly assumes that the H i column densities along the optical and the (usually more extended) radio lines of sight are the same. The covering factor gives the fraction of the radio flux density covered by the foreground DLA; this can be estimated by very long baseline interferometric (VLBI) observations at or near the redshifted 21cm line frequency, to measure the fraction of flux density arising from the compact radio core, as well as its spatial extent (e.g. Kanekar et al. 2007).
The DLA towards TXS 0311+430 has an H i column density N(H i) cm-2 and an integrated 21 cm optical depth of km/s. No VLBI measurements are available in the literature at any radio frequency. However, the sub-arcsecond size estimate from the GMRT 602 MHz image indicates that the quasar is strongly core-dominated and suggests a high covering factor, . Using this, we obtain K, one of the lowest spin temperatures ever found in a DLA and the only low value currently known at .
4 Discussion
Spin temperature estimates have so far been obtained in more than thirty DLAs at all redshifts, including fifteen detections of 21 cm absorption (Kanekar et al, in preparation). Only four absorbers, all at , show low spin temperatures, K, typical of lines of sight through the Milky Way and local disks (Kanekar & Chengalur, 2003)333Note that this does not include the DLA towards 3C336 (Curran et al., 2007), where the background radio source is strongly lobe-dominated, with a very small core fraction. The very extended radio structure (corresponding to a spatial extent of kpc at ) implies that the radio and optical absorption almost certainly arise from very different lines of sight (a possibility discussed by Curran et al.). Another eleven systems, all with K, have been detected in 21 cm absorption (of which only four are at ; Wolfe & Davis 1979; Wolfe & Briggs 1981; Kanekar et al. 2006; Kanekar et al. 2007) while the remaining DLAs without detectable 21 cm absorption all have lower limits of K on the spin temperature.
The preponderance of high spin temperature estimates in high- DLAs has usually been attributed to a relatively low fraction of the cold neutral phase of H i (the CNM), with most of the gas in the warm phase (the WNM) (e.g. Carilli et al. 1996; Chengalur & Kanekar 2000). This assumes that the absorbers have a similar two-phase structure to that seen in the ISM of the Milky Way (e.g. Wolfe et al. 2003). The low spin temperature of the DLA towards TXS 0311+430 would then imply that a higher fraction of the H i along the line of sight is in the CNM compared with the majority of DLAs at . Chengalur & Kanekar (2000) argued that the high derived values of high- DLAs could be due to the low metallicities of typical high- DLAs, with the paucity of metals resulting in fewer radiation pathways for gas cooling (see also Young & Lo 1997). If this is correct, one would expect DLAs with low spin temperatures (such as the absorber towards TXS 0311+430) to have significantly higher metallicities than those of the general DLA population (Kanekar & Chengalur, 2001). As expected, and assuming that the Si ii equivalent width has not been over-estimated, the DLA has [Si/H] , one of most metal-rich DLAs yet discovered.
It has also been suggested that the observed low 21 cm optical depth in high- DLAs arises due to covering factor effects (e.g. Curran et al. 2005). In the present case, any reduction in the covering factor below the assumed value of unity can only strengthen the case for a low spin temperature (since K). The only way to alter the conclusion that a sizeable fraction of H i along the line of sight is in the cold phase is if there are large spatial differences in the H i column densities along the optical and radio lines of sight (e.g. Wolfe et al. 2003). For example, if the optical QSO lies behind a “hole” in the H i column density distribution, the average H i column density against the radio QSO could be larger than that measured from the Lyman- line, implying a higher spin temperature from Eqn. 1. Unfortunately, it is very difficult to directly test this possibility. While Galactic H i column densities derived from Lyman- absorption studies are in excellent agreement with those obtained from H i 21 cm emission observations in the same directions, despite the very different spatial resolutions in the two methods, such comparisons have only been carried out for a fairly small number of high latitude lines of sight (Dickey & Lockman, 1990). A similar comparison between N(H i) values derived from Lyman- absorption and 21 cm emission has only been possible in one DLA, the absorber towards SBS 1543+593. Here, the H i column densities agree to within a factor of , despite the extremely poor spatial resolution ( kpc) of the radio observations (Chengalur & Kanekar, 2002). While both of these studies suggest that the N(H i) values along the radio and optical lines of sight are likely to be comparable, we cannot formally rule out the possibility of differences in an individual absorber. However, the fact that the expected high metallicity is indeed seen in the DLA (assuming that our Si ii 1808 measurement is accurate) is consistent with the interpretation of a high CNM fraction.
Finally, Kanekar & Chengalur (2003) noted a relationship between spin temperature and absorber morphology, in that, at low redshifts, low values are only found in DLAs identified with luminous disk galaxies, while low-, low-luminosity DLAs, associated with dwarf or LSB galaxies, are all found to have high spin temperatures ( K). It has not been possible to test this empirical relationship at , as the host galaxies of high- DLAs are rarely detectable. However, if the relationship does extend out to high redshifts, we would expect the DLA to be a massive, luminous disk galaxy. We note that both the high metallicity and the large velocity spreads seen in the optical low-ionization metal lines and the 21cm absorption are consistent with the absorption arising in a massive galaxy. If so, it should be possible to detect the absorber host with deep imaging; this would be the first direct test of the -morphology relationship at high redshifts.
In summary, we have detected damped Lyman- and H i 21 cm absorption at towards the quasar TXS 0311+430. We obtain a DLA spin temperature of K, the first case of a low spin temperature estimate in a high redshift DLA. The low spin temperature, high metallicity and large velocity spread of the 21 cm and metal lines all suggest that the absorber is likely to be a massive disk galaxy.
5 Acknowledgments
We thank Carl Bignell and Bob Garwood for much help with the GBT observations and AIPS++ data analysis. The NRAO is operated by Associated Universities, Inc., under cooperative agreement with the NSF. We thank the staff of the GMRT who made these observations possible; the GMRT is run by NCRA-TIFR. Based on observations obtained at the Gemini Observatory (program ID GN-2005B-Q-60), which is operated by the AURA, Inc., under a cooperative agreement with the NSF on behalf of the Gemini partnership: the NSF (United States), the STFC (United Kingdom), the NRC (Canada), CONICYT (Chile), the ARC (Australia), CNPq (Brazil) and CONICET (Argentina). BY was supported in part by a grant from the NSERC (Canada).
References
- Akerman et al. (2005) Akerman C. J., Ellison S. L., Pettini M., Steidel C. C., 2005, A&A, 440, 499
- Braun & Walterbos (1992) Braun R., Walterbos R., 1992, ApJ, 386, 120
- Briggs & Wolfe (1983) Briggs F. H., Wolfe A. M., 1983, ApJ, 268, 76
- Carilli et al. (1996) Carilli C. L., Lane W. M., de Bruyn A. G., Braun R., Miley G. K., 1996, AJ, 111, 1830
- Chen & Lanzetta (2003) Chen H.-W., Lanzetta K. M., 2003, ApJ, 597, 706
- Chengalur & Kanekar (2000) Chengalur J. N., Kanekar N., 2000, MNRAS, 318, 303
- Chengalur & Kanekar (2002) Chengalur J. N., Kanekar N., 2002, A&A, 388, 383
- Curran et al. (2005) Curran S. J., Murphy M. T., Pihlström Y. M., Webb J. K., Purcell C. R., 2005, MNRAS, 356, 1509
- Curran et al. (2007) Curran S. J., Tzanavaris P., Murphy M. T., Webb J. K., Pihlstroem Y. M., 2007, MNRAS, in press (astro-ph/0706.2692), 706
- Dickey & Lockman (1990) Dickey J. M., Lockman F. J., 1990, ARA&A, 28, 215
- Douglas et al. (1996) Douglas J. N., Bash F. N., Bozyan F. A., Torrence G. W., Wolfe C., 1996, AJ, 111, 1945
- Ficarra et al. (1985) Ficarra A., Grueff G., Tomassetti G., 1985, A&AS, 59, 255
- Herbert-Fort et al. (2006) Herbert-Fort S., Prochaska J. X., Dessauges-Zavadsky M., Ellison S. L., Howk J. C., Wolfe A. M., Prochter G. E., 2006, PASP, 118, 1077
- Kanekar & Chengalur (2001) Kanekar N., Chengalur J. N., 2001, A&A, 369, 42
- Kanekar & Chengalur (2003) Kanekar N., Chengalur J. N., 2003, A&A, 399, 857
- Kanekar et al. (2007) Kanekar N., Chengalur J. N., Lane W. M., 2007, MNRAS, 375, 1528
- Kanekar et al. (2006) Kanekar N., Subrahmanyan R., Ellison S. L., Lane W. M., Chengalur J. N., 2006, MNRAS, 370, L46
- Kulkarni et al. (2005) Kulkarni V. P., Fall S. M., Lauroesch J. T., York D. G., Welty D. E., Khare P., Truran J. W., 2005, ApJ, 618, 68
- Lodders (2003) Lodders K., 2003, ApJ, 591, 1220
- Prochaska et al. (2007) Prochaska J. X., Wolfe A. M., Howk J. C., Gawiser E., Burles S. M., Cooke J., 2007, ApJS, 171, 29
- Rao et al. (2006) Rao S. M., Turnshek D. A., Nestor D. B., 2006, ApJ, 636, 610
- Wolfe & Briggs (1981) Wolfe A. M., Briggs F. H., 1981, ApJ, 248, 460
- Wolfe & Davis (1979) Wolfe A. M., Davis M. M., 1979, AJ, 84, 699
- Wolfe et al. (2003) Wolfe A. M., Gawiser E., Prochaska J. X., 2003, ApJ, 593, 235
- Wolfe et al. (2005) Wolfe A. M., Gawiser E., Prochaska J. X., 2005, ARA&A, 43, 861
- Young & Lo (1997) Young L. M., Lo K. Y., 1997, ApJ, 490, 710