Large nonlinear absorption and refraction coefficients of carbon nanotubes estimated from femtosecond z-scan measurements
Abstract
Nonlinear transmission of and femtosecond pulsed light with wavelength through single walled carbon nanotubes suspended in water containing sodium dodecyl sulphate is studied. Pulse-width independent saturation absorption and negative cubic nonlinearity are observed, respectively, in open and closed aperture z-scan experiments. The theoretical expressions derived to analyze the z-dependent transmission in the saturable limit require two photon absorption coefficient and a nonlinear index to fit the data.
(Accepted and to appear in Applied Physics Letters)
pacs:
78.67.ch, 42.65.k, 42.70.Nq, 78.20.CiSingle walled carbon nanotubes (SWNTs) have been studied for numerous applications including third order optical nonlinearity. These applications include nanoelectronics, gas and bio sensors, field emission displays, saturable absorbers for passive optical regeneration, mode-locking and THz optical switching. The suspended carbon nanotubes show optical limiting due to nonlinear scattering, micro-plasma formation and sublimation in the nanosecond regime.Chen ; Liu ; sood ; Vivien ; Sun In the femtosecond () regime where heating does not play a role in the nonlinear transmission, an enormously large third-order susceptibility has been reported by resonantly exciting at the first inter sub-band energy levels () of semiconducting SWNTs.Maeda ; achiba The origin of this large nonlinearity is assigned to the coherence effect, rather than the incoherent or saturable absorption, because the measured nonlinearity decreased rapidly when the wavelength is changed away from the first band gap.Maeda This interpretation for the large nonlinearity is being debated.Sheng ; Okamoto Other experimentsAjayan ; Tatsuura using fs pulses have reported a mixed variation with wavelength-much smaller valueAjayan for Im esu at and a fairly large valueTatsuura of at . The origin of the nonlinearity had not been identified. In this letter we report the results of closed aperture (CA) and open aperture (OA) z-scan measurements carried out in suspension of almost isolated SWNTs at a wavelength of (energy of ). The OA z-scan shows saturated absorption and CA z-scan reveals negative cubic nonlinear refraction. We have developed a theoretical model incorporating saturated absorption along with nonlinear absorption and refraction to derive the transmission in both the OA and CA z-scans. The theoretical analysis of our results obtained with two different pulses with full-width at half-maximum (FWHM) of and clearly identifies two photon absorption (TPA) as the source of nonlinearity and the TPA coefficient is . This translates to a fairly large value of for nonlinearity.
A dispersion of SWNTs () and of sodium dodecyl sulphate (SDS) in water () was sonicated for hours and the resultant solution was found to be well dispersed. This solution in path length quartz cell was used in our experiments. The SWNT sample used in our experiments is pristine and contains two diameter distributions at and as confirmed by the radial breathing Raman modes at and , shown in the inset of Fig. 1.

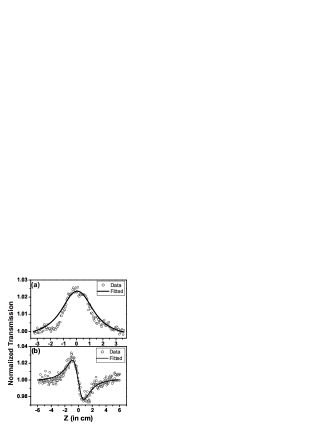
Nonlinear transmission studies were carried out at using Ti: Sapphire Regenerative femtosecond amplifier (Spitfire, Spectra Physics). The chosen photon energy is nearly resonant with the first interband transition energy in metallic tubes, and off-resonant with the second interband transition energy of the semiconducting tubes . From the absorption spectra of the dispersed nanotubes shown in Fig. 1, we infer that the absorption coefficient at this wavelength is about . The FWHM pulse width of the amplifier output was at a repetition rate of . Near the sample point, the pulse from the amplifier was found to be broadened to . For the experiments done with , we stretched pulse by adjusting the compressor of the amplifier. Two Si-PIN diodes (one for the signal () and the other for reference ()) triggered at the electronic clock output () from the amplifier are used for the data acquisition and the difference between and was collected using a lock-in amplifier (SRS 830), averaged over 300 shots. This difference data was then converted into actual signal in a personal computer. The SWNT dispersion in thick cuvette was translated using a motorized translation stage (XPS Motion controller, Newport) over the focal region. The intensity of input beam was varied from to . In the OA z-scan, all the light was collected by using a collection lens in front of the diode. The measured (and normalized) transmission data as shown in Fig. 2(a) clearly demonstrates the saturable absorption where the transmission is enhanced at focus (). For CA z-scan, we kept an aperture of diameter in front of the diode and the measured transmission (and normalized) data as shown in Fig. 2(b) indicates photo-carrier induced reduction in the refractive index.
The procedure to calculate the transmission in z-scan experiments has been well describedSB ; Wearie ; Chapple ; Yin in the literature. For the optical limiting case, fairly accurate solutions have been used to explain the z-scan results.SB ; Wearie ; Chapple ; Yin However, for the saturation absorption case, the solutions are obtained either qualitatively Gao or in the limit where the intensity is far smaller than the saturation intensity.Yang To quantify the basic mechanisms responsible for the nonlinear absorption and refraction, we accurately solve the rate equation, but modifiedSamoc for saturation absorption:
| (1) |
where is the one photon absorption (including intrinsic free carrier absorption) coefficient, , is the fundamental TPA coefficient, and is free carrier absorption (FCA) cross section. is the parameter that characterizes the saturation absorption. The intensity () at the radial position , time , the position in the sample, and the location of the sample is denoted as . The generated photo-carrier density depends on both and . In our experiment, the maximum value of is and is . Even with a large value for , the dominant source of carrier generation is one photon absorption. Since the carrier decay time is much longer than the pulse width , Eq. 1 takes the form:
| (2) |
where
| (3) |
The boundary condition required to solve Eq. 2 is the input intensity which is assumed to be a Gaussian and
| (4) |
is the beam waist at the focus, is the beam radius at , is the diffraction length of the beam, is the half width at of the maximum of the pulse, and is the wavelength. The intensity at the exit side of sample, is obtained from the analytical solutionGradshteyn to Eq. 2 and integrated over all and to calculate the transmitted energy. The transmission in the OA z-scan experiment, is simply the ratio of transmitted energy to the incident energy. The solution to Eq. 2 depends on two parameters and , which can be varied to fit the measured OA z-scan data. Since several sets of and can fit the data, we will choose appropriate set that fits CA data as well.
The transmission for CA case is more complicated as it requires the phase of electric field () in addition to the intensity at the exit surface.SB ; Chapple ; Yin The phase at is different from that at because of the change in refractive index, , caused by light absorption. To a first order in , the is simply , where is the cubic nonlinear index.
The cubic nonlinear refraction coefficient, , in general has contribution from the photo-generated carriers, temperature change, and bound electrons. Following the well established procedureSB , we calculate the electric field inside the sample. For thin samples where photo-carrier generation is uniform, the change in phase from incident to exit surface is , where k is the wavenumber and is the solution of Eq. 2. For a given r and t, the intensity at any inside the sample is obtained analytically, fitted to polynomial series in , and substituted for to get,
| (5) |
The electric field at the exit surface is then,
| (6) |
where is the radius of curvature of the wave-front at . As beforeSB , is expanded in infinite series and Gaussian decomposition methodWearie is used to obtain the field pattern at the aperture which is at a distance d away from the exit surface. In our calculations we found that the convergence is achieved with first four terms in the expansion. We get normalized z-scan transmittance, by integrating over all from to , and from to aperture radius , then dividing it by /2.
From the difference between the normalized peak and valley transmittance in CA z-scan experiment and aperture’s linear transmittance, value of can be calculatedSB . From our measured CA z-scan experiments (shown in Fig. 2(b)), we obtain a value of for . A simple calculationnote using the value of for () predictedYu in wide bandgap semiconductors also yields a value for . However our measured value for is about two orders less compared to the value predicted by Margulies et al for SWNTsMargulis1 . Using a value of for , we have then varied in the calculation of (z) to fit the data. We found that both OA and CA data can be fitted simultaneously with one set of parameters as shown by solid line in Fig. 2. With larger values of , a good fit to CA data could not be achieved for any value of (the same is true for OA data too). Although good fit is possible with much smaller , the required to fit CA differs considerably (by more than an order of magnitude) from that needed to fit OA data. A consistent set of parameters for , and respectively, , , and , fit both OA and CA data well as shown by solid lines in Fig. 2. As seen from Eq. 3, the has two contributions -TPA and FCA. Noting that the FCA contribution depends on the pulse width, we repeated both CA and OA z-scan with FWHM width of to evaluate the relative strength of these two contributing mechanisms. We found that z-scan data with pulse width is identical to that obtained with pulse width. This clearly indicates that FCA cross section is extremely small and the fundamental TPA () is the dominant mechanism for nonlinear absorption. The predicted value of for in CNTs is two-to-three orders of magnitude larger than that in wide band gap semiconductors at to wavelength. This large value of nonlinearity (both and ) arises mainly as the consequence of the one dimensional motion of delocalized-electron cloud along the nanotube axis.Margulis2 ; Lauret Although the large value of at the wavelength, where is also large, makes it less useful for optical limiting applications, the underlying mechanism responsible for could be operative even at the forbidden wavelength. With our increasing ability to tune the band gap with nanotubes’ radius, CNTs offer an interesting possibility for enhanced nonlinearity in near visible to short wave infrared wavelength region.
AKS thanks Department of Science and Technology, India for financial support and SK thanks the Indian Institute of Science for his two-month sabbatical visit.
References
- (1)
- (2) P. Chen, X. Wu, X. Sun, J. Lin, W. Ji, and K. L. Tan, Phys. Rev. Lett. 82, 2548 (1999).
- (3) X. Liu, J.Si, B. Chang, G. Xu, Q. Yang, Z. Pan, S. Xie and P.Ye, Appl. Phys. Lett. 74, 164 (2000).
- (4) S.R. Mishra, S.C Rawat,S.C Mehendale, K.C Rustagi, A.K. Sood, R. Bandyopadhyay, A. Govindaraj, C.N.R. Rao, Chem. Phys. Lett. 317, 510(2000).
- (5) L. Vivien, D. Riehl, P. Lancon, F. Hache, E. Anglaret, Opt. Lett. 26, 223(2001).
- (6) X. Sun, R. Q. Yu, G. Q. Xu, T. S. A. Hor, and W. Ji, Appl. Phys. Lett. 73, 3632(1998).
- (7) Maeda, S. Matsumoto, H. Kishida,T. Takenobu, Y. Iwasa, M. Shiraishi,M. Ata and H. Okamoto, et al., Phys. Rev. Lett. 94, 047404 (2005).
- (8) Y. Sakakibara, S. Tatsuurai,H. Katura, M. Tokumoto and Y. Achiba, Jpn. J. Appl. Phys. 42, 494 (2003).
- (9) C. -X. Sheng and Z.V. Vardeny, Phys. Rev. Lett. 96, 019705 (2005).
- (10) H. Okamoto, S. Matsumoto, A. maeda, Y. Kishida, Y. Iwasa, T. Takenobu, Phys. Rev. Lett, 96, 019706 (2006).
- (11) Y.C. Chen, N.R. Raravikar, L.S. Schadler, P. M. Ajayan, Y. P. Zhao, T.M. Lu, G.C. Wang and X.C. Zhang, Appl. Phys. Lett. 81, 975 (2002).
- (12) S. Tatsuura, M. Furuki, Y. Sato, I. Iwasa, M. Tian, and H. Mitsu, Adv. Mater. 15, 534 (2003).
- (13) M. Sheik-Bahae, A.A. Said, T.H. Wei, D.J. Hagen, E.W.Van Stryland, IEEE J.Quant.Electron. 26, 760 (1990).
- (14) D. Wearie, B. S. Wherrett, D. A. B. Miller and S. D. Smith, Opt. Lett. 4, 331 (1979).
- (15) P. B. Chapple, J. Staromlynska, J. A. Hermann and T. J. Mckay, J. Nonlin. Opt. Phys. and Mater. 6, 251 (1997).
- (16) M. Yin, H. P. Li, S. H. Tang, W. Ji, Appl. Phys. B 70, 587 (2000).
- (17) Y. Gao, X. Zhang, Y. Li, H. Liu, Y. Wang, Q. Chang, W. Jiao, Y. Song, Opt. Commun. 251, 429 (2005).
- (18) L. Yang, R.Dorsinville, Q.Z. Wang, P.X. Ye, R.R. Alfano, R. Zamboni and C. Taliani, Opt. Lett. 17, 323 (1992).
- (19) M. Samoc, A. Samoc, B. Luther-Davies, H. Reisch and U. Scherf, Opt. Lett. 16, 1295 (1998).
- (20) I. S. Gradshteyn and I. M. Ryzhik, ”Table of Integrals, Series, and Products”, (Acadamic Press Inc, California), pp 68-69 (1992).
- (21) The n arising from the photo generated carriers is N . Then is simply
- (22) Z. G. Yu, S. Krishnamurthy, S. Guha, J. Opt. Soc. Am. B 23, 2356 (2006)
- (23) 27. V1. A. Margulis and E. A. Gaiduk, J. Opt. A:Pure Appl. Opt. 3 , 267 (2001)
- (24) Vl. A. Margulis and T. A. Sizikova, Physica B 245, 173 (1998).
- (25) J-S. Lauret, C. Voisin, G. Cassabois, J. Tignon, C. Delalande, and Ph. Roussignol, O. Jost, L. Capes, Appl. Phys. Lett, 85, 3572 (2004).