An Imaging and Spectral Study of Ten X-Ray
Filaments around the Galactic Center
Abstract
We report the detection of 10 new X-ray filaments using the data from the Chandra X-ray satellite for the inner ( parsec) around the Galactic center (GC). All these X-ray filaments are characterized by non-thermal energy spectra, and most of them have point-like features at their heads that point inward. Fitted with the simple absorbed power-law model, the measured X-ray flux from an individual filament in the keV band is to ergs cm-2 s-1 and the absorption-corrected X-ray luminosity is ergs s-1 at a presumed distance of 8 kpc to the GC. We speculate the origin(s) of these filaments by morphologies and by comparing their X-ray images with the corresponding radio and infrared images. On the basis of combined information available, we suspect that these X-ray filaments might be pulsar wind nebulae (PWNe) associated with pulsars of age yr. The fact that most of the filament tails point outward may further suggest a high velocity wind blowing away form the GC.
1 Introduction
The Galactic center (GC) is the only place where we can observe parsec details of various interaction in and around the Galactic nucleus. Advances in this research frontier rely primarily on observations at radio, infrared and X-ray wavelengths, because the optical band suffers seriously from a considerable extinction with an (e.g., Becklin, Matthews, Neugebauer & Willner 1978). One of the most important discoveries in the GC region is perhaps the presence of many structured non-thermal radio filaments (NTFs) (e.g., Yusef-Zadeh, Morris, & Chance 1984; Morris & Serabyn 1996; LaRosa, Kassim, Lazio, & Hyman 2000). While these non-thermal radio filaments have been intensively studied, their origins and implications on the underlying physical processes around the GC region remain largely unclear. In the current analysis of X-ray filaments around the GC region, these X-ray emitting particles are usually expected to be fairly close to their acceleration zone and evolve very rapidly in time. Thus, the X-ray study of the same region would be essential to probe the origin of these energetic particles. The Chandra Galactic center Survey (CGS), with its unprecedented high spatial resolution of and moderate spectroscopy capability, has already revealed remarkable X-ray structures (including thousands of X-ray bright point sources and some filaments, as well as clumps of diffuse emission) within the central pc of our Galaxy (e.g., Wang, Lu, & Lang 2002a). In this paper, we mainly concentrate on the nature of those thread-like linear structures or filaments as observed in X-ray bands.
Up to this point within ( pc at 8 kpc) from Sgr A∗ where a black hole resides inside a compact region of less than AU (e.g., Shen et al. 2005), 5 X-ray filaments have been studied in details (see also Table 1). For example, G359.95-0.04, a comet-like filament at pc north of Sgr A∗, is thought to be a ram-pressure confined pulsar wind nebula (PWN) (Wang et al. 2006). Another prominent filament, G359.89-0.08 (SgrA-E), at pc southeast of Sgr A∗, was first noticed by Sakano et al. (2003) and an interpretation of a possible PWN origin was discussed in details by Lu, Wang & Lang (2003). An alternative picture of G359.89-0.08 as a source of synchrotron emission from relativistic particles accelerated by a shock wave of W28 SNR was suggested recently by Yusef-Zadeh et al. (2005); in that same paper, they also detected a new X-ray filament G359.90-0.06, which coincides spatially with a radio filament at pc southwest of Sgr A∗. They explored the mechanism of an inverse Compton scattering (ICS) for the X-ray emission of G359.90-0.06. Another 2 filaments were found in more extensive regions. G0.13-0.11 in the Radio Arc region was first reported by Wang, Lu & Lang (2003) and was suspected to be also a PWN. Of particular interest is the X-ray filament G359.54+0.18; it associates with only one strand of the obviously bifurcated radio threads (e.g., Yusef-Zadeh et al. 2005; Lu et al. 2003). A common feature shared in the X-ray energy spectra of these filaments is that they all appear to be non-thermal. It should be noted however that any thermal component to these sources would likely be completely absorbed and unobservable, given the high foreground column density.
In these earlier investigations, pulsar wind nebulae (PWNs) and supernova remnants (SNRs) seem to offer natural explanations for the appearance of such X-ray filaments. Indeed, it is believed that a considerable number of supernovae should have happened in the GC region (e.g., Figer et al. 1999, 2004; Wang et al. 2006). One would naturally expect to find some of their end-products such as pulsars and SNRs in the GC region. However, no radio pulsars have yet been found within of the GC (Wang et al. 2006). This might be caused by difficulties in radio observations (Cordes & Lazio 1997; Johnston et al. 2006). Seeking observational clues in X-ray bands might shed new light to the search for radio pulsars embedded in the GC region.
Another tempting idea is to use these X-ray filaments as potential tracers for the magnetic field and gas dynamics around the GC region, since the magnetic fields should have played a significant role in producing such non-thermal spectra and the thread-like shapes of these filaments and the gas motion is usually coupled with the magnetic fields. (e.g., Chevalier 1992; Boldyrev & Yusef-Zadeh 2006). Magnetic fields exist on all scales of the Galaxy as well as in other spiral galaxies and generally trace out spiral patterns on large scales (e.g., Beck & Hoernes 1996; Fan & Lou 1996; Zweibel & Heiles 1997; Wielebinski 2005; Ferriere 2001, 2007), and great progress has been made in measuring them and inferring their influence by various means. For example, the observed high-energy cosmic ray anisotropy at a few times (e.g., Amenomori et al. 2006) might be physically related to large-scale structures of Galactic magnetic fields and inhomogeneous cosmic ray source distribution. Using diffuse synchrotron radio emissions at 74 and 330 MHz frequencies produced by relativistic cosmic-ray electrons and the magnetic field around the Galactic center, LaRosa et al. (2005) inferred a weak magnetic field of order of G on size scales based on a minimum-energy analysis. This is about 2 orders of magnitude lower than mG usually estimated for the GC region. Very recently, Cowin & Morris (2007) argued that the assumption of LaRosa et al. (2005) that the magnetic field and cosmic rays are in a minimum-energy state across this region is unlikely to be valid. According to their model estimates, the mean magnetic field is at least 100 microgauss on a scale of several hundred parsecs and peaks at approximately 500 microgauss at the center of the diffuse nonthermal source (DNS). This is an important issue to be settled for the GC magnetic environment. Most of the GC radio NTFs are found to be perpendicular to the Galactic plane, implying a local poloidal magnetic fields of about milli-gauss strengths (e.g., Yusef-Zadeh & Morris 1987). However, recent observations revealed that the GC magnetic field may be more complex than a simple globally ordered dipolar field (e.g., LaRosa et al. 2004; Nord et al. 2004). It might be possible for X-ray NTFs to also provide clues of the configuration of the local magnetic field as well as the interaction between it and the ambient gas flow.
We report morphological and spectral properties of another 10 newly discovered X-ray filaments within a region of surrounding the Sgr A∗ (roughly corresponding to a projected sky area of pc by pc at a presumed distance of 8 kpc to the GC). Their plausible physical origins are discussed in section 4. All error bars in the X-ray spectrum parameter measurements are at the 90% confidence level, and we express the fitted parameters in the format of , where is the best fit value while and are the lower and upper limits of the 90% confidence interval, respectively. For all the images in the paper, north is up and east is to the left. We shall adopt a distance of 8 kpc from the solar system to the GC throughout this paper. We note that during the review process of this manuscript, Muno et al. (2007) submitted a paper also on X-ray filaments around the Galactic center.
2 Satellite Observations and Data Reduction
This work takes advantage of a large number of observations by the Advanced CCD Imaging Spectrometer (ACIS-I) onboard of Chandra X-ray satellite aimed at the Sgr A∗ (e.g., Baganoff et al. 2003). We utilize the archival data available by September 2005, including the eleven observations taken before May 3, 2002, as listed by Park et al. (2005) (1561b excluded), and the three more recent observations (Obs. ID 3549, 4683, and 4684) taken on June 19, 2003 and July 5 and 6, 2004. The total resultant exposure time of the included 14 observations is 760 ks. Following the standard event reprocessing procedures from the package of Chandra Interactive Analysis of Observations (CIAO) (version 3.2.2), we first processed individual observations, including the correction for charge transfer inefficiency, bad-pixel-removing, and light-curve cleaning etc. We then co-add the data from the 14 observations by the sky coordinates to generate the composite data set. The detailed data preparation procedures are described in Wang et al. (2006).
When placed on axis at the focal plane of the grazing-incidence X-ray mirrors, the imaging resolution (FWHM) is determined primarily by the pixel size of the CCDs of 0492. The CCDs also measure the energies of incident photons with a resolution of eV (depending on photon energy and distance from the read-out node) (e.g., Baganoff et al. 2003). We used the X-ray data in keV energy band for the spectrum study. The CCD frames are read out every 3.2 s, which provides the nominal time resolution of the X-ray data (e.g., Muno et al. 2006). Here, we focus on the inner region centered around the Sgr A∗ where the point spread function (PSF) broadening is insignificant.
3 Data Analysis and Results on X-Ray Filaments
The source region framed for extracting the spectrum of each source is chosen in such a way that it is small enough to minimize contaminations from the surroundings and yet large enough to contain the bulk of filament emission. For those X-ray filaments with a sufficient number of photons for statistics, we divide them into sub-regions to look for the spectral evolution along the filamentary structure. The background spectrum is extracted from one or several regions in the environs of the relevant filament under consideration. For each filament, we have used different background regions to test their effects on the final spectra. Although the best fit parameters do vary slightly with different backgrounds, this variation is much smaller than the uncertainties of the current data statistics. Most of the X-ray spectra are modelled by the absorbed power-law continuum ( for short hereafter) in XSPEC. The Galactic coordinate of a filament is given by the position of its brightest part. Incidentally, the size of the filament given in this paper should only be regarded as a rough estimate.
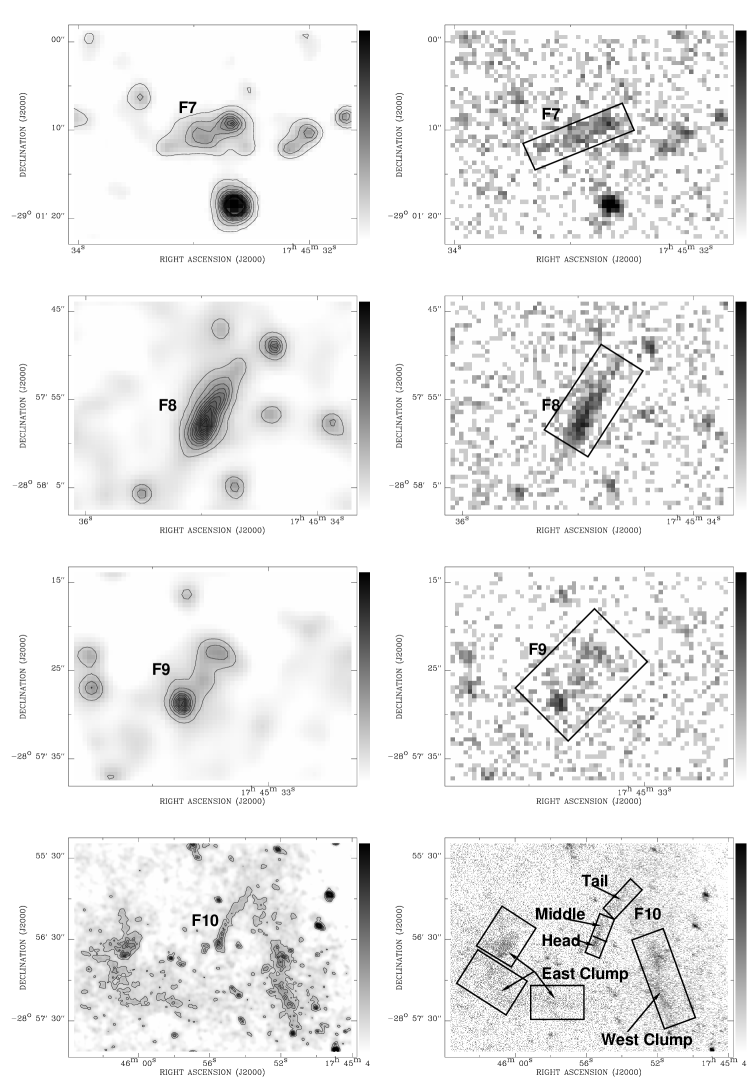
Fig. 1 gives a panoramic view of the X-ray filaments in the GC region studied here. Sgr A∗ is buried deep in the lower right region where the emission is saturated in Fig. 1. We studied the images of each X-ray filament in details and the results are shown in the left columns of Fig. 2 and Fig. 3. From the X-ray contours, we can see that there are signs for the existence of point-like sources in some filaments. The right columns of Fig. 2 and Fig. 3 show the keV counts image created from the composite event file of the 14 Chandra observations as mentioned in the last section. The rectangular boxes drawn on the images represent the source regions (including the sub-regions used for studying spectral evolution along a filament). Fig. 4 shows the final spectra of the ten filaments extracted from the “entire” source regions. All of them can be well fitted with the model, implying that the X-ray emissions we detected are dominated by the nonthermal component. It should be noted that if these sources emit any thermal components, they would likely be completely absorbed and unobservable. In Fig. 5, we give the joint-fit spectra extracted from the sub-regions of filaments F1, F3, F6 and F10, whose photon counts are large enough to allow for a comparison of the sub-region spectra. The spectrum fitting results are summarized in Table 1.
We have also sought for the counterparts of X-ray filaments in H, K infrared bands and in 20 cm radio band. The infrared images were produced by the 2 Micro All Sky Survey project and were downloaded from the skyview website.111The website address is http://skyview.gsfc.nasa.gov/cgi-bin/query.pl . The radio data were acquired by the Very Large Array (VLA) on July 23, 2001, with a beam size of 15 (Lang et al. 2007). No obvious filamentary structures were found (with an upper limit of 0.12 Jansky/beam), except for filament F10, which coincides with a statistically significant radio filament. In addition to the fitting parameters for filaments summarized in Table 1, we now describe properties of each X-ray filament below.
Filament 1 (F1): G359.936-0.038
Filament F1 lies ( pc) southwest of Sgr A∗. The brightest part of F1 is near the Celestial coordinates (l, b)=(, ). The elongation occurs almost in the exact north-south direction with a point-like source residing at the head in the northeast part. It has a rough length of and a width of . Its spectra can be well fitted by . We divided the filament into the head and tail regions, and fitted their respective spectra. Although the the best-fit appears twice bigger than , the error bars are larger than the difference. Therefore, the current data are not good enough to constrain the spectral evolution of F1.
Filament 2 (F2): G359.934-0.037
Filament F2 has a size of . The most concentrated part of F2 is near the Celestial coordinates (l, b) = (, ), which is () southwest of Sgr A∗. The elongation is along the northeast-southwest direction with the head in the northeast end. Similar to F1, there is no obvious emission line and a simple power-law gives a fairly satisfactory fit.
Filament 3 (F3): G359.965-0.053
At (3 pc) northeast of Sgr A∗ lies filament F3 with a size of ; the elongation is from northeast (NE) to southwest (SW). This filament was first mentioned by Baganoff et al. (2003) as a “curious linear feature”. They reported its existence in the keV and keV bands, but not in the keV band. Our analysis also shows that the bulk of F3 emission comes from photons of energies below 6 keV. The X-ray morphology clearly shows that F3 contains two concentrations. In order to study their spectral evolution, we divide it into the “head” (the NE concentration with stronger emission), “middle” (between NE and SW), and “tail” (the SW concentration with weaker emission) regions. There appears a spectral steepening from the “tail” to “head”. However, since no obvious point-like source is detected in the “head” region, the “head” to the “tail” direction does not necessariely mean the electron flow direction, as will be further discussed in section 4.3.
The two-blob morphology is somewhat unexpected and one might wonder whether the three regions we choose are in fact coherent parts of the same source. Actually, the spectral results may cast doubt on the coherence of the “head” and “tail”. First, the value in Table 1 shows that the “head” region has a hydrogen column density of cm-2, while the “tail” region has a value of cm-2, which might suggests that the “tail” could be nearer to us than the “head” is. Second, the spectrum of the “tail” shows slight signs of 6.7 keV emission line, which is not found in the “head” and “middle” regions.
However, we find that these spectral “differences” are most likely not caused by the emitter proper. The higher to the “head” region is quite probably due to a small molecular cloud in this direction (e.g., Coil & Ho 1999, 2000). Fig. 2 of Coil & Ho (2000) shows that the column density of the NH3 cloud in the “head” region is about 1/10 of that of the streamer at R.A., Dec29 02 30, while the equivalent of this streamer is cm-2 (Coil & Ho 1999). So of the small NH3 cloud is cm-2, comparable to the difference between the “head” and “tail” spectra. The slight 6.7 keV emission line feature in the spectrum of the “tail” is likely due to an insufficient subtraction of the background emission. For comparison, we extract the spectrum of the dense diffuse emission near the “tail” region and do find that it has a fairly strong 6.7 keV iron line (see the upper panel of Fig. 6). Therefore, F3 is most likely one source object in space.
Filament 4 (F4): G359.964-0.056
Filament F4 is close to filament F3 in sky projection. The elongation occurs in the northeast-southwest direction. It has a size of . The spectrum also appears to be non-thermal.
Filament 5 (F5): G359.959-0.028
This filament lies () northwest of Sgr A∗, with a length of and a width of . The elongation is oriented along the northwest-southeast direction for fitting parameters). There exists a point source near the southeast end of F5 (separation ); however, this is very likely a chance spatial coincidence and thus we do not include it in the source region.
Filament 6 (F6): G359.969-0.038
Filament F6 lies () northeast of Sgr A∗. It has a width of and a length of . The elongation occurs in the northeast-southwest direction, and a point-like source resides at the southwest end. Along the elongation, we divide F6 into the head (SW) and tail (NE) parts. The spectra of these two parts are the same within error bars.
Filament 7 (F7): G359.920-0.029
Filament F7 also lies () southwest of Sgr A∗, with a size of . The elongation is along the northwest-southeast direction fairly close to the east-west direction. Since there are no X-ray photons below 4 keV, the statistics are extremely poor for this filament and therefore, the energy spectrum cannot be fitted to distinguish any models. Nevertheless, we still fit it with an absorbed power-law model.
Filament 8 (F8): G359.970-0.009
Filament F8 is located () northwest of Sgr A∗. The elongation is along the northwest-southeast direction. It has a width of and a length of . The energy spectrum of filament F8 also appears to be non-thermal.
Filament 9 (F9): G359.974-0.00
Filament F9 is () northwest of Sgr A∗. Its elongation is almost parallel to those of filaments F5 and F8. It has a width of and a length of . The energy spectrum of filament F9 also appears to be non-thermal.
Filament 10 (F10): G0.029-0.06
This filament lies () northeast of Sgr A∗. With a width of and a length of , it is the longest X-ray filament so far identified within the central 15 pc of the Galaxy center. The energy spectrum of filament F10 is rather flat and non-thermal, with the column density of a typical value for the absorption around the GC. To see the photon index evolution along the filament, we divide the filament into three parts: “head” (i.e. where the assumed point-source resides), “middle”, and “tail” parts. We then conducted a joint fit for the energy spectra of these three regions. As listed in Table 1, there appears a spectral steepening from the “head” to “tail”. No IR counterparts are found for filament F10. But quite interestingly, there is a 20cm radio filament more or less coincident with F10 spatially; implications of this spatial coincidence will be discussed in .
4 Discussion
4.1 Properties and possible origins of GC X-ray filaments
While X-ray photon numbers may not be high enough to constrain the exact shapes of the energy spectra, all spectra appear featureless except for filament F3 showing weak iron line features (see Section 3.3) and can be well fitted with power-law models. Fitting of some of these energy spectra with thermal emission models is acceptable statistically; nevertheless, this always gives quite high temperatures, i.e., keV. We therefore incline to the view that X-ray emissions from these filaments are non-thermal in nature.
Table 2 sums up the inferred parameters for these 15 non-thermal X-ray filaments in the inner around the GC. In addition to the 10 filaments studied in this paper, we also include the other 5 filaments, namely G359.89-0.08, G359.90-0.06, G359.95-0.04, G359.983-0.046, and G0.13-0.11, reported and studied earlier in the literature. Most of their hydrogen column density are of the order of , consistent with other estimates around the GC region. Most of their photon indices fall within the range of . The chance of these X-ray filaments being background extragalactic sources is very small according to the spectral and morphological properties. For instance, it would be very difficult to explain the linear filamentary morphology using the hypothesis of extragalactic origins. Therefore, these X-ray filaments are most likely unique objects around the GC region.
As already discussed in Section 1, there were suggestions that these X-ray filaments may be ram-pressure confined PWNe (Wang et al. 2003, 2006), or synchrotron emissions from MHD shocks associated SNRs or emissions resulting from inverse Compton scattering (Yusef-Zadeh et al. 2005; Figer et al. 1999). The non-thermal X-ray emission mechanisms may be either synchrotron emission or inverse-Compton scattering. Magnetohydrodynamic (MHD) relativistic pulsar winds (Michel 1969; Goldreich & Julian 1970; Kennel & Coroniti 1984a, b; Lou 1996, 1998) and MHD shock interactions of magnetized outflows (e.g., Yu & Lou 2005; Yu et al. 2006; Lou & Wang 2006, 2007) with the interstellar medium (ISM) in SNRs and PWNe could provide high-energy electrons needed in these two radiation mechanisms (e.g., Sakano et al. 1993; Lu et al. 2003; Wang et al. 2006). If these X-ray filaments are SNRs, their elongations would probably represent MHD shock fronts and therefore, one would not expect to see a tendency of spectral softening along a filament. The two bright filaments F3 and F10 both show evidence for such a softening tendency. The fact that most of these filaments have point-like sources at the heads also againsts the SNR origin. On the other hand, as nonthermal X-ray emission is only detected in several SNRs within the entire Galaxy, it would be highly unlikely that there are so many nonthermal SNRs around the GC region. For this reason, we would argue that most of these X-ray filaments are not SNRs. Observed properties of these X-ray filaments may be more consistent with those of PWNe. Typical features of a PWN are: non-thermal X-ray spectrum, with photon index of and a X-ray luminosity range from to in keV band (e.g., Gaensler & Slane 2006; Kaspi, Roberts & Harding, 2006). The and of these 10 filaments are consistent with the values of a PWN. The existence of point-like X-ray sources as indicated by the image study also tends to favor a PWN scenario.
We may estimate the ages of the putative pulsars with the X-ray luminosities of these X-ray filaments. Li et al. (2007) studied statistically the nonthermal X-ray emission from young rotation powered pulsars and PWNe. They noted that there exists a correlation between the pulsar age and the keV PWN luminosity , which can be expressed as . The X-ray luminosities of these 10 filaments are in the range of 0.2-2.2 erg s-1. Using this empirical formula, ages of these putative pulsars are possibly between to yr. However, given the dispersion about the above empirical relationship (Li et al. 2007), the estimate may be uncertain probably by a factor of 10.
Since the ages of pulsars with bright PWNe are usually younger than a few tens of thousand years, one may doubt if a pulsar at the age of several years can produce a detectable X-ray nebula. However, the PWN of a relatively old pulsar can be enhanced in surface brightness and thus become detectable if the pulsar wind materials are confined to one direction. PSR B0355+54 is yr old. It converts % of its spin-down luminosity to the cometary-like X-ray nebula (e.g., Tepedelenlioǧlu & Ögelman 2007). The old pulsar PSR B1929+10 ( yr) also converts of its spin-down luminosity erg s-1 into the emission of the cometary nebula (e.g., Becker et al. 2006). The X-ray filaments identified in the GC region are similar to these two systems and thus probably powered by pulsars.
Now we discuss whether the number of X-ray filaments, if identified with PWNe, would be consistent with the estimated star formation rate in the GC region. According to Figer et al. (2004), the star formation rate at the GC is about which is some 250 times higher that the mean star formation rate in the Galaxy. In the field of view of our Fig. 1, we take a radius of about pc and estimate the star formation rate to be . If the mean mass of a star is 10, the frequency of supernova explosions would be per year, leading to about 40 pulsars in the field of Fig. 1 younger than yr as estimated above. This number is roughly consistent with the 15 candidate PWNe identified in the field.
4.2 G0.029-0.06 (F10) and its radio counterpart
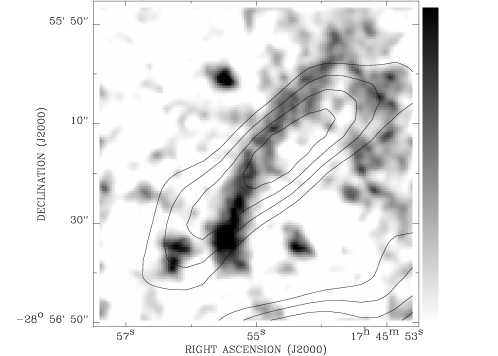
Filament F10 bears certain unique features to be noted here. First, it has the longest linear structure with the entire image slightly bent towards the northeast, more or less like an arc. Second, it is the farthest away from Sgr A∗ and thus has much less contamination from the strong diffuse X-ray emission of Sgr A. Third, there is an obvious 20cm radio NTF coincident spatially with X-ray filament F10.
The spectral indices for different regions along filament F10 show evidence of spectral steepening from the “head” to “tail” (see Table 1). When is fixed at the best fit value , the values for the “head”, “middle”, and “tail” regions are 1.1(1.0, 1.3), 1.5(1.4, 1.6), and 1.8(1.7, 1.9), respectively. This might suggest an energetic particle flow direction from the southeast (head) to the northwest (tail). A pulsar moving through the magnetized interstellar medium seems to give a plausible explanation of this scenario. Indeed, the morphology of F10 does imply a point source in the “head” region. The corresponding point spread function (PSF) at G0.029-0.06 is an ellipse with a size of . For an updated X-ray versus spin-down luminosity correlation of rotation powered pulsars, a modified empirical relation is given by equation (3) of Possenti et al. (2002), namely, where is the X-ray luminosity in keV energy band; using this empirical relation, we would have a . Since PSRs J1747-2958 and B1929+10 convert about 2.5% and 2.1 of their spin-down powers to their cometary X-ray nebulae (e.g., Gaensler et al. 2004; Becker et al. 2006), the ratio / of F10 () indicates that the above estimate for is reasonable.
The arc-like X-ray morphology of F10 and its coincidence with a radio NTF might be a good indicator of its interaction with the interstellar magnetic field environment of the GC region (Lang et al. 1999; Wang et al. 2002b). Similar to the discussion about G0.13-0.11 by Wang et al. (2002b), we may estimate the magnetic field strength in the current context. First, the lifetime of synchrotron X-ray emitting particles is given by , where is the X-ray photon energy in unit of keV (a value of 4 keV is adopted here) and is the magnetic field strength in the filament volume in units of mG. The simulations of Bucciantini et al. (2005) show that the average flow speed in the tail is about 0.8-0.9 . For a sustained X-ray linear structure, we estimate by requiring . Adopting a characteristic angular length of (), we thus infer a magnetic field strength mG, similar to those in the bright radio NTFs (e.g, Yusef-Zadeh & Morris 1987; Lang et al. 1999).
We try to outline a few plausible scenarios in the present context and discuss relevant aspects qualitatively. Magnetized neutron stars move with peculiar speeds in the range of a few tens of kilometers per second (a mean space velocities of for young pulsars; Hobbs et al. 2005; Faucher-Giguère & Kaspi 2006) to well over one thousand kilometers per second () and the surrounding ISM is generally magnetized. Generally speaking, a typical peculiar velocity of a neutron star is supersonic and super-Alfvénic in a magnetized ISM. Neutron stars or pulsars have different ranges of surface magnetic field strengths: G for millisecond pulsars in binaries, G for a wide range of pulsars, and G inferred for several magnetars. Several situations may happen. (1) If a pulsar does not involve an active pulsar wind, its peculiar motion through the surrounding magnetized ISM would sustain an MHD bow shock by its magnetosphere as well as a magnetotail. The faster the pulsar moves, the more linear the system would appear. This is basically like a bullet moving through an air supersonically and generating a Mach cone or wake. Relativistic electrons can be produced at the MHD bow shock and synchrotron emissions can be generated and sustained at the same time. (2) In a binary system, the fast wind (say, with a speed higher than 1000 km s-1) from a companion star can blow towards a spinning magnetized pulsar in orbital motion. Here, the situations of a companion fast wind blowing across a magnetized pulsar and a pulsar moving through the ISM with a high speed are more or less equivalent. Again, an MHD bow shock and a magnetotail can form in association with the pulsar system. The stronger the companion wind and the faster the pulsar moves, the more linear the pulsar system would appear. Relativistic electron and/or positrons can be generated and sustained to power synchrotron emissions in the bow shock draped around the pulsar magnetosphere. For such a system, one might be able to detect the presence of the companion by various independent means. (3) For a pulsar emitting an active pulsar wind and with misaligned magnetic and spin axes, spiral forward and reverse shock pairs can be generated in the relativistic pulsar wind as a result of inhomogeneous wind and eventually the pulsar wind is stopped by the ISM through a MHD termination shock (e.g., Lou 1993, 1996, 1998). (4) Case (3) can also happen for a pulsar moving with a high peculiar velocity through a magnetized ISM. (5) Case (3) can also happen for a pulsar in binary orbital motion with the companion blows a powerful wind with a speed higher than 1000 km s-1. In both cases of (2) and (5), the center of mass of the binary system may also move with a high speed through the ISM. One can further speculate several possible combinations along this line of reasoning (e.g., Chevalier 2000; Toropina et al. 2001; Romanova, Chulsky & Lovelace 2005).
There are two clumps (referred to as the east and west clumps hereafter) of diffuse X-ray emission surrounding filament F10. Although the west clump is also elongated, it is not called a filament because it contains many substructures. To see if these clumps are physically related to F10, we extract their energy spectra separately (see the middle and bottom panels of Fig. 6). The fitted parameters are listed in Table 3. The much higher absorbing column densities of the two clumps indicate strongly that they are located farther away from us than F10 is, while these two clumps themselves are almost at the same distance (see Table 3). Moreover, their X-ray emissions are very likely powered by the same mechanism, as hinted by the characters of their spectra, which can be fitted well with an absorbed power-law model plus a 6.4 keV emission line. The total emission comes mostly from the photon energy keV band, with a strong 6.4 keV neutral Fe K line. In contrast, the Fe line feature is not present in the spectrum of F10. A possible explanation for this non-thermal, apparently broadened iron line emission at 6.4 keV is the collisions of low-energy cosmic-ray electrons with irons in molecular clouds (e.g., Valinia et al. 2000) or by the radiative illumination from the GC massive black hole that was suggested to be very bright in the past (e.g., Koyama et al. 1989). In conclusion, F10 and the surrounding clumps do not seem to interact directly.
4.3 X-ray NTFs as tracers of the small-scale magnetic fields and gas dynamics
The oritentation of the X-ray filaments provides an opportunity to probe the physics conditions of the GC region. As discussed in section 4.1, the cometary shapes of the X-ray filaments imply that the pulsar wind particles are confined to one direction by the ambient materials. Mechanism shaping the filamentary structure could be ordered magnetic fields (e.g., Yusef-Zadeh & Morris 1987; Lang, Morris, & Echevarria 1999) and/or high relative velocity between the pulsars and the surrounding gas (e.g., Wang et al. 1993; Shore & LaRosa 1999). The magnetic field could be the product of the gas motion, and the magnetic field could also control the motion of the gas (e.g., Heyvaerts et al. 1988; Chevalier 1992). Radio NTFs suggests that the magnetic field is poloidal at large-scale (e.g., Yusef-Zadeh & Morris 1987; Lang, Morris, & Echevarria 1999) with some more complex smaller structures around the GC region (e.g., Nord et al. 2004). By looking at the X-ray images shown by Figures 1, 2 and 3, there seems to be a tendency that the PWN tails point away from the GC, indicating that the pulsar wind particles are blown outward. This might imply the presence of a Galactic wind of hot plasma blowing away from the center, given the high star formation rate (and so plenty of hot gas) in this region. Pulsars may have typical peculiar velocities of (e.g., Hobbs et al. 2005; Faucher-Giguère & Kaspi 2006) and we would expect them to move in random directions. The tendency for the structures of ten PWNs to orient away from the center seems to suggest that the Galactic wind has a speed comparable to or greater than .
In the above scenario, the particle flow direction of the X-ray filament F3 should be from the southwest (closer to Sgr A*) to the northeast. This suggests that the pulsar, the origin site of the particles, is actually in the “tail” region defined in Fig 2. Then the evident spectral steepening from the southwest to the northeast (see section 3) can be naturally expained. Therefore, the spectral evolution along F3 also supports the existence of a radial high velocity wind in the GC region.
While the X-ray filaments may not completely overlap with their radio NTFs, their overall orientations are similar. This is supported by the four X-ray NTFs (including filament F10 in our analysis) that have radio counterparts: G359.54+0.18 overlays exactly on the northern part of the two radio filaments (e.g., Yusef et al. 2005; Lu et al. 2003); G359.89-0.08 and its radio counterpart SgrA-E overlaps partly and extends in the same direction, with a centroid offset of (e.g., Yusef et al. 2005; Lu et al. 2003); G359.90-0.06 (SgrA-F) (e.g., Yusef et al. 2005) and G0.029-0.06 (F10) (see our subsection 3.10) also show similar spatial property. Generally speaking, the X-ray NTFs tend to be shorter than the radio NTFs. This centroid offset and smaller extent of X-ray filaments could be both explained by the much shorter synchrotron cooling lifetime in X-ray than in radio (e.g., Ginzburg & Syrovatskii 1965).
5 Summary and Discussion
To summarize, the most important properties of the GC X-ray filaments in this Chandra data analysis are their non-thermal spectra, and of course, the apparent thread-like linear morphology with point-like sources residing at the “head”. The scenario of pulsars ploughing through the interstellar medium and high energy particles from the PWN interacting with the surrounding magnetic field seems to be a plausible interpretation. However, this relationship with pulsars can only be confirmed by the direct detection of periodic flux variations from the putative point-sources. Future faster timing, higher sensitivity and spatial resolution of X-ray instruments, together with radio and near-IR follow-up observations, should help to reveal the true identity of these X-ray filaments. Meanwhile, these filaments could also provide some clues to the searching for GC pulsars, as well as the study of small-scale magnetic field structures and gas dynamics around the GC.
By our suggestion, one might get the impression that there are many pulsar bow shocks within pc of the Galactic center. Actually in this scenario, there should be even more due to the unavoidable projection effect; some X-ray bright sources may be heading directly towards or away from us with their ‘tails’ behind or in front superposed with their ‘heads’. We now only catch those suspects readily identified by their linear or arc-like morphologies. By all astronomical standards, our Galactic center is not very active at the present epoch even though there is a black hole with a mass of lurking at the center near Sgr A∗ (e.g., Shen et al. 2005). Nevertheless, the neighborhood of our Galactic center might have been active in the past with starbursts and magnetized Galactic winds and so forth. While interacting with winds or flows of the ISM, the compact remnants of these massive stars (produced during the starburst phase) with a distribution of peculiar speeds might then have a higher concentration around the Galactic center. A typical peculiar speed of a few hundred kilometers per second would be supersonic and super-Alfvénic in a magnetized ISM. With the projection effect taken into account, the physical linear extension of such a PWN should be jointly determined by the local ISM flow direction and the direction of the remnant peculiar velocity.
Acknowledgments
The authors thank the referee and Editor E. D. Feigelson for constructive comments leading to a significant improvement of the manuscript. We thank Q. D. Wang for very helpful discussion, thank C.C. Lang for sending us the 20 cm radio image before publication. This research has been supported in part by the Special Funds for Major State Basic Science Research Projects of China, by the NSFC grant 10573017 at the Institute of High Energy Physics, by NSFC grants 10373009 and 10533020 at the Tsinghua University, by the Tsinghua Center for Astrophysics, and by the SRFDP 20050003088 and the Yangtze Endowment from the Ministry of Education at Tsinghua University. This publication makes use of data products from the Two Micron All Sky Survey, which is a joint project of the University of Massachusetts and the Infrared Processing and Analysis Center, funded by the National Aeronautics and Space Administration and the National Science Foundation.
References
- Baganoff et al. (2003) Baganoff, F. K., Maeda, Y., Morris, M., Bautz, M. W., Brandt, W. N., Cui, W., Doty, J. P., Feigelson, E. D., Garmire, G. P., Pravdo, S. H., Ricker, G. R., & Townsley, L. K. 2003, ApJ, 591, 891
- Beck & Hoernes (1996) Beck R., Hoernes P., 1996, Nature, 379, 47
- Becker et al. (2006) Becker, W., Kramer, M., Jessner, A., Taam, R. E., Jia, J. J., Cheng, K. S., Mignani, R., Pellizzoni, A., de Luca, A., Slowikowska, A., & Caraveo, P. A. 2006, ApJ, 645, 1421
- Becklin et al. (1978) Becklin, E. E., Matthews, K., Neugebauer, G., & Willner, S. P. 1978, ApJ, 219, 121
- Bian & Lou (2005) Bian, F.-Y. & Lou, Y.-Q. 2005, MNRAS, 363, 1315
- Boldyrev & Yusef-Zadeh (2006) Boldyrev, S., & Yusef-Zadeh, F. 2006, ApJ, 637, L101
- Bucciantini (2002) Bucciantini, N. 2002a, A&A, 387, 1066
- Bucciantini (2002) Bucciantini, N. 2002b, A&A, 393, 629
- Bucciantini (2005) Bucciantini, N., Amato, E., & Del Zanna, L. 2005, A&A, 434, 189
- Cheng et al. (2004) Cheng, K. S., Taam, R. E., & Wang, W. 2004, ApJ, 617, 480
- Cheng et al. (2006) Cheng, K. S., Taam, R. E., & Wang, W. 2006, ApJ, 641, 427
- Chevalier (1992) Chevalier, R.A. 1992, ApJ, 397, L39
- Chevalier (2000) Chevalier, R. A. 2000, ApJ, 539, L45
- Cordes & Chernoff (1998) Cordes, J. M., & Chernoff, D. F. 1998, ApJ, 505, 315
- Cordes & Lazio (1997) Cordes, J. M., & Lazio, T. J. W. 1997, ApJ, 475, 557
- Cowin Morris (2006) Cowin, B. J., & Morris, M. 2006, BAAS, Vol. 38, p.1147
- Faucher-Giguere Kaspi (2006) Faucher-Giguère, C.-A., & Kaspi, V. M. 2006, ApJ, 643, 332
- Ferriere (2001) Ferriere, K. M. 2001, Reviews of Modern Physics, 73, 1031
- Ferriere (2007) Ferriere, K. M. 2007, EAS Publications Series, 23, 3
- Figer et al. (1999) Figer, D. F., Kim, S. S., Morris, M., Serabyn, E., Rich, R. M., & Mclean, I. S. 1999, ApJ, 525, 750
- Figer et al. (2002) Figer, D.F., Majarro, F., Gilmore, D., Morris, M., Kim, S. S., Serabyn, E., McLean, I. S., Gilbert, A. M., Graham, J. R., Larkin, J. E., Levenson, N. A., & Teplitz, H. I. 2002, ApJ, 581, 258
- Figer et al. (2004) Figer, D.F., Rich, R. M., Kim, S.S., Morris, M., & Serabyn, E. 2004, ApJ, 601, 319
- Gaensler et al. (2004) Gaensler, B. M., van der Swaluw, E., Camilo, F., Kaspi, V. M., Baganoff, F. K., Yusef-Zadeh, F., & Manchester, R. N. 2004, ApJ, 616, 383
- Gaensler Slane (2006) Gaensler, B. M., Slane, P. O., 2006, ARA&A, 44, 17
- Ginzburg & Syrovatskii (1965) Ginzburg, V. L., & Syrovatskii, S. I. 1965, ARA&A, 3, 297
- Goldreich & Julian (1970) Goldreich, P., & Julian, W. H. 1970, 160, 971
- Gotthelf & Olbert (2002) Gotthelf, E. V., & Olbert, C. M. 2002, in ASP Conf. Ser.271, Neutron Stars in Supernova Remnants, ed. P. O. Slane & B. M. Gaensler (San Francisco: ASP), 171
- Gotthelf (2003) Gotthelf, E. V. 2003, ApJ, 591, 361
- Gotthelf (2004) Gotthelf, E. V. 2004, astro-ph/0610376
- Han (2007) Han, J. L. 2007, eprint/arXiv:0705.4175
- Heyvaerts et al. (1988) Heyvaerts, J., Norman, C., & Pudritz, R.E. 1988, ApJ, 330, 718
- Ho et al. (1985) Ho, P. T. P., Jackson, J. M., Barrett, A. H., & Armstrong, J. T. 1985, ApJ, 288, 575
- Hobbs et al. (2005) Hobbs, G., Lorimer, D. R., Lyne, A. G., & Kramer, M., 2005, MNRAS, 360, 974
- Johnston et al. (2006) Johnston, S., Kramer, M., Lorimer, D. R., Lyne A. G., McLaughlin, M., Klein, B., Manchester, R. N. 2006, MNRAS, 373, L6
- Kaspi et al. (2006) Kaspi, V. M., Roberts, M. S. E., Harding, A. K. 2006, In: Compact stellar X-ray sources. Edited by Walter Lewin & Michiel van der Klis. Cambridge Astrophysics Series, No. 39. Cambridge, UK, p. 279-339
- Kawai et al. (1998) Kawai, N., Tamura, K., & Shibata, S. 1998, in Neutron Stars and Pulsars Thirty Years after the Discovery, ed. N. Shibazaki, N. Kawai, S. Shibata & T. Kafune (Tokyo: Universal Academy), 449
- Kennel & Coroniti (1984a) Kennel, C. F., Coroniti, F. V. 1984a, ApJ, 283, 694
- Kennel & Coroniti (1984b) Kennel, C. F., Coroniti, F. V. 1984b, ApJ, 283, 710
- Koyama et al. (1989) Koyama, K., Awaki, H., Kunieda, H., Takano, S., Tawara, Y., Yamauchi, S., Hatsukade, I., & Nagase, F. 1989, Nature, 339, 603
- Lang (1999) Lang, K. R. 1999, Astrophysical Formulae, Volume II, (Springer), 87
- Lang, Morris, & Echevarria (1999) Lang, C. C., Morris, M., & Echevarria, L. 1999, ApJ, 526, 727
- Lang et al. (2007) Lang, C. C. et al., 2007, in preparation
- Larosa et al. (2005) LaRosa, T. N., Brogan, C. L., Shore, S. N., Lazio, T. J., Kassim, N. E., Nord, M. E. 2005, ApJ, 626, 23
- Larosa et al. (2000) LaRosa, T. N., Kassim, N. E., Lazio, T. J. W., & Hyman, S. D. 2000, AJ, 119, 207
- Li & Lu (2007) Li, X. H., & Lu, F. J. 2007, ApJ, in preparation
- Lou (1987) Lou, Y.-Q. 1987, ApJ, 322, 862
- Lou (1993) Lou, Y.-Q. 1993, ApJ, 414, 656
- Lou (1996) Lou, Y.-Q. 1996, MNRAS, 279, 129
- Lou (1998) Lou, Y.-Q. 1998, MNRAS, 294, 443
- Lou (2001) Lou, Y.-Q. 2001, ApJ, 563, L147
- Lou & Bai (2006) Lou, Y.-Q., & Bai X. N. 2006, MNRAS, 372, 81
- Lou & Wang (2007) Lou, Y.-Q., & Wang, W. G. 2007, MNRAS, 378. L54 (astro-ph/0704.0223)
- Lu et al. (2002) Lu, F. J., Wang, Q. D., Aschenbach, B., Durouchoux, P., & Song, L. M. 2002, ApJ, 568, L49
- Lu et al. (2003) Lu, F. J., Wang, Q. D., & Lang, C.C. 2003, AJ, 126, 319
- Manchester (2003) Manchester, R. N. 2003, www.atnf.csiro.au/research/pulsar/catalogue/
- Michel (1969) Michel, F. C. 1969, ApJ, 158, 727
- Morris (1996) Morris, M., & Serabyn, E. 1996, ARA&A, 34, 645
- Muno et al. (2006) Muno, M. P., Bauer, F. E., Bandyopadhyay, & Wang, Q. D. 2006, AJ, submitted, astro-ph/0601627
- Muno et al. (2007) Muno, M.P., Baganoff, F.K., Brandt, W.N., Morris, M.R., & Starck, J.L. 2007 ApJ, submitted (astro-ph/0707.1907)
- Nord et al. (2004) Nord, M. E., Lazio, T. J. W., Kassim, N. E., Hyman, S. D., LaRosa, T. N., Brogan, C. L., & Duric, N. 2004, AJ, 128, 1646
- Park et al. (2005) Park, S., et al. 2005, ApJ, 631, 964
- Possenti et al. (2002) Possenti, A., Cerutti, R., Colpi, M., & Mereghetti, S. 2002, A&A, 387, 993
- Romanova et al. (2005) Romanova, M. M., Chulsky, G. A., Lovelace, R. V. E. 2005, ApJ, 630, 1020
- Sakano et al. (2003) Sakano, M., Warwick, R. S., Decourchelle, A., & Predehl, P. 2003, MNRAS, 340, 747
- Seward & Wang (1988) Seward, F. D., & Wang, Z. R. 1988, ApJ, 332, 199
- Shen et al. (2005) Shen, Z.-Q., Lo, K. Y., Liang, M.-C., Ho, Paul T. P., & Zhao, J.-H. 2005, Nature, 438, 62
- Shore & LaRosa (1999) Shore, S.N., & LaRosa, T.N. 1999, ApJ, 521, 587
- Spitkovsky (2006) Spitkovsky, A. 2006, ApJ, 648, 51
- Tepedelenlioǧlu & Ögelman (2007) Tepedelenlioǧlu, E. & Ögelman, H. 2007, ApJ, 658, 1183
- Toropina et al. (2001) Toropina, O. D., Romanova, M. M., Toropin, Yu. M., Lovelace, R. V. E. 2001, ApJ, 561, 964
- Valinia et al. (2000) Valinia, A., Tatischeff, V., Arnaud, K., Ebisawa, K., & Ramaty, R. 2000, ApJ, 543, 733
- Wang et al. (1993) Wang, Q.D., Li, Z.Y., & Begelman, M.C. 1993, nature, 364, 127
- Wang et al. (2002a) Wang, Q. D., Gotthelf, E. V., & Lang, C. C. 2002a, Nature, 415, 148
- Wang, Lu & Lang (2002b) Wang, Q. D., Lu, F. J., & Lang, C. C. 2002b, ApJ, 581, 1148
- Wang, Lu & Gotthelfi (2006) Wang, Q. D., Lu, F. J., & Gotthelf, E. V. 2006, MNRAS, 367, 937
- Wang & Lou (2007) Wang, W. G., & Lou, Y.-Q. 2007, ApSS, in press
- Wang, Yang, Zhang, Ma, Zhou, Li, Lou, Li (2005) Wang, X. F., Yang, Y. B., Zhang, T. M., Ma, J., Zhou, X., Li, W. D., Lou, Y.-Q., & Li, Z. W., 2005, ApJ, 626, L89
- Wielebinski (2005) Wielebinski, R., 2005, Cosmic Magnetic Fields. eds. Richard Wielebinski and Rainer Beck. Lecture notes in Physics Volume 664, p89
- Willingale et al. (2001) Willingale, R., Aschenbach, B., Griffiths, R. G., Sembay, S., Warwick, R. S., Becker, W., Abbey, A. F., & Bonnet-Bidaud, J.-M. 2001, A&A, 365, L212
- Wu & Lou (2006) Wu, Y., & Lou, Y.-Q. 2006, MNRAS, 372, 992
- Yu & Lou (2005) Yu, C., & Lou, Y.-Q. 2005, MNRAS, 364, 1168
- Yu, Lou, Bian & Wu (2006) Yu, C., Lou, Y.-Q., Bian, F.-Y., & Wu, Y. 2006, MNRAS, 370, 121
- Yusef-Zadeh et al. (1984) Yusef-Zadeh, F., Morris, M., & Chance, D. 1984, Nature, 310, 557
- Yusef-Zadeh et al. (2005) Yusef-Zadeh, F., Wardle, M., Muno, M., Law, C., & Pound, M. 2005, Advances in Space Research, 35, 107
- Zweibel & Heiles (1997) Zweibel, E. G., & Heiles, C. 1997, Nature, 385, 131
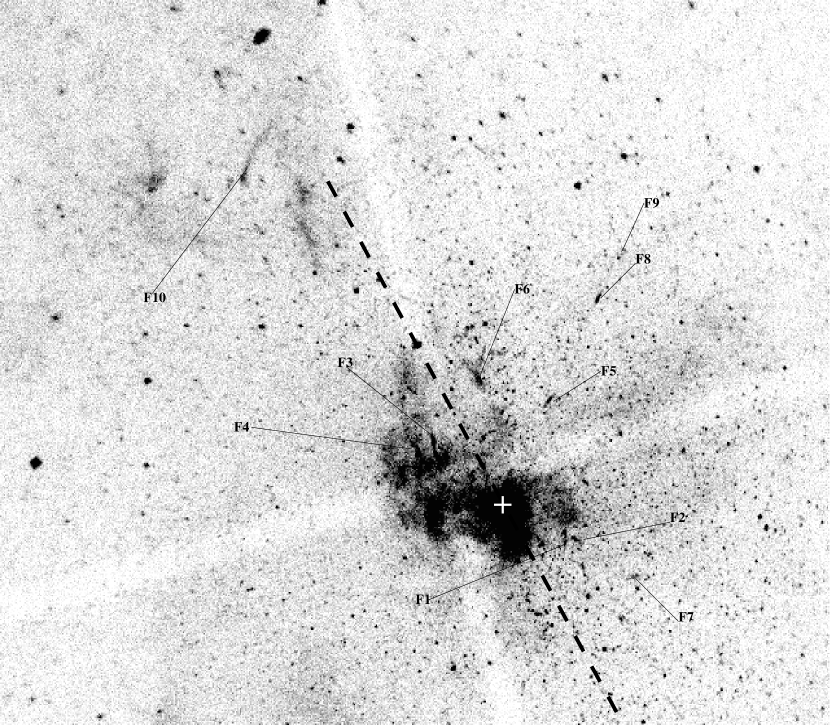
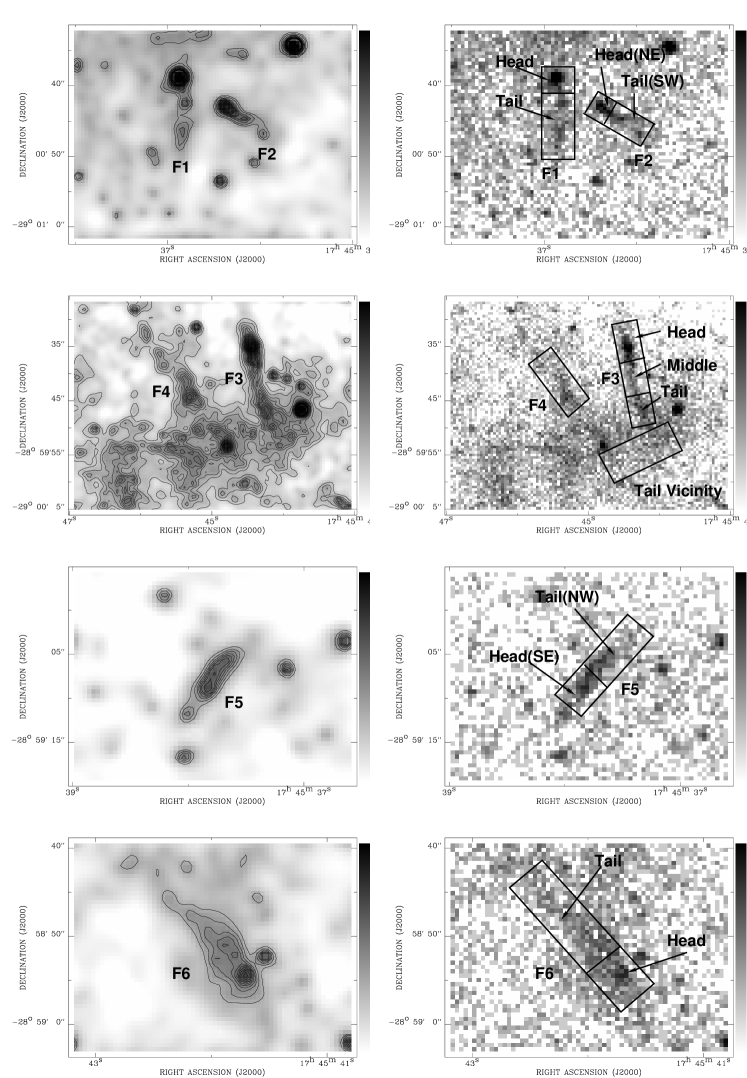
Figure 2 caption here.
Left: The 0.5-8.0 keV X-ray images of F1 to F6 with contours overlaid. These images are smoothed adaptively with a Gaussian to achieve a signal-to-noise ratio of 10. For the same data, these contours have the same stepsize of 4 counts arcsec-2 but different starting values, i.e., 20 counts arcsec-2 for F1 to F4 and 16 counts arcsec-2 for F5 and F6. Right: The count maps of the same regions as in the left column. The color bars are in logarithmic scale. For F1, F2, F5 and F6, the lower and upper limits are 4 counts arcsec-2 and 120 counts arcsec-2, while for F3 and F4 the two limits are 12 counts arcsec-2 and 120 counts arcsec-2, respectively. rays are displayed needs to be given in the caption.


| Region | |||||
|---|---|---|---|---|---|
| X-ray Filament 1 (F1, G359.936-0.038) | |||||
| Whole | 1.0(0.2, 1.5) | 0.9(-0.3, 1.6) | 8.0 (7.3, 10.2) | 0.92 (0.84, 1.15) | 29.8/30 |
| Joint-fit | set the same | ||||
| Head(N) | 0.8(0.3, 1.7) | 0.8(-0.2, 2.0) | 26.3/28 | ||
| Tail(S) | 0.8(0.3, 1.7) | 1.6(0.1, 3.3) | 26.3/28 | ||
| X-ray Filament 2 (F2, G359.934-0.037) | |||||
| Whole | 0.9(0.2, 2.1) | 0.8(0.3, 2.0) | 4.7 (4.2, 5.3) | 0.53 (0.44, 0.97) | 13.2/20 |
| Joint-fit | set the same | ||||
| Head(NE) | 0.9(0, 2.7) | 0.8(-0.8, 2.9) | 17.1/14 | ||
| Tail(SW) | 0.9(0, 2.7) | 1.2(-0.6, 3.4 ) | 17.1/14 | ||
| X-ray Filament 3 (F3, G359.965-0.053) | |||||
| Whole | 1.4(1.1, 1.7) | 2.3(1.8, 2.8) | 11.9 (11.4, 12.5) | 2.2 (1.9, 2.78) | 72.2/71 |
| Head | 1.9(1.3, 2.6) | 3.1(2.2, 4.3) | 31/35 | ||
| Middle | 1.8(0.6, 4.2) | 2.2(0.6, 5.3) | 3.6/10 | ||
| Tail | 0.7(0.3, 1.1) | 1.4(0.9, 1.8) | 23.5/24 | ||
| Joint-fit | set the same | ||||
| Head | 1.2(0.9, 1.5) | 2.0(1.5, 2.7) | |||
| Middle | 1.2(0.9, 1.5) | 1.5(0.8, 2.2) | |||
| Tail | 1.2(0.9, 1.5) | 2.4(1.7, 2.8) | |||
| X-ray Filament 4 (F4, G359.964-0.056) | |||||
| Whole | 0.6(0.1, 1.2) | 1.9(1.2, 3.0) | 4.0 (3.4, 5.2) | 0.47 (0.41, 0.75) | 13.8/19 |
| Filament 5 (F5, G359.959-0.028) | |||||
| Whole | 0.8(0.4, 1.5) | 1.4(0.9, 2.5) | 4.3 (3.6, 4.8) | 0.52 (0.43, 0.79) | 19.5/24 |
| Head(SE) | 0.5(0., 1.4) | 0.9(-0.4, 2.6) | 9.9/10 | ||
| Tail(NW) | 0.8(0., 5.9) | 0.8(-1.2, 6.8) | 2.7/2 | ||
| Joint fit: | set the same | ||||
| Head(SE) | 0.6(0.2, 1.5) | 1.1(-0.3, 2.1) | |||
| Tail(NW) | 0.6(0.2, 1.5) | 0.9(0.2, 1.5) | |||
| X-ray Filament 6 (F6, G359.969-0.038) | |||||
| Whole | 0.9(0.4, 1.4) | 1.4(0.9, 2.3) | 6.6 (5.7, 7.3) | 0.84(0.69, 1.07) | 35/40 |
| Head(SW) | 0.7(0., 2.5) | 1.1(-0.2, 3.8) | 18/13 | ||
| Tail(NE) | 0.7(0.1, 1.5) | 1.3(0.6, 2.3) | 25.4/23 | ||
| Joint fit: | set the same | ||||
| Head(SW) | 0.8(0.3, 1.5) | 1.2(0.3, 2.3) | |||
| Tail(NE) | 0.8(0.3, 1.5) | 1.6(0.7, 2.0) | |||
| X-ray Filament 7 (F7, G359.920-0.029) | |||||
| whole | 0.(0., 3.6) | 0.9(-0.2, 4.4) | 2.8 (1.6, 3.0) | 0.21 (0.19, 1.96) | 5.1/5.0 |
| X-ray Filament 8 (F8, G359.970-0.009) | |||||
| whole | 1.5(0.6, 3.0) | 2.3(0.8, 4.6) | 3.0 (2.3, 3.5) | 0.6 (0.4, 1.7) | 12.4/12 |
| X-ray Filament 9 (F9, G359.974-0.000) | |||||
| whole | 0.7(0., 1.5) | 0.6(-0.9, 1.9) | 4.7 (4.1, 5.1) | 0.41 (0.40, 0.46) | 5.8/13 |
| X-ray Filament 10 (F10, G0.029-0.06) | |||||
| Whole | 0.5(0.4, 0.7) | 1.2(0.9, 1.5) | 10.4 (9.9, 11.1) | 1.06 (1.02, 1.16) | 48.9/55 |
| Head | 1.0(0.6, 1.6) | 1.8(1.3, 2.8) | 27/21 | ||
| Middle | 0.4(0., 1.1) | 1.0(0., 2.0) | 8.7/13 | ||
| Tail | 0.3(0., 0.9) | 1.0(0.5, 1.5) | 22/18 | ||
| Joint fit: set the same and fit all the parameters | |||||
| Head | 0.7(0.4, 1.0) | 1.1(0.6, 1.8) | |||
| Middle | 0.7(0.4, 1.0) | 1.5(0.8, 2.2) | |||
| Tail | 0.7(0.4, 1.0) | 1.8(1.4, 2.2) | |||
| Joint fit: set the same and fix it at a value 0.7 | |||||
| Head | 0.7 | 1.1(1.0, 1.3) | |||
| Middle | 0.7 | 1.5(1.4, 1.6) | |||
| Tail | 0.7 | 1.8(1.7, 1.9) | |||
Note. — The spectral model used here is the absorbed power-law. Relevant parameters are
the hydrogen gas column density , X-ray photon index , the observed flux in the energy keV band and the unabsorbed X-ray luminosity in the energy keV band. For definitions of notations here, denotes the distance in units of 8 kpc, is the degree of freedom. Unless otherwise stated in Table 1 as , both and are free parameters in the fitting procedure.
| No. | Name | Galactic | Size | Offset | Counterparts | |||
|---|---|---|---|---|---|---|---|---|
| Coordinates | Radio/IR | |||||||
| 1 | a | G359.95-0.04 | 28 | 1.9 (1.8, 2.1) | 1.4 (1.3, 1.5) | 10. | no | |
| 2 | F1 | G359.936-0.038 | 517 | 0.9 (-0.3, 1.6) | 1.0 (0.2, 1.5) | no | ||
| 3 | F2 | G359.934-0.037 | 39 | 48 | 0.8 (0.3, 2.0) | 0.9 (0.2, 2.1) | no | |
| 4 | F3 | G359.965-0.053 | 412 | 2.3 (1.8, 2.8) | 1.4 (1.1, 1.7) | no | ||
| 5 | F4 | G359.964-0.056 | 412 | 1.9 (1.2, 3.0) | 0.6 (0.1, 1.2) | no | ||
| 6 | F5 | G359.959-0.028 | 410 | 1.4 (0.9, 2.5) | 0.8 (0.4, 1.5) | no | ||
| 7 | F6 | G359.969-0.038 | 516 | 1.4 (0.9, 2.3) | 0.9 (0.4, 1.4) | no | ||
| 8 | F7 | G359.920-0.029 | 415 | 0.9 (-0.2, 4.4) | 0.0 (0.0, 3.6) | no | ||
| 9 | bCannonball | G359.983-0.046 | 1.6 (1.2, 2.2) | 1.6 (0, 4.8) | 3.1 | no | ||
| 10 | F8 | G359.970-0.009 | 410 | 2.3 (0.8, 4.6) | 1.5 (0.6, 3.0) | no | ||
| 11 | F9 | G359.974-0.00 | 47 | 0.6 (-0.9, 1.9) | 0.7 (0.0, 1.5) | 0.4 | no | |
| 12 | cSgrA-E | G359.89-0.08 | 830 | 2.0 (1.5, 2.5) | 3.7 (2.5, 5.1) | yes (radio) | ||
| 13 | F10 | G0.029-0.06 | 647 | 1.2 (0.9, 1.5) | 0.5 (0.4, 0.7) | 1.1 | yes (radio) | |
| 14 | dSgrA-F | G359.90-0.06 | 36 | (0.8, 8.2) | (1.7, 7.9) | yes (radio) | ||
| 15 | e | G0.13-0.11 | 240 | 1.8 (1.4, 2.5) | 0.6 (0.4, 0.9) | 3.2 | yes (radio) |
Note. — Offset denotes the angular distance of the brightest part of an X-ray filament to the position of Sgr A∗; is the absorption corrected X-ray luminosity in the energy keV band, except that of SgrA-F, which is in the energy keV band. Some parameters of the filaments are obtained from the references listed below. The last column of the table shows whether the counterparts associated with the filaments in radio bands have so far been found or not.
a Wang, Lu, & Gotthelf (2006).
b Park, et al. (2005).
c Yusef-Zadeh, et al. (2005).
d Yusef-Zadeh, et al. (2005).
e Wang, Lu, & Lang (2002).
| Region | Fx | Lx | Line E | E.W. | |||
|---|---|---|---|---|---|---|---|
| 10-13 erg cm-2 s-1 | erg s-1 | keV | keV | ||||
| E. C. | 1.4 (1.2, 1.6) | 1.0 (0.5, 1.2) | 6.1 (5.9, 6.6) | 8.1 (7.5, 8.4) | 6.42 (6.41, 6.43) | 0.75 (0.68, 0.83) | 112/135 |
| W. C. | 2.3 (1.6, 2.9) | 1.0 (0.4, 1.6) | 5.4 (5.0, 5.7) | 8.7 (7.8, 10.9) | 6.39 (6.38, 6.40) | 1.07 (0.94, 1.23) | 126/114 |
Note. — Spectral Model: (power law+gaussian). Relevant parameters are: : hydrogen gas column density; : photon index; : absorbed flux in keV band; : X-ray luminosity in keV band; : line center energy; : equivalent width of the line; : chi-square divided by the number of degree of freedom (d.o.f).