The 26 year-long X-ray light curve and the X-ray spectrum of the BL Lac Object 1E 1207.9+3945 in its brightest state
Abstract
Aims. We studied the temporal and spectral evolution of the synchrotron emission from the high energy peaked BL Lac object 1E 1207.9+3945.
Methods. Two recent observations have been performed by the XMM-Newton and Swift satellites; we carried out X-ray spectral analysis for both of them, and photometry in optical-ultraviolet filters for the Swift one. Combining the results thus obtained with archival data we built the long-term X-ray light curve, spanning a time interval of 26 years, and the Spectral Energy Distribution (SED) of this source.
Results. The light curve shows a large flux increasing, about a factor of six, in a time interval of a few years. After reaching its maximum in coincidence with the XMM-Newton pointing in December 2000 the flux decreased in later years, as revealed by Swift . The very good statistics available in the 0.5-10 keV XMM-Newton X-ray spectrum points out a highly significant deviation from a single power law. A log-parabolic model with a best fit curvature parameter of 0.25 and a peak energy at 1 keV describes well the spectral shape of the synchrotron emission. The simultaneous fit of Swift UVOT and XRT data provides a milder curvature () and a peak at higher energies ( keV), suggesting a different state of source activity. In both cases UVOT data support the scenario of a single synchrotron emission component extending from the optical/UV to the X-ray band.
Conclusions. New X-ray observations are important to monitor the temporal and spectral evolution of the source; new generation -ray telescopes like AGILE and GLAST could for the first time detect its inverse Compton emission.
Key Words.:
radiation mechanisms: non-thermal - galaxies: active - galaxies: BL Lacertae objects, X-rays: galaxies: individual: 1E 1207.9+39451 Introduction
BL Lac objects are thought to be radio-loud Active Galactic Nuclei (AGNs) observed in a direction very close to the axis of a relativistic jet outflowing from the inner nuclear region (Urry & Padovani (1995)). This interpretation could explain most of the characteristics of these sources like compact and flat-spectrum radio emission, superluminal motion revealed by VLBI imaging, high and variable radio and optical polarization, non-thermal continuum emission extending from radio to -ray frequencies, an almost featureless optical spectrum and the fast variability at all frequencies.
BL Lac objects are generally characterized by a double bump structure in the broad band Spectral Energy Distribution (SED). The low frequency bump is attributed to synchrotron radiation emitted by relativistic electrons in the jet; inverse Compton scattering by the same electron population on the synchrotron radiation is thought to be at the origin of the high frequency bump. The peak of the first bump may vary in a rather wide range of frequencies: from the IR/optical band for the low energy peaked BL Lacs (LBLs) to the UV/X-ray band for the high energy peaked BL Lacs (HBLs) (Giommi & Padovani (1994), Padovani & Giommi (1995)).
1E 1207.9+3945, also named BZB J1210+3929 in the recent Multifrequency Catalogue of Blazars (Massaro et al. 2007, www.asdc.asi.it/bzcat ) is one of the X-ray selected BL Lacertae objects of the Einstein Medium Sensitivity Survey (Gioia et al. (1990)). It was discovered as a serendipitous source located about five arc-minutes north of one of the most intensively studied AGNs, the bright Seyfert galaxy NGC 4151. For this reason 1E 1207.9+3945 has been observed on many occasions by all the imaging X-ray instruments that have operated since the Einstein observatory. Despite its relatively high redshift (z=0.615) HST was able to detect the bright (MR = 24.4) host galaxy which is of elliptical type (Scarpa et al. (2000)).
In this paper we report the long-term X-ray light curve which spans over 26 years. We also report and compare the spectral analysis of the most recent observations carried out by the XMM-Newton (Jansen et al. (2001)) and Swift (Gehrels et al. (2004)) satellites; we discuss the possibility to model the synchrotron emission of this source with a single log-parabolic model. The peak of the synchrotron component lies in the X-ray band, and for this reason the source can safely be classified as an HBL. We finally report the Spectral Energy Distribution (SED) of 1E 1207.9+3945 compiled from non-simultaneous multi-frequency archival data.
2 The long-term X-ray light curve
Because of its spatial proximity to the well known Seyfert Galaxy NGC 4151, 1E 1207.9+3945 has been observed by a large number of X-ray instruments on board several astronomical spacecrafts. We collected all available historical X-ray data from literature and we also added more recent results from XMM-Newton, Chandra and Swift observations.
Most of the available data were accessed through the ASI Science Data Center (ASDC) on-line services (www.asdc.asi.it). Data relative to Einstein IPC were taken from the 2E catalog (Harris et al. (1994)) while those relative to Einstein HRI come from the Einstein Observatory HRI source list (Giacconi et al. (1979)). Data from ROSAT PSPC were derived from WGACAT2 catalog (White, Giommi & Angelini (2000)); data from ROSAT HRI were obtained from the BMW catalog (Panzera et al. (2003)). We completed these informations with those relative to EXOSAT CMA reported in Giommi et al. (1990). All these measurements, expressed in cts/s, have been opportunely converted to monochromatic fluxes at 1 keV; each value has also been corrected for Galactic absorption adopting = 2.0 cm-2 , a value estimated from 21 cm measurements along the line of sight (Dickey & Lockman (1990)).
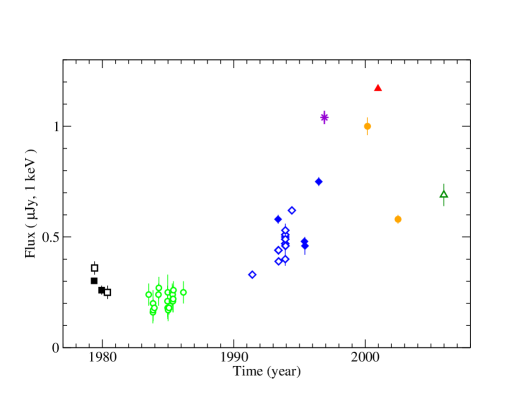
The MECS instrument on board the BeppoSAX satellite observed 1E 1207.9+3945 in July and December 1996. As Cusumano et al. (2001) found no relevant change in the source flux over this time interval, they performed a spectral analysis summing the four available observations in a single spectral file; we report the flux at 1 keV derived from the results of their spectral analysis. As regards the most recent observations (from XMM-Newton, Chandra and the latest by Swift) we performed data reduction and derived the flux at 1 keV directly from the spectral fit. The light curve thus obtained spans a very long time interval, more than 25 years, and is plotted in Fig. 1.
| Satellite | Instrument | Sequence | Readout | Date | Exposure | Net counts |
|---|---|---|---|---|---|---|
| number | mode | (s) | ||||
| XMM-Newton | EPIC-MOS1 | 0112830201 | Full Window | 22 Dec 2000 | 59361 | 34236 |
| (I) | Medium Filter | |||||
| XMM-Newton | EPIC-MOS1 | 0112830501 | Full Window | 22 Dec 2000 | 22092 | 12418 |
| (II) | Medium Filter | |||||
| Swift | XRT | 00035463001 | Photon Counting | 26 Dec 2005 | 10368 | 1218 |
The light curve is characterized by the following behaviour: the flux remained low (0.2-0.3 Jy) for a 10 year-long time interval during the ’80s, and then it increased during ’90s to a high state, maintaining a level around 1 Jy for about four years. The highest flux was detected by XMM-Newton by the end of 2000, and it is about a factor of six higher than the minimum. After reaching its peak, the source luminosity decreased in the latest years, with the flux at the epoch of the most recent Swift pointing (December 2005) at a level comparable to the one detected by ROSAT ten years earlier, about three times higher than the minimum. Superposed on this trend, flux variations of smaller amplitude ( 0.1 Jy) and much shorter time scales (even 1-2 days) have been put in evidence thanks to the very close sequence of observations (one day frequency) in December 1993 by the ROSAT satellite.
3 XMM-Newton observations
1E 1207.9+3945 was observed by XMM-Newton on 22 December 2000, by means of the EPIC-PN (Struder et al. (2001)) and EPIC-MOS (Turner et al. (2001)) CCD cameras, operating in “full window” frame with medium filters. We restricted our analysis to the EPIC-MOS data only because for other HBL sources the estimates of the spectral parameters were found consistent with those obtained from BeppoSAX and Swift observations (Tramacere et al. 2007, Massaro et al. 2007). We checked both MOS1 and MOS2 data, and after verifying the consistency between results we reported only those relative to MOS1. The pointing was splitted in two intervals, one significantly longer than the other; details are reported in Table 1. Both these observations were reduced adopting standard criteria and following the “User’s Guide to the XMM-Newton Science Analysis System (SAS)” (Issue 3.1) (Loiseau et al. (2004)) and “The XMM-Newton ABC Guide” (vers. 2.01) (Snowden et al. (2004)). Particular care was dedicated to the solar flares subtraction, as described in Tramacere et al. (2007a).
Photons for spectral analysis were extracted from a circular region with a radius of . The background spectrum was extracted from a circular region of size comparable to the source region, in a place where visible sources were not present. The Photon Redistribution Matrix and the Ancillary Region File were created for each observation, by using rmfgen and arfgen tasks of SAS.
To ensure the validity of Gaussian statistics we grouped data so that each new bin included at least 40 counts. Spectral analysis was carried out using XSPEC 11.3.2 (Arnaud et al. (1996)) in the 0.5–10 keV restricted energy range to avoid possible residual calibration uncertainties. We analyzed separately the two observations and we found best fit parameters consistent within the errors, indicating that the source spectrum did not change significantly on such a short time scale; we thus applied a simultaneous fit of the two spectra.
First, we fitted the two data sets using a single power law model:
| (1) |
with the hydrogen equivalent column density fixed at the Galactic value: we found and residuals showing evidence of an intrinsic curvature.
Repeating the fit with the same model and leaving free to vary, we found a fit statistical improvement () but the absorbing column density value resulted almost a factor of three (= 5.3 cm-2) higher than the Galactic one. All parameter values relative to the spectral analysis are reported in Table 2. We also used a broken power-law model with Galactic and found a good fit () with spectral photon indices a and a before and after the energy break E keV, respectively.
| Satellite | /d.o.f. | ||||||
|---|---|---|---|---|---|---|---|
| (1020 cm-2) | (10-3 ph cm-2 s-1 keV-1) | (keV) | (10-12 erg cm-2 s-1) | ||||
| XMM | 2.0 (fixed) | 1.740.01 | 2.100.01 | 3.8 | 1.23/376 | ||
| XMM | 5.30.4 | 1.920.03 | 2.210.02 | 3.6 | 1.07/375 | ||
| XMM | 2.0 (fixed) | 1.760.01 | 2.000.01 | 0.250.03 | 1.0 | 3.5 | 1.01/375 |
| XMM | 2.0 (fixed) | 1.760.01 | 2.030.01 | 0.18 (fixed) | 0.8 | 3.5 | 1.02/376 |
| Swift | 2.0 (fixed) | 0.960.03 | 1.910.04 | 2.8 | 1.34/52 | ||
| Swift | 7.91.7 | 1.220.08 | 2.160.09 | 2.5 | 1.09/51 | ||
| Swift | 2.0 (fixed) | 1.040.04 | 1.770.06 | 0.430.13 | 1.9 | 2.4 | 1.12/51 |
An alternative model that provides a good fit is given by the log-parabolic model (Massaro et al. 2004a ):
| (2) |
where is the spectral index (given by the log-derivative) at =1 keV and measures the spectral curvature. This spectral model is able to represent an intrinsic curved spectra with the addition of just one parameter to the single power law; it has been successfully applied to modelling the SED of other HBL sources like e.g. Mrk 421 (Massaro et al. 2004a ), Mrk 501 (Massaro et al. 2004b ), PKS 0548-322 (Perri et al. (2007)) and also a sample of HBLs detected at Tev energies (Tramacere et al. 2007b ). Moreover, it let estimate in a very simple way other interesting quantities, like the energy of the SED peak given by the following expression:
| (3) |
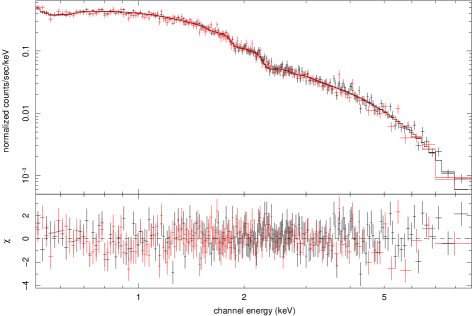
The log-parabolic model provides for 1E 1207.9+3945 a very good value ( = 1.01/375) and a curvature parameter () consistent with typical values obtained in the spectral analysis of other HBL sources (all parameter values are reported in Table 2). Figure 2 reports the spectrum and the residuals of the analysis in the whole range (0.5–10 keV).
To estimate the significance of the improvement of the power law model with free and the log-parabolic model with respect to the power law model with Galactic , we applied an F-test. In both cases we obtained very low values ( and , respectively) so that the two alternative models are significantly better than the power law with a Galactic value. The log-parabolic model has the additional advantage that it does not require any intrinsic absorption, originating in the innermost nuclear environment or in the host galaxy, to justify the spectral curvature.
4 Swift observation
1E 1207.9+3945 was observed in the field of NGC 4151 on 26 December 2005 with both the UVOT (UltraViolet-Optical Telescope, Roming et al. (2005)) and XRT (X-Ray Telescope, Burrows et al. (2005)) instruments.
The XRT observation was carried out using the most sensitive Photon Counting readout mode (see Hill et al. (2004) for a description of readout modes). Data were reduced with the XRTDAS software package (version 2.1.2) developed at the ASDC (Capalbi et al. 2005) and distributed within the HEASOFT 6.3 package by the NASA High Energy Astrophysics Archive Research Center (HEASARC).
We used the ximage task to detect the source count rate and the centroid, and to choose a nearby source-free region in order to extract the background spectrum. The source count rate was cts/s, a value not high enough ( cts/s) to determine photon pile-up occurrence. Spectral data were then extracted in a circular region within 20 pixels radius (1 pixel = ) from the centroid; the background spectrum was estimated in a circular region of 50 pixels radius.
We then used the xrtproducts task to obtain all the files necessary to the spectral analysis; the exposure map was taken into account to correct for vignetting, CCD hot and damaged pixels. In the spectral file, instrumental channels were combined to include in each new energy bin at least 20 counts. The spectral analysis was carried out in the 0.3–10 keV energy range using XSPEC 11.3.2.
Following the same criteria described in Sect. 3 we first fit the data using a single power law model, both fixing the hydrogen equivalent column density to the Galactic value and leaving it free to vary (see Table 2). In the second case we obtained, as expected, a better value ( = 1.09/51 vs 1.34/52) but an value almost a factor of four (= 7.9 cm-2) higher than the Galactic one. Again we fit the log-parabolic model with Galactic to data, obtaining a comparable improvement ( = 1.12/51) with no extra absorption needed (see Table 2). The F-test gives a probability of ( 3 ) that this improvement is due to chance.
The spectrum and the residuals are plotted in Fig. 3. The distinctive feature of this plot is a dip around 3 keV followed by an apparent raising at higher energies. New Swift observations with an exposure time longer than 10 ks would help reducing the fluctuations characteristic of this spectrum.

4.1 UVOT data reduction
The UVOT instrument obtained series of images in each of the lenticular filters . The data analysis was performed using dedicated tasks included in the HEASOFT 6.3 package. Each series was summed up with the uvotimsum task to obtain a single frame in each filter; photometry was then performed using the uvotsource task.
Following the UVOT Team prescriptions (Immler et al. (2006)) we chose an aperture radius of 2 for doing photometry, independently of the image filter; then we made an aperture correction to transfer the obtained magnitude to the standard photometry aperture that was used to obtain the photometric zero point, which is 6 for filters and 12 for the filters. To achieve this purpose we selected a sample of stellar sources with a high signal-to-noise ratio and we calculated the difference between the magnitudes measured with the two different radii. After deriving a mean value for the aperture correction in each filter we finally obtained the corrected magnitudes for 1E 1207.9+3945.
The background region was chosen in the form of an annulus around the extraction region, with inner and outer radii taken opportunely in order to avoid the inclusion of spurious sources, particularly numerous in filter frames; typical values are respectively 18 and 23. Then the obtained magnitudes were de-reddened using the value of mag (Schlegel et al. (1998)) and adopting the extinction curve given in Seaton (1979) with R, and finally converted to specific fluxes; results are reported in Table 3.
| Filter | Magnitude | Specific flux |
|---|---|---|
| (mag) | (Jy) | |
| V | 19.76 0.19 | 39.2 6.9 |
| B | 20.30 0.24 | 28.9 6.4 |
| U | 18.90 0.09 | 36.4 3.0 |
| W1 | 18.85 0.08 | 27.3 2.0 |
| M2 | 18.87 0.09 | 26.0 2.1 |
| W2 | 18.98 0.08 | 24.6 1.8 |
5 Optical spectrum and host galaxy contribution
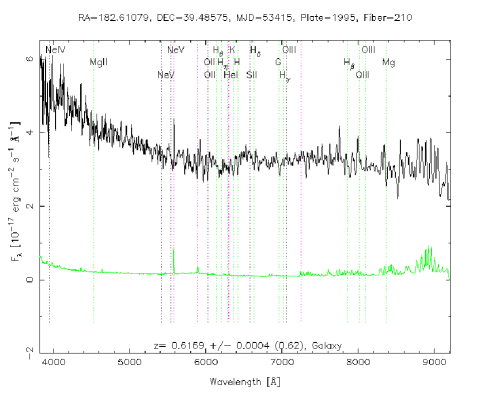
1E 1207.9+3945 is present in the POSS-I and POSS-II plates at a very faint level, very close to the plate sensitivity limits (B and R ), and no appreciable variation is apparent between the two epochs. The source is also present in the Sloan Digital Sky Survey (SDSS) and has been observed on 17 February 2004; also in this case no significant variation can be found comparing magnitudes in g and r filters to magnitudes in the POSS B and R filters. The SDSS optical spectrum (http://cas.sdss.org) is reported in Fig. 4: it does not show evidence of prominent lines and presents a slope change around Å. This variation can be interpreted as the sign of the combined BL Lac and host galaxy emission: while the first one dominates at higher frequencies, its contribute is overwhelmed by the host galaxy at higher wavelengths.
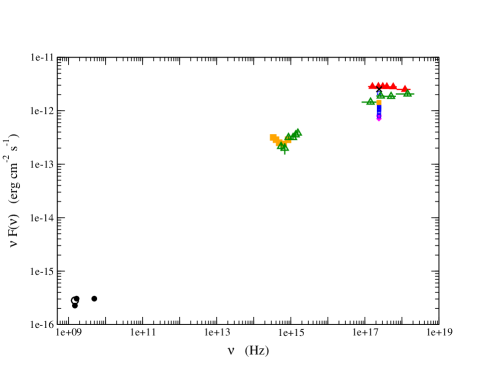
Host galaxy contribution clearly emerges also from the inspection of the Spectral Energy Distribution (SED) in the frequency interval Hz (see Fig. 5). To verify the agreement between the informations in the optical spectrum and in the SED we graphically estimated the slope variation in the two different plots. At this purpose we divided the SDSS spectrum at 6000 Å in two intervals and graphically estimated the slope change on both sides. Analogously, we took SDSS points in the SED and splitted them in two sets, corresponding to the IR-optical (z, i, r) and optical-UV (g, u) filters; we traced a line interpolating the two different sets and estimated their slope and the relative variation. The same value of that we found in both cases supports the interpretation that the host galaxy is mostly responsible for the infrared emission visible in the SED.
6 Discussion
Adding to multi-frequency archival data the results of our analysis we built the radio to X-ray SED of 1E 1207.9+3945 (Fig.5) which follows the characteristic trend of extreme HBL sources (Padovani & Giommi (1995)) with the synchrotron emission covering the entire frequency interval and peaking well into the X-ray band. The inverse Compton component is not detected and therefore is expected at higher energies.
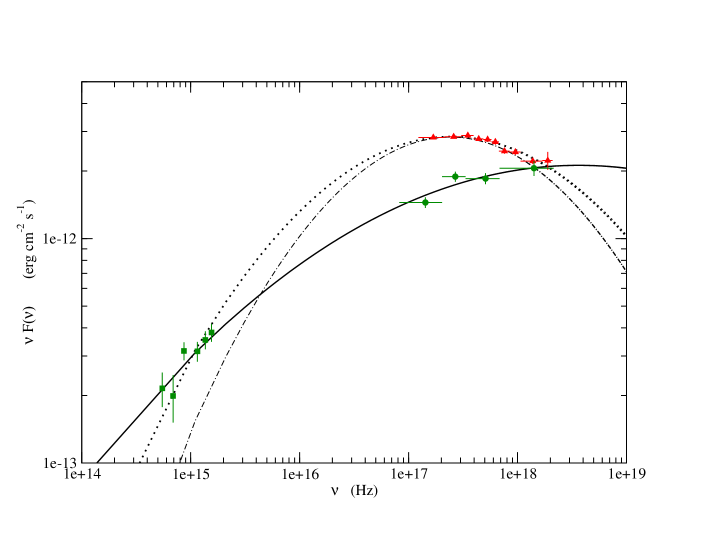
The Swift satellite is sensitive both in the X-ray and in the optical-ultraviolet band. This provides the opportunity to test if the Spectral Energy Distribution of a source like 1E 1207.9+3945 can be explained by a single synchrotron component, or if multiple emission components are present. For this purpose we first fitted a log-parabolic model to simultaneous Swift XRT and UVOT fluxes (solid line in Fig. 6) and obtained a rather low value for the curvature parameter () in contrast with the one obtained by fitting XRT data only, as reported in Table 2; the energy peak lies at about 15 keV or more. Comparing these results with those from XMM-Newton, Swift evidently caught 1E 1207.9+3945 in a different state of activity, characterized by a milder curvature and a peak of the synchrotron component shifted to higher energies. Anyway firm conclusions cannot be drawn due to a relatively poor statistics and to the fact that the found value likely lies at energies higher than 10 keV, outside the range of Swift XRT.
Aware of the limits of using non simultaneous observations for a variable source, yet we verified if Swift UVOT and XMM-Newton MOS1 data are compatible with a log-parabolic model. We took points representing XSPEC model of observation I and fit them on a wider frequency interval (dot-dashed line in Fig. 6): UVOT points are sistematically above the extrapolation of the log-parabolic model. We took care to compare this result with the one obtained by fitting directly X-ray rebinned data and obtained an almost coincident result. Then we fitted both data sets with a log-parabola (dotted line in Fig. 6) and estimated the curvature parameter: we obtained , a value at about 2 of the one derived fitting only XMM-Newton data (see Table 2). At this point we tested the log-parabolic model with fixed at 0.18 and found , a value practically coincident with the one obtained leaving free to vary, with only a small difference in the parameter. This result encouraged us in concluding that a single synchrotron component is in a good agreement with the emission observed.
1E 1207.9+3945 is certainly worth monitoring in the next years. New observations in the X-ray band would add essential information to the light curve behaviour: if any kind of regularity in flux increasing and fading should emerge, it would be possible to put physical constraints to establish the nature of the mechanism responsible for these variations. Moreover, observations with instruments which extend to higher energies than XRT, like those on board Suzaku, would extend the known Spectral Energy Distribution and would allow us to obtain a better parametrization of the spectral curvature. Finally, 1E 1207.9+3945 may be an interesting target for AGILE and the forthcoming GLAST -ray mission which could detect for the first time the inverse Compton component of this HBL source.
Acknowledgements.
We wish to thank Enrico Massaro for useful discussions and helpful comments, Gino Tosti and Simonetta Puccetti for hints in Swift UVOT and Chandra data analysis respectively. The authors acknowledge the financial support by the Italian Space Agency (ASI) for ASDC and for the Physics Department of Università di Roma “La Sapienza”.References
- Arnaud et al. (1996) Arnaud, K.A., 1996, “Astronomical Data Analysis Software and Systems V”, eds. Jacoby G. and Barnes J., p17, ASP Conf. Series volume 101
- Burrows et al. (2005) Burrows, D.N. et al., 2005, Space Science Rev., 120, 165
-
Capalbi et al. (2005)
Capalbi, M., Perri, M., Saija, B., Tamburelli, F., Angelini, L., 2005,
The Swift XRT Data Reduction Guide,
http://heasarc.gsfc.nasa.gov/docs/swift/analysis/xrt_swguide_v1_2
.pdf - Cusumano et al. (2001) Cusumano, G., Mineo, T., Giommi, P. 2001, Astro. Lett. and Communications, 40, 109
- Dickey & Lockman (1990) Dickey, J. & Lockman, F., 1990, A&A, 28, 215
- Gehrels et al. (2004) Gehrels, N., Chincarini, G., Giommi, P. et al., 2004, ApJ, 611, 1005
- Giacconi et al. (1979) Giacconi R. et al., 1979, The Einstein Observatory (HEAO-2)
- Gioia et al. (1990) Gioia, I.M., Maccacaro, T., Schild, R.E. et al., 1990, ApJS, 72, 567
- Giommi et al. (1990) Giommi, P., Barr, P., Garilli, B. et al., 1990, ApJ, 356, 432
- Giommi & Padovani (1994) Giommi, P. & Padovani, P., 1994, MNRAS, 268, L51
- Harris et al. (1994) Harris D.E. et al., 1994, SAO HEAD CD-ROM Series I (Einstein), Nos 18-36
- Hill et al. (2004) Hill, J.E. et al., 2004, Proceedings of SPIE, Vol. 5165, 217
- Immler et al. (2006) Immler S. et al., 2006, “The Swift UVOT Software guide” (version 2.0)
- Jansen et al. (2001) Jansen, F., Lumb, D., Altieri, B. et al., 2001, A&A, 365, L1
- Loiseau et al. (2004) Loiseau, N., et al., 2004, “User’s guide to the XMM-Newton Science Analysis System” (issue 3.1)
- (16) Massaro, E., Perri, M., Giommi, P., Nesci, R., 2004a, A&A, 413, 489
- (17) Massaro, E., Perri, M., Giommi, P., Nesci, R., Verrecchia F., 2004b, A&A, 422, 103
- (18) Massaro, E., Sclavi, S., Giommi, P. et al., 2007, www.asdc.asi.it/bzcat
- Massaro et al. (2007) Massaro, F., Tramacere, A., Cavaliere, A., Perri, M., Giommi, P., 2007, A&A, submitted
- Padovani & Giommi (1995) Padovani, P. & Giommi, P., 1995, ApJ, 444, 567
- Panzera et al. (2003) Panzera, M.R., Campana, S., Covino, S., 2003, A&A, 399, 351
- Perri et al. (2007) Perri, M., Maselli, A., Giommi, P. et al., 2007, A&A, 462, 889
- Roming et al. (2005) Roming, P.W.A. et al. 2005, Space Science Rev., 120, 95
- Scarpa et al. (2000) Scarpa, R., Urry, C.M., Falomo, R. et al., 2000, ApJ, 532, 740
- Schlegel et al. (1998) Schlegel, D.J., Finkbeiner, D.P. & Davis, M., 1998, ApJ, 500, 525
- Seaton (1979) Seaton, M.J. 1979, MNRAS, 187, 73
- Stocke et al. (1985) Stocke, J.T., Liebert, J., Schmidt, G., 1985, ApJ, 298, 619
- Snowden et al. (2004) Snowden, S. et al. 2004, “The XMM-Newton ABC Guide” (version 2.01)
- Struder et al. (2001) Struder, L. et al. 2001, A&A, 365, L18
- (30) Tramacere, A., Massaro, F., Cavaliere, A., 2007a, A&A, 466, 521
- (31) Tramacere, A., Giommi , P., Massaro, E. et al., 2007b, A&A, 467, 501
- Turner et al. (2001) Turner, M.L.J. et al., 2001, A&A, 365, L27
- Urry & Padovani (1995) Urry, C.M. & Padovani, P., 1995, PASP, 197, 803
- Voges et al. (1999) Voges, W., Aschenbach, B., Boller, T. et al., 1999, A&A, 349, 389
- White, Giommi & Angelini (2000) White N.E., Giommi P., Angelini L., WGACAT 2000, http://wgacat.gsfc.nasa.gov/wgacat/wgacat.html