Study of the electron trigger efficiency
of the CMS Experiment
using test beam data
Abstract
A study of the electron identification and selection efficiency of the L1 Trigger algorithm has been performed using the combined ECAL/HCAL test beam data. A detailed discussion of the electron isolation and its impact on the selection efficiency is presented. The L1 electron algorithm is studied for different beam energies and the results indicate that efficiencies of 98% or more can be achieved for electrons with energies between 15 and 100 GeV. The fraction of charged hadrons with energies from 3 up to 100 GeV rejected by the L1 electron trigger algorithm is estimated to be larger than 93%.
keywords:
Calorimeters; Trigger concepts and systems (hardware and software)1 Introduction
The CMS Level 1 (L1) trigger aims at reducing the event collection rate to a maximum of 100kHz set by the High Level Trigger (HLT) processing capacity, while keeping high efficiency for potentially interesting physics objects. The calorimeter system provides triggers based upon the energy profile deposited in the CMS calorimeters by objects such as electrons, photons and jets. The design of the L1 calorimeter algorithms was based on fast detector simulation and validated using full detector simulation [1]. In this note, a first study is presented concerning the estimate of the selection efficiency of the L1 trigger algorithm for electrons using combined ECAL/HCAL test beam data.
This note is organized as follows: Section 2 contains a brief overview of the conceptual design and implementation of the L1 electron trigger algorithm and Section 3 describes the experimental setup and the data selection. In Section 4 the impact of the isolation criterion on the electron efficiency is addressed. Results on electron selection efficiency are presented in Section 5, while the results on charged hadron rejection of the L1 electron/photon algorithm are presented in Section 6. Finally, conclusions are given in Section 7.
2 L1 Electron Trigger Algorithm
2.1 Overview of Conceptual Design
The CMS electromagnetic calorimeter (ECAL) is made of crystals, with a radiation length of 0.89 cm and a Moliere radius of 2.19 cm. The ECAL is composed of a Barrel covering and two Endcaps covering . The Barrel is divided in two halves, each made of 18 supermodules containing 1700 crystals each. The lateral transverse size of the Barrel crystals varies slightly according to the rapidity position. The Endcaps consist of two detectors, a preshower detector (ES) followed by calorimetry. Each Endcap is divided in two halves, or “Dees”, and consists of 7324 identically shaped crystals grouped in mechanical units of crystals (supercrystals). The Barrel and Endcap crystals are mounted in a quasi-projective geometry so that their axes have a small angle (~ 3º) with respect to the vector from the nominal interaction vertex, in both the and projections. The CMS hadronic calorimeter (HCAL) is organized in four subsystems: Barrel (HB), Endcap (HE), Outer (HO) and Forward (HF). The HB and HE are joined hermetically, surround completely the ECAL and are also mounted on a quasi projective-geometry. The HB is an assembly of two half Barrels, each composed of 18 identical wedges in . Each wedge is composed of flat brass alloy absorber plates. The innermost and outermost absorber layers are made of stainless steel. There are 17 active plastic scintillator tiles interspersed between the stainless steel and brass absorber plates. The HE is composed entirely of brass absorber plates in a 18-fold geometry matching that of the Barrel calorimeter. In the HE there are 19 active plastic scintillator layers.
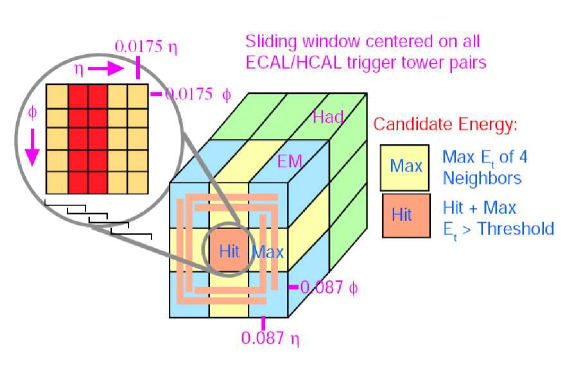
The L1 electron/photon algorithm uses a trigger tower sliding window technique to find electron/photon candidates in the full region covered by the CMS electromagnetic calorimeter. The sliding window is centered on any ECAL/HCAL trigger tower pair. In the Barrel, one ECAL trigger tower corresponds to an array of crystals () and it is divided into strips of 5 crystals with common and different values. In the Endcaps, the ECAL trigger towers are composed of several pseudo-strips with variable shape and may extend over more than one supercrystal. For <1.74, the granularity of the Endcap ECAL towers is the same as in the Barrel and the boundaries of each HCAL trigger tower follow the corresponding ECAL trigger tower. In the Endcap region with >1.74 one HCAL trigger tower has twice the dimension [2]. The energy readout of one HCAL trigger tower is longitudinally segmented into up to three elements, depending on the region.
An illustration of the algorithm is shown in Figure 1. The algorithm estimates the candidate transverse energy by summing the in the central trigger tower (HIT Tower) with the maximum of its four broad side neighbor towers. Two independent streams of candidates are considered : isolated and non-isolated electron/photons. An electromagnetic object is included in the non-isolated stream if it is not vetoed by the following two discriminators:
-
•
Fine Grain (FG) veto : The lateral extension of the energy deposit of an electromagnetic shower in the ECAL is typically narrow, since the Moliere radius and the crystal transverse dimensions are similar. In the CMS experimental setup, due to the effects of magnetic field, bremsstrahlung and photon conversion in the tracker material, the shower spreads along and in the ECAL. An efficient collection of all the particle energy requires a summation of the crystal energy deposits along the bending direction of the magnetic field. One must also take into account a smaller spread along the direction, due to the intrinsic shower transverse development and the ECAL entry point. The evaluation of the FG veto proceeds in the following steps. First, the energy released in each pair of adjacent strips is computed for each trigger tower. Then, the strip pair with the maximum energy is found. The total energy released in the trigger tower is also computed. Next, the ratio of the strip pair with maximum energy to the total energy, the Fine Grain ratio , is evaluated. Finally, is compared to a threshold and is compared to a minimum energy threshold . If and , a FG veto bit is set for the candidate. A typical value for is . The adequate value for is discussed in Section 4. This definition of the algorithm applies to the ECAL Barrel, whereas the Endcap different geometry implies a different algorithm.
-
•
Hadronic Calorimeter (HAC) veto : The longitudinal profile of the electron shower is measured by comparing the energy deposited in the ECAL tower to the energy deposited in the corresponding HCAL tower (. Indeed, the HAC veto bit is set if the energy ratio is larger than a given threshold, , and if there is a significant activity in the ECAL trigger tower, that is, if . This requirement suppresses background from charged pions that deposit a non negligible amount of energy in the ECAL. Typical values for and are 0.05 and 3 GeV, respectively. If , the HAC veto is not applied. Thus minimum ionizing pions not interacting in the ECAL are not rejected by this veto alone.
The non-isolated electron/photon stream uses the output of the two previous sub-algorithms evaluated only for the HIT tower. The isolated stream requires additional information from the eight nearest neighbors around the HIT trigger tower. A candidate is included in the isolated stream if it is not rejected by the previous two vetoes and, furthermore, if it is not vetoed by the following two conditions:
-
•
Combined Fine Grain and HAC veto isolation (Neighbor veto) : For each nearest neighbor tower of the HIT tower the FG veto and HAC veto bits, as defined earlier, are computed to yield a combined veto bit. In the current implementation of the algorithm, the output of the combined veto is a simple logical OR of the two vetoes. The candidate is not included in the isolated stream if any FG or HAC veto bit of the eight nearest neighbor towers is set. That is, a candidate is considered isolated if it passes both the FG and HAC veto on all eight nearest neighbors.
-
•
ECAL isolation veto : From the eight nearest neighbor towers of the HIT tower, all possible sets of five contiguous towers with three of them placed in the corners of the window are formed. There are four such sets, represented in Figure 1 by orange “L-shaped” lines. At least for one of these sets, all towers must have energy below a given threshold for the candidate to be accepted. The isolation criterion is required only in one corner to prevent self-veto of the electron candidates due to a possible leakage of energy to the nearest neighbor tower. Typical values of are well above the trigger tower noise level, e.g, 1.5 GeV.
2.2 Summary of L1 Hardware Implementation and Dataflow
A detailed description of the hardware implementation and dataflow of the L1 electron/photon algorithm can be found in Refs. [3] and [2]. Here only a brief outline is presented.
The FG bit is evaluated for each trigger tower in the frond-end electronics by the Trigger Primitive Generator (TPG) sub-system, which is implemented in a FENIX ASIC chip. Both and are compared to two thresholds, which can be set to different values for each run. The FG bit is then calculated using a lookup table (LUT) whose inputs are the results of the previous comparisons. This setup provides limited flexibility to make the FG bit dependent on . Illustration of part of the code is presented in Appendix A. Due to hardware design, it is not possible to set different thresholds for the individual crystals in order to suppress very low energy deposits comparable to noise level. The hardware implementation of the FG veto employs strip and tower transverse energy instead of energy; however the data used in this study was collected in the region of , where , so is close to unity and the residual difference is further decreased by the ratio.
The HAC veto, the Neighbor veto, and the ECAL isolation portions of the algorithm are implemented in the Regional Calorimeter Trigger (RCT). Two VME cards are used, the Receiver and the Electron ID card. The Receiver card receives and , which are the ECAL and HCAL trigger tower energy sent via serial links from the calorimeter TPGs on an eight-bit, compressed, non-linear scale. Additionally, the FG bit from the ECAL TPG is also received. These quantities are fed into a LUT whose output consists of seven bits of transverse energy (e.g. ) and one bit, nominally known as the electron veto bit, which is a convolution of the HAC and FG veto bits. Again, all these bits are evaluated separately for each trigger tower. The Electron ID card receives these bits from all towers in each trigger tower region (calorimeter region) and : 1) estimates the candidate transverse energy, 2) makes the OR of of the eight nearest neighbors, and 3) evaluates the ECAL isolation veto bit. It can find two possible electron candidates in each calorimeter region, corresponding to two separate streams, with the nominal designation of isolated or non-isolated .
The two streams mentioned earlier are exclusive. Trigger cuts are not applied to the electron/photon candidates that saturate the L1 linear scale ( ~ 63.5 GeV), which are treated as if they were isolated. The thresholds of the electron algorithm are set for all towers at the same values by default, but can be programmed differently.
In each calorimeter region, the highest electron/photon candidates, either non-isolated or isolated, are separately found. The eight candidates of each stream found in a regional trigger crate are further sorted by transverse energy. The four highest candidates of each category from each crate are then transferred to the Global Calorimeter Trigger where only the top four candidates are retained for processing by the CMS global trigger.
3 Combined ECAL/HCAL test beam in the H2 experimental area
3.1 Detector Configuration and Beam Conditions
In 2006, a fully instrumented ECAL supermodule (SM09) was assembled together with one HCAL Barrel wedge and three HO rings in the H2 test beam line area at CERN, forming one entire slice of the calorimeter, in a configuration similar to the final CMS experimental setup. The main difference with respect to the operation in the CMS experiment is the absence of the tracker material in front of the ECAL crystals and the absence of the external magnetic field. The detector was exposed to beams of charged hadrons and electrons originating from the collision of 400 GeV/c protons with production targets. The detectors were mounted on a moving table to allow changing the relative direction of the beam with respect to the detector. The beam line operated in two energy ranges. In the very low energy mode, electrons and charged hadrons were produced with momenta between 1 and 9 GeV/c. In the high energy mode, electrons were produced with momenta between 15 and 100 GeV/c and charged hadrons with momenta between 15 and 350 GeV/c. The charged hadron beam contained an admixture of pions, kaons, protons and antiprotons, whose composition varied with the beam momentum [4]. At low momentum, there was also a significant contamination of the hadron beam by electrons and muons. At the highest momenta, contamination of the electron beam by pions was larger. The studies were performed using electron samples with beam energies of 9, 15, 20, 30, 50 and 100 GeV and hadron samples with beam energies of 3, 5, 7, 9, 15, 20, 30, 50 and 100 GeV.
3.2 Electronic’s Noise
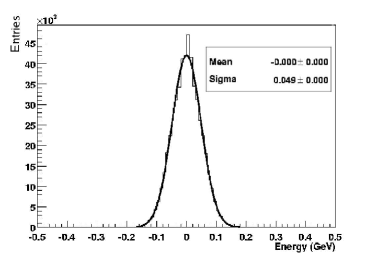
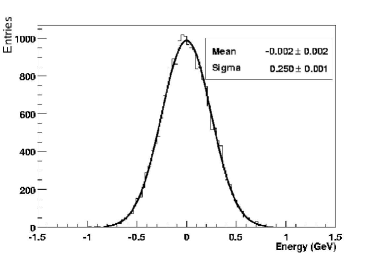
The electronic’s noise was estimated by measuring the energy deposits of the individual calorimeter channels in data taken while the beam was not impinging on the detector. The distribution of the average energy deposit per crystal for the innermost ECAL module in of the supermodule ( crystal array in ) is shown in Figure 2 (left). The estimated standard deviation of the fitted Gaussian distribution indicates a ~ 50 MeV, close to the result presented in an independent study [4] performed in the same experimental conditions. Figure 2 (right) shows the distribution of the average energy deposit per ECAL trigger tower in the same region. The estimated ~ 250 MeV is consistent with the result expected from the noise sum of 25 independent crystal channels that constitute a trigger tower. This value is different from the expectation of the electronic’s noise contribution for the ECAL TPG, due to the TPG linearization and scale transformation of ECAL data and digitization effects. The electronic noise of the HCAL readout energy is channel-dependent, as can be seen in Figures 3a and 3b, where the distribution of the HCAL energy for two different trigger towers is shown. In Figure 3c the distribution of the HCAL energy per trigger tower averaged over all the trigger towers of the first module is presented . The estimated rms is ~ 200 MeV.
 |
 |
a)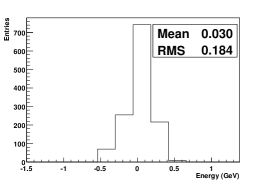
|
b)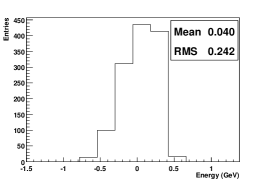
|
c)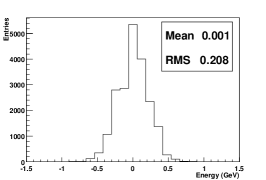
|
3.3 Calibration
In this study the HCAL Barrel calibration constants obtained with 50 GeV/c electrons were used [4]. The calibration was performed before the ECAL supermodule was mounted in front of the HCAL detector, with the electron beam directed at the center of each tower. Calibration constants of the ECAL supermodule obtained from data collected with a beam of 50 GeV/c electrons pointing to a grid of selected crystals were used. The crystal calibration constants were calculated by minimizing the difference between the nominal electron energy and the energy measured in a crystal array (S25) centered around the most energetic crystal, using a matrix inversion technique [5]. This method performs crystal inter-calibration and sets the global energy scale at the same time. It is well suited to in situ calibration as it will be performed in the CMS experiment. The signal amplitude measured in each crystal was reconstructed using specific weights calculated for the ECAL supermodule SM09, according to the method described in Ref.[6]. The calibration samples and the data used in this study are independent. Despite the non-compensating nature of the CMS calorimeter, no corrections to the ECAL and HCAL calibrated energies were applied to make the combined calorimeter response linear with energy.
3.4 Data Selection
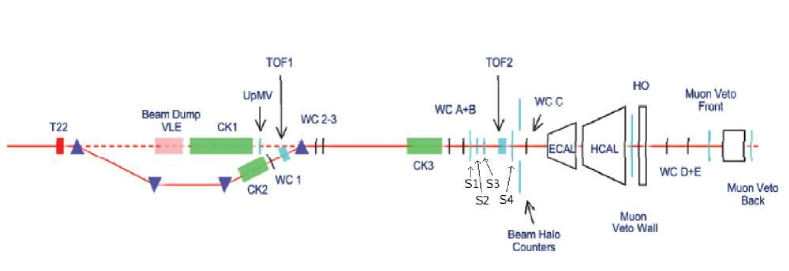
A schematic layout of the H2 test beam experimental setup is shown in Figure 4. In order to reduce spurious beam contamination, the H2 test beam experimental setup included several detectors dedicated to particle identification and beam cleaning, placed along the beam line before the ECAL/HCAL detectors. Four scintillation beam halo counters, arranged such that the beam passed through a opening, provided effective rejection of beam halo and large-angle particles that originated from interactions along the beam line. Additionally, requiring a single hit in the three scintillation counters used as trigger (S1*S2*S4 coincidence) allowed further rejection of multiple particle events. Energetic muons were tagged by large scintillation counters placed well behind the calorimeters. Soft muons were vetoed using an 80-cm thick iron block inserted in front of the last muon counter and a muon veto wall, consisting of 8 individual scintillations counters, placed behind the HCAL Barrel.
In the low beam momentum mode, electrons and hadrons were discriminated using the signal from CK2, a threshold counter, set to tag electrons only. At the lowest beam momenta ( 3 GeV/c ), another counter, CK3, provided an electron double-tag. Although the signals from CK3 and two time-of-flight counters could discriminate between pions, kaons and protons, the information was not used in this study. In order to select electron events, muon and hadron vetoes were required, whereas to select hadron events, muon and electron vetoes were required, but no hadron discrimination was applied.
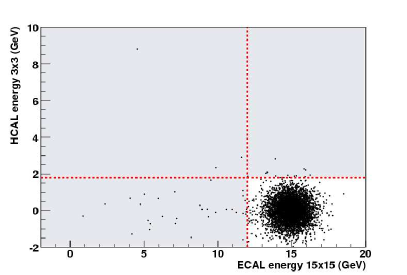
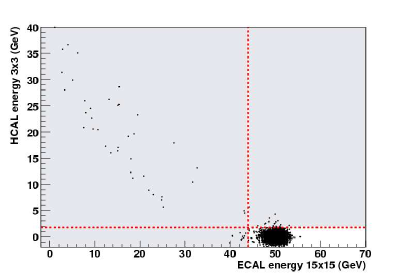
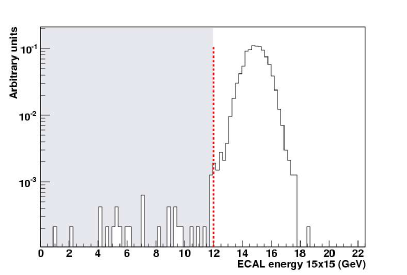
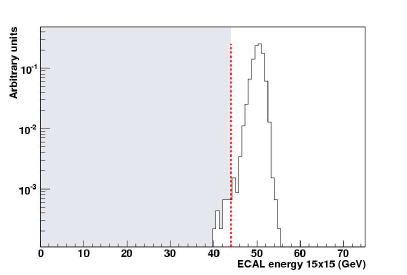
In the high energy range, electron events were selected by applying relaxed cuts on the ECAL energy versus HCAL energy plane as follows. In order to reduce the bias due to energy containment effects, the energy was measured in a large area of the ECAL detector, composed of an array of crystals, and in the corresponding HCAL towers. There was no evidence of energy leakage of electrons to the HCAL compartment for electrons with energies up to 100 GeV. Therefore, events were required to have less than 1.8 GeV measured in HCAL (equivalent to 3rms of the HCAL noise distribution for a trigger tower region, assuming no noise correlation between towers). Residual muon contamination was suppressed imposing a lower limit on the measured ECAL energy of 2 GeV (the most probable value of the distribution of the energy deposition of minimum ionizing particles in the ECAL is ~ 300 MeV). Furthermore, a higher but still loose lower limit was set on the measured ECAL energy, with the intent of suppressing a small beam contamination from other particles that interacted in the ECAL and left almost no energy in HCAL. The value of this lower energy limit depends on the beam nominal energy and is determined by the constraint to retain all the events within a 3interval centered around the most probable value of the energy distribution. The event selection based on ECAL/HCAL energy cuts is illustrated in Figure 5 for 15 and 50 GeV beam energy. In Figure 6 it is shown the ECAL energy measured in crystal array imposing HCAL energy < 1.8 GeV. In some events two well separated electromagnetic clusters could be found, possibly originating from electron bremsstrahlung or decays. An example is shown in Figure 7. The fraction of events with such topology depends on the data samples: for one 9 GeV electron data sample it is ~ 5%, while for one 50 GeV electron data sample it amounts to 18%. To systematically reject those events, electromagnetic clusters were reconstructed using the CMS Island algorithm [7], with an energy threshold for the seeds of 1 GeV. The Island algorithm makes electromagnetic clusters from series of connected crystals containing energy deposits which decrease monotonically starting from the highest energy and non adjacent seed crystals. Therefore the number of clusters found correspond to the number of local maxima in the array of crystal energy deposits. Only events with one cluster were selected.
 |
 |
 |
 |
4 Impact of energy leakage in electron identification
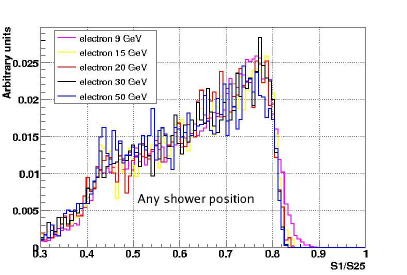
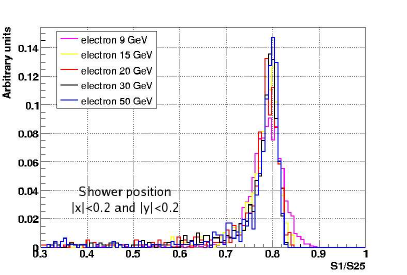
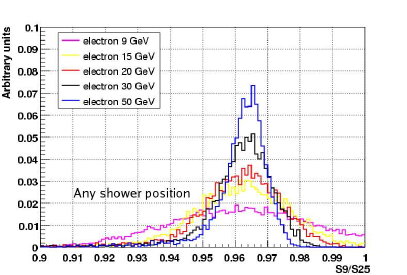
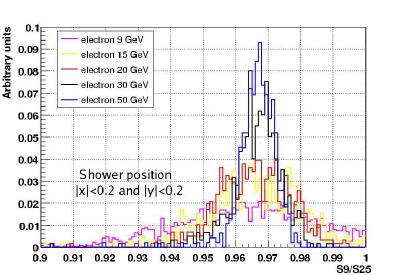
Electron showers deposit their energy in several crystals in the ECAL. To reconstruct the electron energy one has to sum the energy deposited in clusters of adjacent crystals. In test beam conditions, energy sums of fixed arrays of crystals centered on the crystal having the maximum energy give the best energy resolution [8]. Furthermore, the energy fraction contained in such clusters varies with the shower position. The reconstructed energy fraction is maximum when the shower is near the geometric center of the crystal, although not exactly at the center due to the quasi-projective geometry of the ECAL crystals. In Figure 8 plots are shown for the ratio of the energy measured in a single crystal (S1, top) and a crystal array (S9, bottom) to the energy measured in a crystal array (S25), for different beam energies. To estimate the shower position a weighted mean of the crystal’s position is used. The weights are given by the logarithm of the ratio of the crystal energy to the total energy measured in a crystal array centered on the most energetic crystal. We have chosen a (X,Y) coordinate system, where X is parallel to and Y is parallel to ; a crystal has a front-face size and the center of the most energetic crystal in each event is at . In Figure 8, left panels refer to all events and right panels refer only to events where the shower is closer to center of the most energetic crystal, with and . In the top left panel one can see that the S1/S25 energy fraction, regardless of the shower position, is lower than ~ 80% for all beam energies. Constraining the shower position to the central region of the crystal, the lower tail of the energy fraction distribution decreases significantly (Fig. 8, top right). The energy ratio S9/S25 is closer to one, peaked at 96–97% and its spread is much smaller (Fig. 8, bottom left). The decrease of the spread of the energy fraction contained in the cluster as the beam energy increases is correlated to the energy resolution of the ECAL, which improves with energy.
 |
 |
 |
 |
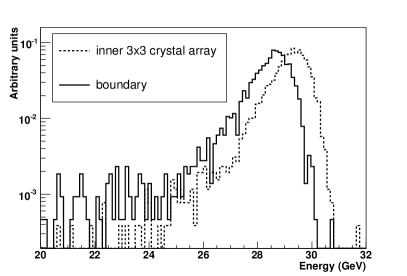
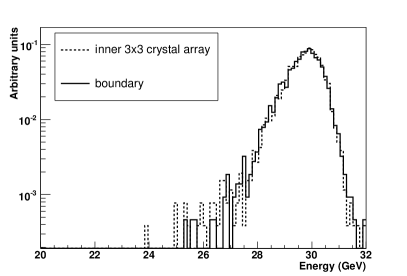
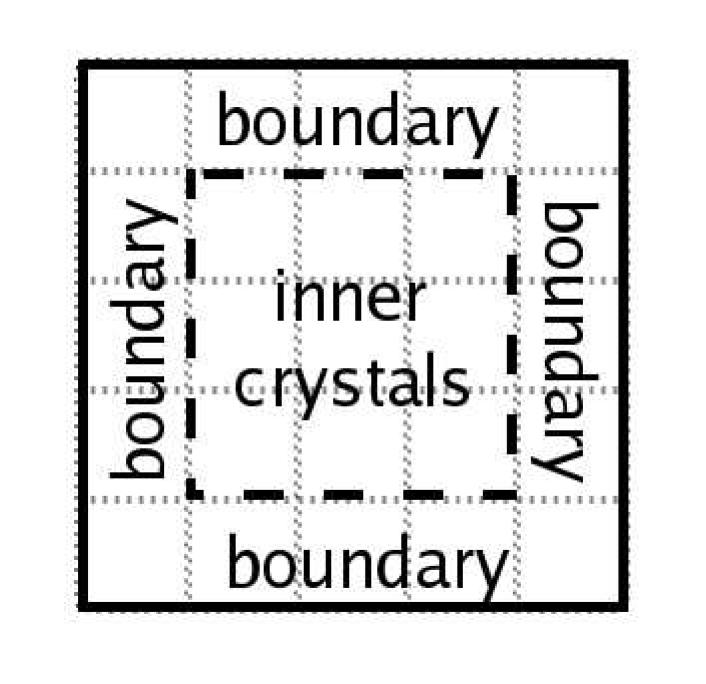
The energy measured in a single ECAL trigger tower depends on the impact position of the incident electron. In Figure 9 (left) the energy response of a single trigger tower for events in which the most energetic crystal is located inside (dotted line) or outside (solid line) the inner crystal array of the HIT tower (as defined in right panel of Figure 13) is shown for an electron beam sample with a nominal energy of 30 GeV. An energy leakage is found when the shower maximum energy is deposited near the boundary of the trigger tower. Furthermore, the energy resolution for this class of events is also degraded. Adding the energy measured in the HIT tower to the energy measured in the second most energetic tower (MAX tower), the ECAL energy response becomes similar for both classes of events and the energy resolution is improved, as can be seen in Figure 9 (right). The latter (HIT+MAX tower) is how the L1 electron trigger algorithm calculates the electron candidate energy, as mentioned in Section 2.1.
 |
 |
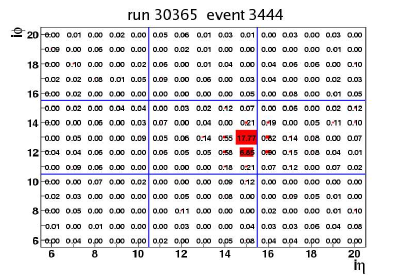
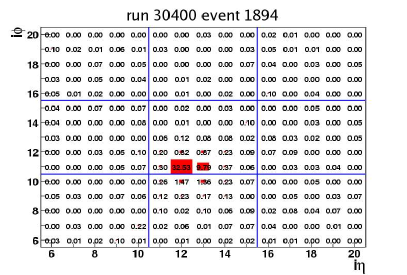
In the L1 electron/photon algorithm implementation, the FG veto is evaluated individually for each trigger tower. Any energy leakage outside of a trigger tower could lead to a trigger misclassification of isolated electrons when calculating the OR of the FG bits of all neighbor towers for the evaluation of the Combined Neighbor Veto bit. Figure 10 shows two event displays of test beam data where the energy leakage outside the HIT trigger tower is manifest. The solid lines delimit the trigger tower boundaries. Both events correspond to electron beam data samples in which the cluster energy deposits are compatible with an isolated candidate classification, but fail the isolation criteria due to the energy leakage into the neighboring trigger towers. Both events would be vetoed by the Combined Neighbor Veto and considered as non-isolated, because the for the most energetic adjacent tower is below 0.8, as the threshold is typically set at that value. The display on the right refers to one event of an electron beam with nominal energy of 50 GeV. The tail of the electromagnetic shower extends to the adjacent neighboring tower leading to a spread of low energy deposits over more than 2 strips. The display on the left refers to one event of an electron beam with nominal energy of 30 GeV. The low for the neighbor tower might be caused by the conjunction of the low energetic response of the shower leakage with noise fluctuation. These observations show that care must be taken to ensure that spurious veto bits are not set for low energy towers that may surround the HIT tower, either due to noise fluctuations, pile-up effects, energy leakage outside the HIT tower, or their association.
 |
 |
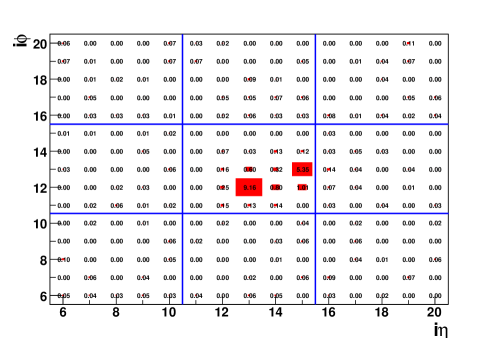
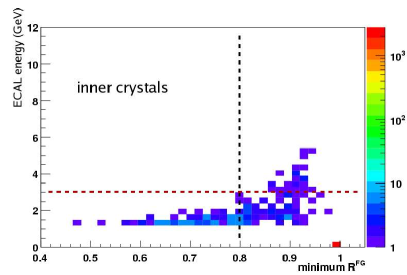
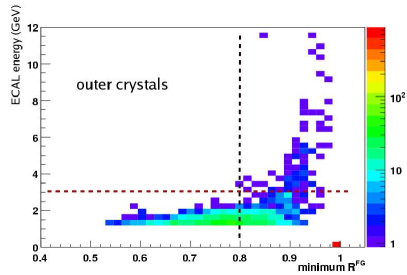
A correlation is found between the position of the most energetic crystal within the HIT trigger tower and the average minimum value of for the neighbor towers. In Figure 11 two scatter plots are shown for a data sample of 20 GeV electrons. For each event the neighbor tower with minimum value for was determined. A threshold of 1.25 GeV (corresponding to a 5 noise level of trigger tower energy) was applied to the total energy of the trigger towers, so that neighboring towers with lower energy were not considered. The plots show the value of versus the ECAL energy for the neighboring tower. If no neighboring towers with energy above 1.25 GeV are found, the is set to one and the ECAL tower energy is set to zero (i.e. no energy above noise level, red bin in lower right part of each plot). The left plot refers to events in which the most energetic crystal is located in the inner crystal array of the HIT trigger tower, whereas the right plot refers to events in which the most energetic crystal belongs to the boundary of the HIT tower, i.e., outside the inner crystal array (as defined in right panel of Figure 13). The position of the most energetic crystal is used as a rough estimator of the shower position with respect to the HIT trigger tower boundaries. It is seen that when the maximum energy deposit is near the boundary of the HIT tower (Figure 11 right) more events have low measured value () for the neighbor tower than when it is closer to the center of the trigger tower (Figure 11 left). The estimated fraction of events is 27% and 3%, respectively. The former observation is in agreement with the hypothesis that low values of for the neighbor towers are correlated to energy leakage effects. Furthermore, in both cases all the events with low measured value deposit relatively low energy in the neighboring tower, i.e. less than ~ 3 GeV for a 20 GeV electron beam.
 |
 |
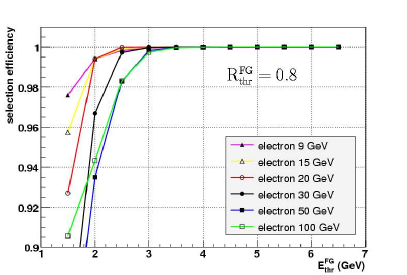
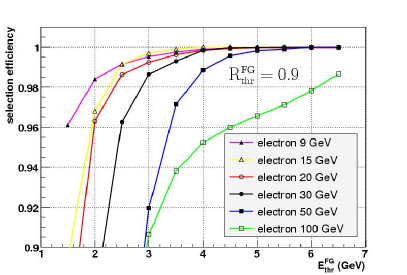
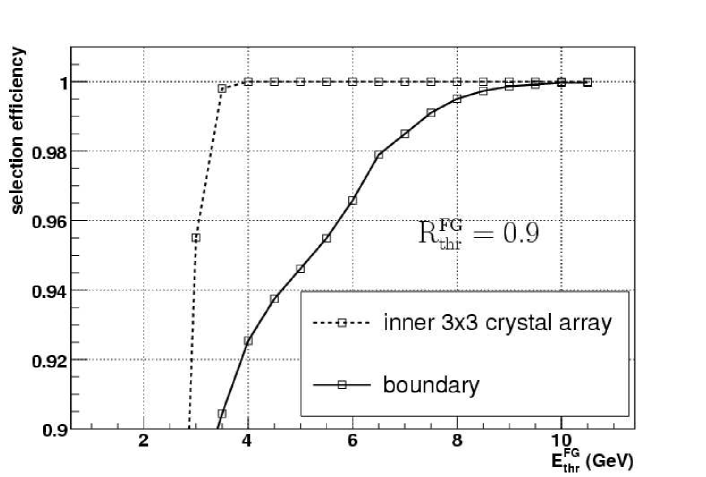
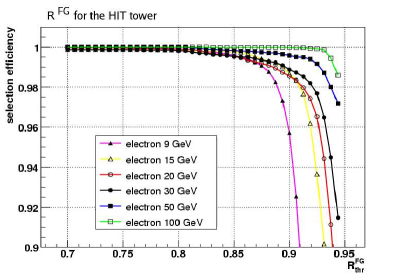
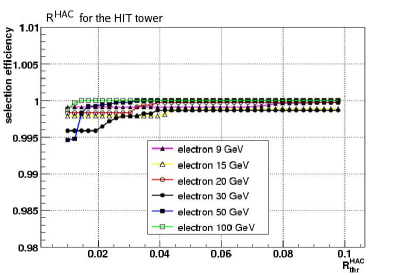
From the previous remarks, it is possible to reduce the rate of isolated electrons which appear as non-isolated by increasing the energy threshold of the trigger tower ) during the calculation of FG veto bit. This threshold, however, depends on the energy of the impinging electron. Due to the hardware design, it is not possible to adjust as a function of the electron energy. Therefore, needs to be optimized for the energy range of electrons that are foreseen to be selected by a given trigger stream. Figure 12 shows, for different nominal beam energies, the fraction of events surviving the FG veto for all eight neighbor towers as a function of . Since the original distribution of the electron shower position relative to the HIT trigger tower boundaries is not uniform for different beam energies, a simple event weighting technique was used, so that the fraction of events hitting the inner crystal array was made constant for all energies. The selection efficiency on the left plot was obtained using a threshold , while for the right plot a value of 0.9 was used. For , and discarding all towers with ECAL energy < 3 GeV, an efficiency above 99% is measured for all electron energies which were considered. For , however, it is necessary to raise the to 5 GeV to achieve an efficiency above 99% for electron energies up to ~ 50 GeV. The electrons from test beam are supposed to be isolated for all energies, however a non negligible fraction of 100 GeV electrons is classified as non-isolated (Figure 12, right) as the energy leakage to neighboring towers becomes significant. The loss of isolation efficiency for electrons with energy of 100 GeV is driven by events in which the most energetic crystal is located near the boundary of the trigger tower. This is illustrated in Figure 13, where the fraction of 100 GeV electrons events that survive the FG veto for all eight neighbor towers is shown as a function of and electron shower position relative to the trigger tower. A value of is used. It is important to stress that the electrons misclassified as non-isolated will still be recorded in the non-isolated trigger stream, as long as the threshold on is low enough. This is valid under the assumption that the High Level Trigger electron stream is seeded by both isolated and non-isolated L1 objects. For low-luminosity () the threshold on is about 20 GeV for the L1 single electron stream [9], while for high-luminosity it is about 50 GeV, which may affect the electron selection efficiency [10]. Regarding the threshold on the tower energy for the FG veto bit, a possible side effect of its increase would be a loss of jet rejection power for the electron stream. This effect, though, cannot be assessed, as non-isolated hadron jet data are not yet available.
 |
 |
5 Electron Selection Efficiency : Results
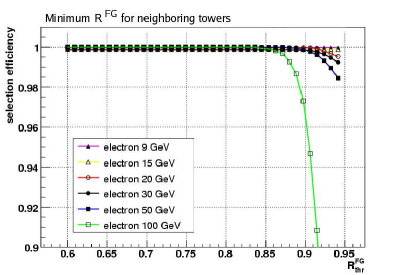
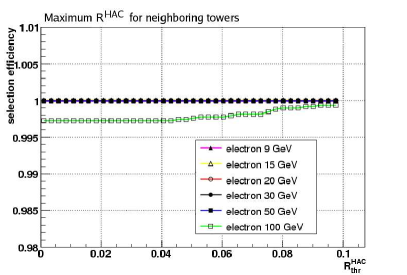
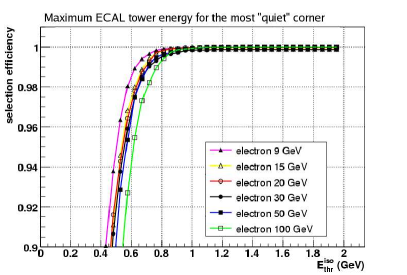
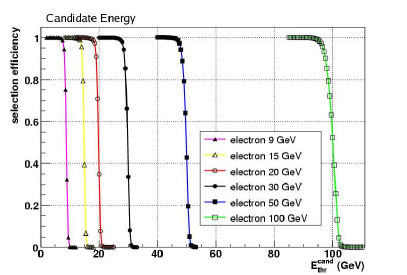
The dependence of the electron efficiency for each selection criterion used by the L1 algorithm is shown separately in Figure 14 for all energy samples. The average selection efficiency for electrons impinging on any of the crystals of the HIT trigger tower is shown as a function of the threshold for a given selection variable considered individually, regardless of other selection cuts. The event weighting technique mentioned in the previous section was also applied. The plots on the top row refer to the electron selection efficiency of FG and HAC vetoes, relative to the trigger tower where the electron hits (HIT tower). Following the discussion presented in Section 4, the energy thresholds were set at . The plots in the middle row refer to the first isolation criteria. For each event the neighbor trigger tower with the minimum FG ratio and the one with the maximum HAC ratio was found. According to the thresholds, it was determined if the event would satisfy the requirement. The convolution of the efficiencies presented in the two plots of the middle row gives the efficiency for the Combined Neighbor Veto. The plot on the bottom left refers to the selection efficiency of the ECAL isolation veto. The thresholds for all the previous discriminators are programmable and can be reset for each run. The electron selection efficiency is mostly sensitive to the FG veto requirement as it can be seen in Figure 14, top left and middle left. The energy distribution of the electron candidate events is shown as an efficiency curve as a function of (Figure 14, bottom right) without taking into account the effect of TPG digitization on energy resolution.
 |
 |
 |
 |
 |
 |
Test beam data was used in this study to validate the performance of the electron trigger selection and determine the efficiency given reference thresholds rather than to tune them. In Section 4, an attempt was made to improve the electron efficiency by optimizing . To illustrate the impact of on the electron classification, results are presented for two values of : 3 and 5 GeV, the latter being the optimal value for electrons energies up to ~ 50 GeV. All other threshold values determined from previous simulation studies [3, 11] seemed reasonable and the reference values were used. The selection cuts used in the study of the L1 algorithm efficiency are summarized in Table 1. The results on electron selection efficiency are presented in Table 2 for the isolated and non-isolated stream. The efficiency results reported are lower limits estimated assuming a binomial distribution and considering one-sided intervals containing 95% of the probability.
| Criterion | Threshold |
|---|---|
| (FG Tower Energy) | 3, 5 GeV |
| (HAC Tower Energy) | 5 GeV |
| (FG ratio) | 0.9 |
| (HAC ratio) | 0.05 |
| (Ecal Isolation) | 1.5 GeV |
| Electron selection efficiency lower limit (95% CL) | ||||
| Non-isolated Stream | Isolated Stream | |||
| Energy | = 3 GeV | = 5 GeV | = 3 GeV | = 5 GeV |
| 9 GeV | > 95% | > 95% | > 95% | > 95% |
| 15 GeV | > 98% | > 98% | > 98% | > 98% |
| 20 GeV | > 98% | > 98% | > 97% | > 98% |
| 30 GeV | > 99% | > 99% | > 97% | > 99% |
| 50 GeV | > 99% | > 99 % | > 91% | > 99% |
| 100 GeV | 100% | 100% | > 90% | > 96% |
Electrons with energies from 15 GeV up to 100 GeV are selected in the non-isolated stream with efficiency of 98–100%. The lower trigger efficiency for electrons with 9 GeV, 95%, is due to lower values measured in the HIT trigger tower, as shown in the top left plot of Figure 14. The selection efficiency of the non-isolated stream is the same for GeV and GeV. For GeV, electrons with nominal energies from 15 GeV up to 50 GeV are classified as isolated with 98% efficiency or more. For electrons with an energy of 100 GeV, although all would be selected by either the isolated or non-isolated stream, 4% of them are classified as non-isolated due to the energy leakage in the neighboring towers as discussed in Section 4. From inspection of Figure 14 and from the results in Table 2 for GeV, it is clear that the misclassification of these electrons is due to the Combined Neighbor veto.
6 Results on Charged Hadron Rejection
The optimization of the thresholds used for each criterion must also consider the minimization of the trigger rate from fake QCD jet events. The rejection of the L1 electron/photon algorithm for charged hadrons was estimated using charged hadron beam data samples with energies from 3 up to 100 GeV. The same selection cuts chosen for the electron efficiency study were applied and are shown in Table 3. Additionally, the impact of the candidate energy requirement on the hadron rejection was considered by setting a 10 GeV threshold. The rejection for each cut applied individually is reported in Table 4 for all considered beam energies. The cuts that yield the greatest rejection power are the candidate energy requirement, the FG and the HAC veto for the HIT tower. For low hadron energies ( 9 GeV) the fraction of events that are rejected by the FG and HAC veto for the HIT tower is low ( < 15%) because of the and ( = 5 GeV) values required and necessary to ensure high isolation efficiencies for electrons with energies up to 50 GeV.
| Criterion | Threshold |
|---|---|
| (FG Tower Energy) | 5 GeV |
| (HAC Tower Energy) | 5 GeV |
| (FG ratio) | 0.9 |
| (HAC ratio) | 0.05 |
| (Ecal Isolation) | 1.5 GeV |
| (Candidate Energy) | 10 GeV |
| Hadron rejection per cut | ||||||
|---|---|---|---|---|---|---|
| Energy | Candidate Energy | HAC HIT | FG HIT | HAC Neigh. | FG Neigh. | Ecal Iso. |
| 3 GeV | 100% | 0% | 0% | 0% | 0% | 0% |
| 5 GeV | 100% | 2% | 2% | 0% | 0% | 0% |
| 7 GeV | 100% | 7% | 3% | 0% | 0% | 0% |
| 9 GeV | 99% | 13% | 7% | 0% | 0% | 0% |
| 15 GeV | 95% | 34% | 24% | 1% | 0% | 0% |
| 20 GeV | 83% | 43% | 28% | 2% | 0% | 0% |
| 30 GeV | 63% | 54% | 28% | 4% | 0% | 0% |
| 50 GeV | 48% | 63% | 26% | 12% | 0% | 0% |
| 100 GeV | 43% | 66% | 19% | 19% | 1% | 0% |
The overall L1 rejection for charged hadrons after all trigger cuts, including the 10 GeV threshold on the candidate energy is presented in Table 5 for the isolated and non-isolated trigger streams. The rejection results reported are estimated assuming a binomial distribution and considering symmetrical intervals containing 95% of the probability. For all beam energies the fraction of events rejected by the trigger cuts for the non-isolated trigger stream is always larger than ~ 93%. The additional event rejection due to isolation cuts is less than 1% with respect to the fraction of events already rejected by the shower profile cuts (FG and HAC) for the HIT tower.
| Hadron rejection intervals (95% CL) | ||
|---|---|---|
| Energy | Non-isolated stream | Isolated stream |
| 3 GeV | 100% | 100% |
| 5 GeV | 100% | 100% |
| 7 GeV | 100% | 100% |
| 9 GeV | [99.8 , 99.9]% | [99.8 , 99.9]% |
| 15 GeV | [94.6 , 98.3]% | [95.0 , 98,5]% |
| 20 GeV | [93.4 , 94.2]% | [93.8 , 94.6]% |
| 30 GeV | [93.8 , 94.9]% | [94.2 , 95.3]% |
| 50 GeV | [96.2 , 96.6]% | [97.2 , 97.5]% |
| 100 GeV | [97.7 , 98.1]% | [98.5 , 98.8]% |
7 Conclusions
The electron selection efficiency of the L1 trigger algorithm is measured for electrons of the combined ECAL/HCAL test beam data. Results indicate that identification efficiencies of 98–100% can be achieved for electron energies from 15 up to 100 GeV. The selection efficiency for the isolated electron stream is limited by the energy leakage to the neighboring trigger towers which induces spurious neighbor veto bits. In order to reduce this effect and improve the efficiency for isolated electrons, a minimum threshold of 5 GeV on the tower energy can be set. Following this approach more than 99% of isolated electrons with energies up to 50 GeV are also considered isolated according to the Fine Grain veto, while the efficiency for the non-isolated stream remains unaffected. The overall selection efficiency for the isolated electron stream was found to be above 98% for electrons with energies from 15 up to 50 GeV. Due to the energy leakage to neighboring towers, approximately 4% of the isolated electrons with 100 GeV are considered as non-isolated. If a proper classification is necessary for energies higher than 50 GeV either the Combined Neighbor veto should not be applied or the threshold on the tower energy for Fine Grain veto should be adjusted.
The fraction of charged hadrons with energies from 3 up to 100 GeV rejected by the L1 electron trigger algorithm is estimated to be larger than 93%.
Acknowledgements.
The authors would like to express their gratitude to the 2006 Combined ECAL/HCAL test beam community for providing detailed information on the experimental setup, data access and particle identification methods. We thank in particular S. Kunori, A. Askew, L. Berntzon J. Damgov and F. Ratnikov. We also acknowledge fruitful discussions with S. Dasu and W. Smith regarding the CMS L1 electron trigger algorithm.Appendix A Pseudo-code for Fine Grain bit evaluation
-
•
if (Tower Energy < ) FG veto bit = 0
-
•
if (<Tower Energy <)
-
–
if ( FG ratio < ) FG veto bit = 1
-
–
else FG veto bit = 0
-
–
-
•
if (Tower Energy > )
-
–
if (FG ratio < ) FG veto bit =1
-
–
else FG veto bit = 0
-
–
References
- [1] S. Dasu et. al., CMS Level-1 Calorimeter Trigger Detailed Simulation, CMS Note 1998/027 (1998).
- [2] CMS Collaboration, W. Smith et. al., The tridas project technical design report, volume 1: The trigger systems, . CERN/LHCC 2000-38, CMS TDR 6.1.
- [3] S. Dasu et. al., CMS Calorimeter Level 1 Regional Trigger Electron Identification, CMS Note 1999/026 (1999).
- [4] N. Akchurin et. al., The response of CMS Combined Calorimeters to Single Hadrons, Electrons and Muons, CMS Note 2007/012 (2007).
- [5] CMS Collaboration, D. Acosta et. al., Cms physics tdr volume 1, section 4.4.3: Intercalibration using single electrons, . CERN/LHCC 2006-001, CMS TDR 8.1.
- [6] N. Bruneliere and A. Zabi, Reconstruction of the signal amplitude of the CMS electromagnetic calorimeter, CMS Note 2006/037 (2006).
- [7] E. Meschi et. al., Electron Reconstruction in the CMS Electromagnetic Calorimeter, CMS Note 2001/034 (2001).
- [8] CMS Collaboration, D. Acosta et. al., Cms physics tdr volume 1, section 4.3.2: Energy resolution in test beam, . CERN/LHCC 2006-001, CMS TDR 8.1.
- [9] S. Vanini et. al., 2E33 Trigger Tables for PTDR, volume 2, CMS Analysis Note 2006/085 (2006).
- [10] P. Chumney et. al., CMS Level-1 Regional Calorimeter Trigger Simulation Results, CMS Note 2000/074 (2000).
- [11] R. Nobrega and J.Varela, The CMS electron/photon trigger Simulation study with CMSIM data, CMS Technical Note 1996/021 (1996).