Proteins in a shear flow
Abstract
The conformational dynamics of a single protein molecule in a shear flow is investigated using Brownian dynamics simulations. A structure-based coarse grained model of a protein is used. We consider two proteins, ubiquitin and integrin, and find that at moderate shear rates they unfold through a sequence of metastable states – a pattern which is distinct from a smooth unraveling found in homopolymers. Full unfolding occurs only at very large shear rates. Furthermore, the hydrodynamic interactions between the amino acids are shown to hinder the shear flow unfolding. The characteristics of the unfolding process depend on whether a protein is anchored or not, and if it is, on the choice of an anchoring point.
Keywords: protein stretching, protein folding, manipulation of proteins, Go model, molecular dynamics, integrin, ubiquitin
PACS numbers: 82.37.Rs, 87.14.Ee, 87.15.-v
I Introduction
Mechanically induced conformational changes in biomolecules can be accomplished experimentally in many ways. One of them is by using a pulling device, such as an atomic force microscope, another is by involving fluid flow. The pulling device can be used in two basic modes: at a constant pulling velocity or at a constant force. The latter mode results in a nearly homogeneous tension along the backbone of a biomolecule and in an essentially two-state unfolding behavior in simple proteins such as ubiquitin Schlierf et al. (2004). The flow induced stretching is very different in this respect since - even in the case of the uniform flow - the tension along the backbone increases as one moves from the free end to the tethered end Marko and Siggia (1995); Rzehak et al. (2000a). This effect was predicted Szymczak and Cieplak (2006) to lead to emergence of many partially unfolded metastable conformations which arise when one ramps-up speeds of flow.
Experiments on flow-generated stretching of biomolecules have been performed either by using the direct bulk flow Perkins et al. (1995); Larson et al. (1997); Smith et al. (1999); Doyle et al. (2000); Teixeira et al. (2005); Schroeder et al. (2005, 2005); Shaqfeh (2005) or by using the meniscus forces, for example in molecular combing Strick et al. (2003); Michalet et al. (1997); Bakajin et al. (1998); Björk et al. (2005) or the combination of the viscous and meniscus forces, as it is the case in spin-stretching Yokota et al. (1999); Kim et al. (2007) technique. The experiments have been usually performed on the long DNA chains. However, in the case of proteins a full unfolding of a molecule requires flow velocities that are three orders of magnitude larger Szymczak and Cieplak (2006) than those needed for the DNA unfolding because of the much smaller hydrodynamic radii and larger intramolecular forces involved. Nevertheless, stretching proteins at smaller flow velocities could still produce interesting effects, since it usually results in the formation of partially unfolded intermediates. However, in contrast to AFM force spectroscopy, there are still no experiments on the protein unfolding in the flow on the single-molecule level. Instead, flow denaturation experiments were carried out on a bulk collection of molecules, usually subject to the shearing forces Charm and Low Wong (1970); Thomas et al. (1979); Thomas and Dunhill (1979); Maa and Hsu (1996); Jaspe and Hagen (2006). A notable exception are the studies on the von Willebrand factor (vWf), a large poly-protein found in the blood plasma Alexander-Katz et al. (2006); Schneider et al. (2007); Siedlecki et al. (1996). However, although the existence of shear-induced conformational transition in that system is well documented, it does not seem to involve the unfolding of individual domains of the protein. Instead, a conformational transition of the whole multi-unit chain takes place, from a compact globular state to the elongated fiber-like conformation.
The experimental results quoted here seem to suggest that the shear rates needed to unfold a small protein are extraordinarily high. For example Jaspe and Hagen Jaspe and Hagen (2006) tried to unfold horse cytochrome with the shear rates as high as Hz but observed no evidence of the shear destabilization of the folded state of the protein. They also gave a simple estimate that in order to unfold a protein, the shear rate should be characterized by the Weissenberg number, of the order of . Here is the folding time of a protein and is the shear rate. We confirm that prediction through molecular dynamics simulations of a protein using a coarse-grained model. Additionally, we show that stretching of proteins by shear flow proceeds differently from that of homopolymers.
The simulations were conducted for ubiquitin (1ubq) and integrin (1ido). Both have been the subject of our previous investigations on protein stretching in uniform flow. In particular, integrin was shown to possess a surprisingly rich spectrum of metastable states when stretched by the flow Szymczak and Cieplak (2006) which makes it a perfect system in which to investigate the effects of the shear flow.
II The model
Coarse-grained models of proteins allow one to access time scales which are orders of magnitude longer than those available in all-atom simulations. Among the coarse-grained models, the Go-like implementations Abe and Go (1981); Takada (1999) link the properties of a protein directly to its native geometry and are probably the easiest to use. We follow the implementation presented in references Hoang and Cieplak (2000a); Hoang and Cieplak (2000b); Cieplak and Hoang (2003); Cieplak et al. (2003); Sułkowska and Cieplak (2007). The protein is represented by a chain of its Cα atoms. The successive Cα atoms along the backbone are tethered by harmonic potentials with a minimum at 3.8 Å. The effective interactions between the residues are split into two classes: native and non- native. This determination is made by checking for native overlaps between the enlarged van der Waals surfaces of the amino acids as proposed in reference Tsai et al. (1999). The amino acids, and , that do overlap in this sense are endowed with the effective Lennard- Jones potential . The length parameters are chosen so that the potential minima correspond, pair-by-pair, to the experimentally established native distances between the respective amino acids in the native state. Non-native contacts are represented by hard core repulsion in order to prevent entanglements. Another term in the Hamiltonian imposes local stiffness on the backbone. This can be accomplished either by introducing biases in the bond and dihedral angles Clementi et al. (2000) or by favoring native senses of local chiralities Kwiecinska and Cieplak (2005). Here, we choose the latter.
The protein was subject to a simple shear flow of the form
| (1) |
which may also be written as where is the velocity gradient matrix, in this case given by
| (2) |
In our previous studies on uniform flow unfolding Szymczak and Cieplak (2006) we used the Langevin dynamics method to track the evolution of the system. Here, however, we use the Brownian dynamics scheme since it allows for a straightforward incorporation of hydrodynamic interactions (HI). Without the hydrodynamic interactions, the two schemes (Langevin and Brownian dynamics) give the same results, since on the time scales characteristic for protein unfolding, the motion is overdamped and inertia effects are negligible, as confirmed in Ref. Szymczak and Cieplak (2007).
In the Brownian dynamics algorithm Ermak and McCammon (1978), the displacement of the ’th amino acid during the timestep given by
| (3) |
Here is the position of i-th amino acid, is the total interparticle force acting on it, is the diffusion tensor. Note that both and are configuration-dependent. Next, is a random displacement given by a Gaussian distribution with an average value of zero and covariance obeying
| (4) |
Finally, is the third rank shear disturbance tensor G.Dhont (1996) representing the effect of interparticle hydrodynamic forces on the shear-induced particle motion Mazur and van Saarlos (1982); Bujan-Nunez and Dickinson (1994). Most of our simulations were conducted without taking hydrodynamic interactions into account (free draining model). In this case, the diffusion tensor is diagonal
| (5) |
and the disturbance matrix vanishes. At the end of the paper, we discuss the influence of the hydrodynamic interactions on the mean extension at various shear rates. In that case, we use the Rotne, Prager and Yamakawa Rotne and Prager (1969); Yamakawa (1970) approximation of the diffusion tensor, with the nondiagonal terms of given by
| (6) |
where and represents the hydrodynamic radius of a bead.
When taking the hydrodynamic interactions into account, the choice of a hydrodynamic radius, , is a crucial element in the model. One of the ways of tuning this parameter is to compare the translational diffusion coefficient , of a protein in a numerical model, to the one measured in experiment. Fig. 1 shows the dependence of on the hydrodynamic radius. Here the diffusion coefficients are normalized by - the diffusion coefficient of the bead of radius =5 Å. In water at , with viscosity of Poise, one gets . The experiment Dingley et al. (1997) gives the diffusion coefficient of ubiquitin , or, equivalently, . As can be seen from the data, the agreement with experiment is obtained for . This value agrees with earlier estimates by de la Torre and Antosiewicz Garcia de la Torre and Bloomfield (1981); Antosiewicz and Porschke (1989); Hellweg et al. (1997); Garci a De La Torre et al. (2000); Banachowicz et al. (2000). However, since the distance between the successive Cα atoms along the protein backbone is Å, some of the beads representing amino acids overlap. This reflects the fact that: 1) the interior of the protein is densely packed, 2) the side chains of amino acids are usually longer than Å, and 3) the protein is covered by the hydration layer of tightly bound water molecules. Although the Rotne-Prager tensor is positive definite also for overlapping beads, its physical meaning for such configurations is problematic Garci a De La Torre et al. (2000). The overlapping bead models are successful in predicting the diffusion coefficients of the proteins Garcia de la Torre and Bloomfield (1981); Antosiewicz and Porschke (1989), however the question whether they correctly reproduce the dynamic effects of hydrodynamic interactions during large-scale conformational motions in macromolecules is still open. To investigate the influence of the hydrodynamic radius on the dynamics of the protein in the flow, we compare the results obtained for with those for a smaller value of the hydrodynamic radius, Å. The analysis of Fig. 1 shows that the choice of Å overestimates the diffusion coefficients by 20% only, but has the advantage of not leading to overlapping configurations of the spheres with the radii of . Such a value of was also used in our previous studies on the influence of hydrodynamic interactions on protein unfolding Szymczak and Cieplak (2007) whereas Baumketner and Hiwatari Baumketner and Hiwatari (2002) use in their investigations on the influence of HI on the protein folding process.
A natural time scale in the simulations, , is set by the time it takes for the amino acid (i.e. the object of the radius Å) to diffuse the distance of its radius, . Again, in water at , one gets . This time scale is used as a time unit in the data reported, irrespectively of the actual value of hydrodynamic radius used ( or Å).
The folding time for ubiquitin, as calculated according to the scheme described e.g. in Hoang and Cieplak (2000b) in the free-draining case (with Å) is equal to whereas for integrin . When the hydrodynamic interactions are taken into account ubiquitin folding time becomes for and for . The latter difference is caused mainly by the differences in the single amino acid diffusion coefficients in both cases; the ratio of the diffusion coefficients is only about 10% larger than the corresponding ratio of folding times, .
The initial conformation of the protein corresponds to the native structure. During the simulations either one of the termini of the protein is anchored or both ends are free. In both cases, the fluid in which the protein is immersed is unbounded in all directions The end-to-end extension, the orientation angle and the root-mean-square deviation (RMSD) from the native structure are then recorded as a function of time. The total length of the simulation time for each trajectory was for the free-draining case (for both ubiquitin and integrin) and for the simulations with hydrodynamic interactions (for ubiquitin). The non-dimensional flow strength is characterized by the Weissenberg number, , where, following Jaspe and Hagen Jaspe and Hagen (2006), we take to be equal to the folding time of the protein, .
III Results
As already noted by Lumley Lumley (1969) and de Gennes de Gennes (1974), a notable feature of the shear flow is that it is a combination of the elongational and rotational components of equal magnitudes. In such a marginal case the polymer chain does not attain a stable stretched configuration. Instead, it undergoes a tumbling motion, a series of subsequent stretching and coiling events with frequent changes in the orientation of the chain with respect to the shear axis Smith et al. (1999); Doyle et al. (2000); Teixeira et al. (2005); Schroeder et al. (2005). While the elongational component of the flow is stretching the molecule, its rotational component aligns it along the shear axis, leading to the collapse of the chain due to the decreased hydrodynamic drag. An important role in this dynamics is played by the Brownian fluctuations, which cause the chain segments to cross the streamlines into the regions of higher or lower flow which results in further stretching or collapse of the chain respectively. In particular, the fluctuations may tip the polymer in such a way that its two ends lie in the regions of opposite flow direction, which results in a tumbling event, in which one polymer end moves over the other.
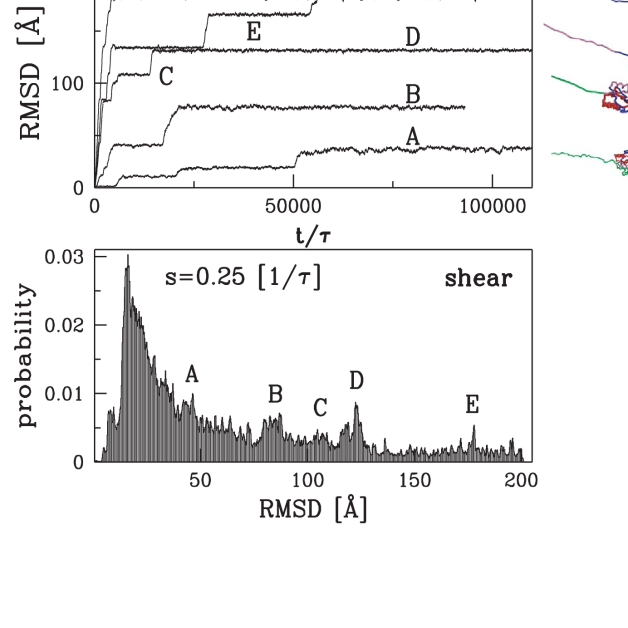
We show that the tumbling dynamics are also seen in the case of protein stretching by a shear flow. As an example, Figs. 2 and 3 show the time series of configurations of integrin in shear flow for both tethered and free protein. However, the presence of a complex network of bonds between amino acids in a protein results in a number of important differences between the homopolymer and protein unfolding. In particular, the extension of the protein in the uniform flow is not a continuous function of the flow rate. Instead, as the flow velocity is increased, the protein undergoes a number of rapid transitions to the successive metastable states. Each of those transitions is accompanied by the breaking of a particular group of bonds and unzipping of subsequent structures from the bulk of the protein. As an example, Fig. 4 shows the set of intermediates arising during unfolding of the integrin molecule in a uniform flow.
The presence of intermediate states is also observed in the case of the shear flow. However, in a shear flow those states are never long-lived, even a small thermal fluctuation may move the protein to the region of smaller flow and the molecule collapses. Nevertheless, some fingerprints of the underlying discrete set of intermediate states are present even in the histogram of end-to-end distances, which shows the maxima corresponding to the metastable states observed in the uniform flow stretching. As an example, Fig. 4 shows the end-to-end length distribution for the integrin molecule tethered by the terminus. Such a peak structure in the histogram is observed for medium shear rates only; lower shear rates are not strong enough for the intermediates to overcome the free energy barrier needed to partially unfold the chain whereas in the case of high shear rates the tumbling rate increases, the protein spends even less time in the stationary conformations and thus the histogram no longer shows the intermediates. Fig. 5 gives an example of the end-to-end length distribution for the 50 % higher shear rate than that in Fig. 4. As it is seen, the peak structure is now almost impossible to discern.
It is worth noting that in the case of homopolymer in a shear flow, the respective probability distributions have a much simpler structure. As an example, Fig. 6 shows the RMSD histogram for a simple helix (of 48 residues) in a shear flow. Also the histograms of the chain extension in DNA experiments are usually much smoother, with one or two maxima only Schroeder et al. (2005).
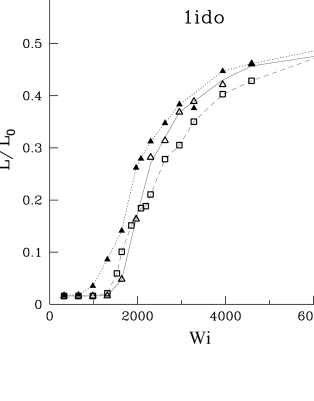
The characteristics of uniform flow unfolding are asymmetric with respect to the protein anchoring Szymczak and Cieplak (2006). For example, integrin unfolds more easily when tethered by the C terminus. Also, the C terminus tethering leads to a much richer spectrum of intermediates than the N terminus tethering. As mentioned in the Introduction, this asymmetry is caused by the fact that the tension along the protein backbone increases from the free end towards the tethered one when the molecule is placed in the flow. Such an asymmetry can also be seen in the shear flow unfolding. In particular, Fig. 7 shows the relative extension () of the integrin molecule as a function of the Weissenberg number for different tethering points. Here the average end-to- end distance of the molecule (L) is normalized by the maximum extension length Å, where is the number of amino acids. It is seen that the C terminus tethering allows unfolding at a lower shear rate, which is consistent with the uniform flow stretching results. The critical shear rate, at which the unfolding events begin to take place is shifted from in the case of the C terminus tethering to about for the N terminus tethering. Finally, when both ends of a protein are free, the critical shear rate is the same as in the tethering case (), but the shape of the dependence of on Wi is slightly different from that observed for the tethering.
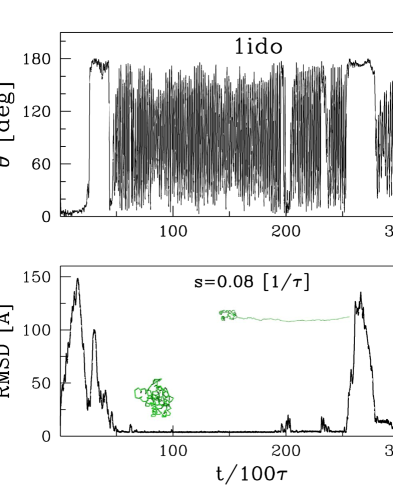
As noted by Smith Smith et al. (1999) and Doyle Doyle et al. (2000), the power spectral density of the end-to-end polymer extension in a shear flow shows no distinct peaks which indicates that no periodicity is present in the evolution of this variable. However, it was subsequently reported Schroeder et al. (2005); Delgado-Buscalioni (2006) that there are other variables characterizing the polymer motion which show the periodic behavior. In particular, a well defined characteristic tumbling frequency is revealed in the spectrum of a polymer orientation angle Schroeder et al. (2005). Analogous spectrum for the protein is presented in Fig. 8. Two peaks can be identified in the spectrum, corresponding to two characteristic tumbling frequencies. The higher frequency is the one associated with the rotational component of the shear flow, (a sphere immersed in the shear field rotates with the frequency G.Dhont (1996)). On the other hand, the lower frequency, , corresponds to the stretching-collapse cycle and scales sublinearly with the flow rate, similarly to what was reported in DNA experiments Schroeder et al. (2005). Both dynamical behaviors are observed in Fig. 9 which shows the time trace of the protein orientation angle and the associated evolution of the RMSD. In the high frequency regime, the protein is closely packed, with small values of RMSD away form the native structure and it essentially behaves like a sphere rotating in a shear flow. From time to time, a sudden unfolding event takes place - the protein ceases to rotate and its RMSD rapidly increases. For larger shear rates, the unfolding events are more frequent and the periods of free rotation in the globular state - shorter, as seen in Fig 10. Fig. 11 shows the tumbling frequencies, and as the function of Wi. Note that there is a relatively narrow shear rate range for which both frequencies are visible in the spectrum. For lower shear rates the protein hardly ever unfolds hence is impossible to discern. On the other hand, at large shear rates the protein is never found in a globular state for a sufficient period of time for to be seen.
The inclusion of hydrodynamic interactions considerably hinders the unfolding of a molecule. Fig. 12 shows the comparison of the relative extension of ubiquitin in a shear flow calculated with and without the hydrodynamic interactions. It is seen that, when HI are included in the model, much larger shear rates are needed for the unfolding of a molecule and the corresponding extensions of the chain are significantly smaller. In particular, a critical shear rate needed for the unfolding events to take place is shifted from for the non-HI case to (HI present, ) and (HI present, ). This is consistent with our earlier studies on the uniform flow unfolding Szymczak and Cieplak (2007) where it was observed that unfolding of the system with HI requires a much larger flow speed than without. This tendency can be understood qualitatively in terms of the so-called non-draining effect Rzehak et al. (2000b): the residues hidden inside the protein are shielded from the flow and thus only a small fraction of the residues experience the full drag force of . In contrast, when no HI are present, this drag force is applied to all residues. This effect is analyzed more quantitatively e.g. in Ref. Agarwal and Mashelkar (1994) where, in particular, it is shown that the hydrodynamic shielding increases with an increase in both the hydrodynamic radius and the total number of beads in the polymer chain.
IV Summary
We have presented Brownian Dynamics simulation results on the conformational dynamics of individual protein molecules in the flow. The presence of a network of bonds between amino acids in a protein leads to a number of important differences between the homopolymer and protein unfolding. In particular, in the case of proteins, the characteristics of the unfolding process are shown to depend on the selection of the point of anchor. Additionally, for moderate shear rates, a number of intermediate stages in the unfolding may be discerned, with well defined RMSD values with respect to the native structure. Full unfolding of the proteins was found to occur only at very high shear rates, which is is consistent with the experimental results Jaspe and Hagen (2006).
V Acknowledgments
This project has been supported by the Polish Ministry of Science and Higher Education (Grant N N202 0852 33) and by the European program IP NaPa through Warsaw University of Technology. Fruitful discussions with Jan Antosiewicz are appreciated.
References
- Schlierf et al. (2004) M. Schlierf, H. Li, and J. M. Fernandez, Proc. Natl. Acad. Sci. USA 101, 7299 (2004).
- Marko and Siggia (1995) J. F. Marko and E. D. Siggia, Macromolecules 28, 8759 (1995).
- Rzehak et al. (2000a) R. Rzehak, W. Kromen, T. Kawakatsu, and W. Zimmermann, European Physical Journal E 2, 3 (2000a).
- Szymczak and Cieplak (2006) P. Szymczak and M. Cieplak, Journal of Chemical Physics 125, 164903 (2006).
- Perkins et al. (1995) T. T. Perkins, D. E. Smith, R. G. Larson, and S. Chu, Science 268, 83 (1995).
- Larson et al. (1997) R. G. Larson, T. T. Perkins, D. E. Smith, and S. Chu, Phys. Rev. E 55, 1794 (1997).
- Smith et al. (1999) D. E. Smith, H. P. Babcock, and S. Chu, Science 283, 1724 (1999).
- Doyle et al. (2000) P. S. Doyle, B. Ladoux, and J.-L. Viovy, Physical Review Letters 84, 4769 (2000).
- Teixeira et al. (2005) R. Teixeira, H. Babcock, E. Shaqfeh, and S. Chu, Macromolecules 38, 581 (2005).
- Schroeder et al. (2005) C. M. Schroeder, R. E. Teixeira, E. S. Shaqfeh, and S. Chu, Physical Review Letters 95, 018301 (2005).
- Schroeder et al. (2005) C. Schroeder, R. Teixeira, E. Shaqfeh, and S. Chu, Macromolecules 38, 1967 (2005).
- Shaqfeh (2005) E. S. G. Shaqfeh, Journal of Non-Newtonian Fluid Mechanics 130, 1 (2005).
- Strick et al. (2003) T. R. Strick, M. . Dessinges, G. Charvin, N. H. Dekker, J. . Allemand, D. Bensimon, and V. Croquette, Reports on Progress in Physics 66, 1 (2003).
- Michalet et al. (1997) X. Michalet, R. Ekong, F. Fougerousse, S. Rousseaux, C. Schurra, N. Hornigold, M. Van Slegtenhorst, J. Wolfe, S. Povey, J. S. Beckmann, et al., Science 277, 1518 (1997).
- Bakajin et al. (1998) O. B. Bakajin, T. A. J. Duke, C. F. Chou, S. S. Chan, R. H. Austin, and E. C. Cox, Physical Review Letters 80, 2737 (1998).
- Björk et al. (2005) P. Björk, A. Herland, I. G. Scheblykin, and O. Inganäs, Nano Letters 5, 1948 (2005).
- Yokota et al. (1999) H. Yokota, J. Sunwoo, M. Sarikaya, G. van den Engh, and R. Aebersold, Analytical Chemistry 71, 4418 (1999).
- Kim et al. (2007) J. Kim, W.-X. Shi, and R. Larson, Langmuir 23, 755 (2007).
- Charm and Low Wong (1970) S. E. Charm and B. Low Wong, Science 170, 466 (1970).
- Thomas et al. (1979) C. R. Thomas, A. W. Nienow, and P. Dunhill, Biotechnology and Bioengineering 21, 2263 (1979).
- Thomas and Dunhill (1979) C. R. Thomas and P. Dunhill, Biotechnology and Bioengineering 21, 2279 (1979).
- Maa and Hsu (1996) Y. F. Maa and C. C. Hsu, Biotechnology and Bioengineering 51, 458 (1996).
- Jaspe and Hagen (2006) J. Jaspe and S. J. Hagen, Biophysical Journal 91, 3415 (2006).
- Alexander-Katz et al. (2006) A. Alexander-Katz, M. F. Schneider, S. W. Schneider, A. Wixforth, and R. R. Netz, Physical Review Letters 97, 138101 (2006).
- Schneider et al. (2007) S. W. Schneider, S. Nuschele, A. Wixforth, C. Gorzelanny, A. Alexander-Katz, R. R. Netz, and M. F. Schneider, Proceedings of the National Academy of Sciences 104, 7899 (2007).
- Siedlecki et al. (1996) C. A. Siedlecki, B. J. Lestini, K. Kottke-Marchant, S. J. Eppel, and D. L. Wilson, Blood 88, 2939 (1996).
- Abe and Go (1981) H. Abe and N. Go, Biopolymers 20, 1013 (1981).
- Takada (1999) S. Takada, Proc. Natl. Acad. Sci. (USA) 96, 11698 (1999).
- Hoang and Cieplak (2000a) T. X. Hoang and M. Cieplak, J. Chem. Phys. 112, 6851 (2000a).
- Hoang and Cieplak (2000b) T. X. Hoang and M. Cieplak, J. Chem. Phys. 113, 8319 (2000b).
- Cieplak and Hoang (2003) M. Cieplak and T. X. Hoang, Biophysical Journal 84, 475 (2003).
- Cieplak et al. (2003) M. Cieplak, T. X. Hoang, and M. O. Robbins, Proteins: Struct. Funct. Bio. 56, 285 (2003).
- Sułkowska and Cieplak (2007) J. I. Sułkowska and M. Cieplak, Journal of Physics: Condensed Matter 19, 283201 (2007).
- Tsai et al. (1999) J. Tsai, R. Taylor, C. Chotchia, and M. Gerstein, Journal of Molecular Biology 290, 253 (1999).
- Clementi et al. (2000) C. Clementi, H. Nymeyer, and J. N. Onuchic, Journal of Molecular Biology 298, 937 (2000).
- Kwiecinska and Cieplak (2005) J. I. Kwiecinska and M. Cieplak, Journal of Physics Condensed Matter 17, 1565 (2005).
- Szymczak and Cieplak (2007) P. Szymczak and M. Cieplak, Journal of Physics: Condensed Matter 19, 258224 (2007).
- Ermak and McCammon (1978) D. L. Ermak and J. A. McCammon, J. Chem. Phys. 69, 1352 (1978).
- G.Dhont (1996) J. G.Dhont, An Introduction to Dynamics of Colloids (Elsevier, Amsterdam, 1996).
- Mazur and van Saarlos (1982) P. Mazur and W. van Saarlos, Physica A 115, 21 (1982).
- Bujan-Nunez and Dickinson (1994) M. C. Bujan-Nunez and E. Dickinson, Journal of the Chemical Society - Faraday Transactions pp. 2737–2742 (1994).
- Rotne and Prager (1969) J. Rotne and S. Prager, J. Chem. Phys. 50, 4831 (1969).
- Yamakawa (1970) H. Yamakawa, J. Chem. Phys. 53, 436 (1970).
- Dingley et al. (1997) A. J. Dingley, J. P. Mackay, G. L. Shaw, B. D. Hambly, and G. F. King, Journal of Biomolecular NMR 10, 1 (1997).
- Garcia de la Torre and Bloomfield (1981) J. Garcia de la Torre and V. A. Bloomfield, Quarterly Reviews of Biophysics 14, 81 (1981).
- Antosiewicz and Porschke (1989) J. Antosiewicz and D. Porschke, Journal of Physical Chemistry 93, 5301 (1989).
- Hellweg et al. (1997) T. Hellweg, W. Eimer, E. Krahn, K. Schneider, and A. Mu ller, Biochimica et Biophysica Acta - Protein Structure and Molecular Enzymology 1337, 311 (1997).
- Garci a De La Torre et al. (2000) J. Garci a De La Torre, M. L. Huertas, and B. Carrasco, Biophysical Journal 78, 719 (2000).
- Banachowicz et al. (2000) E. Banachowicz, J. Gapinski, and A. Patkowski, Biophysical Journal 78, 70 (2000).
- Baumketner and Hiwatari (2002) A. Baumketner and Y. Hiwatari, Journal of the Physical Society of Japan 71, 3069 (2002).
- Lumley (1969) J. Lumley, Annual Review of Fluid Mechanics 1, 367 (1969).
- de Gennes (1974) P. G. de Gennes, Journal of Chemical Physics 60, 5030 (1974).
- Delgado-Buscalioni (2006) R. Delgado-Buscalioni, Physical Review Letters 96, 1 (2006).
- Rzehak et al. (2000b) R. Rzehak, W. Kromen, T. Kawakatsu, and W. Zimmermann, European Physical Journal E 2, 3 (2000b).
- Agarwal and Mashelkar (1994) U. S. Agarwal and R. A. Mashelkar, J. Chem. Phys. 100, 6055 (1994).
FIGURE CAPTIONS
- Fig. 1.
-
The reduced diffusion coefficient as a function of a hydrodynamic radius of an amino acid. The horizontal line marks the experimental value .
- Fig. 2.
-
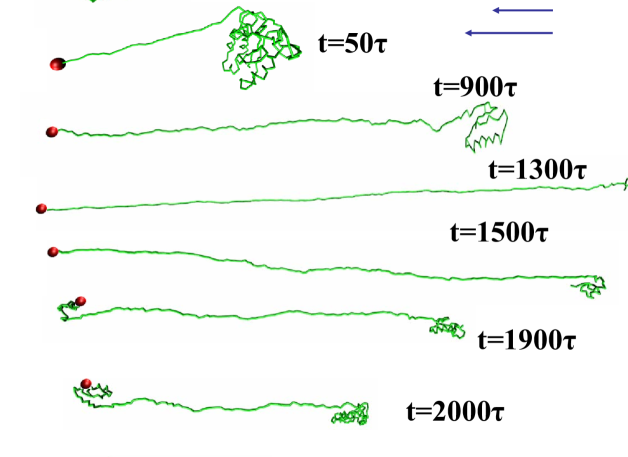
An example of cycle of the motion of the tethered protein motion in shear flow: integrin at (Wi=2000). The anchoring point (C terminus) is marked by a circle.
- Fig. 3.
-
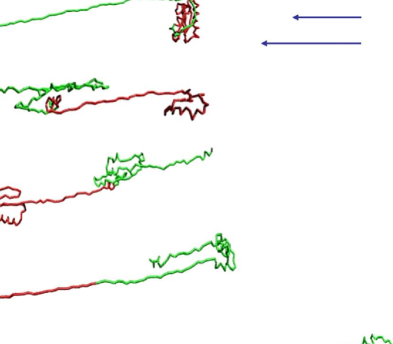
An example of cycle of the motion of a free protein in shear flow: integrin at (Wi=3200). For tracing purposes, half of the chain is colored red, and another half - green.
- Fig. 4.
-
Integrin tethered by the C terminus. (Upper) Examples of the time evolution of the RMSD from the native structure in unfolding of integrin in a uniform flow for various flow rates. The plateaus correspond to successive stationary conformations (intermediates) marked by the letters (A-E). The snapshots of conformations A,B,D, and E are shown on the right. (Lower) The histogram of RMSD for the integrin in a shear flow at Wi=2000. The respective values of RMSD corresponding to the intermediates seen in the upper panel are marked.
- Fig. 5.
-
Same as in the lower panel of Fig. 2 but for (Wi=3200).
- Fig. 6.
-
The histogram of RMSD for the helix (48 residues) in a shear flow at .
- Fig. 7.
-
The relative extension of the integrin molecule as a function of the Weissenberg number for a chain tethered by the C terminus (filled triangles), N terminus (empty triangles) and a free chain (squares). The average end-to-end distance of the molecule (L) is normalized by the maximum extension length Å, where is the number of amino acids.
- Fig. 8.
-
Power spectral density (psd) of the protein orientation angle for integrin tethered by the N terminus in a shear flow at Wi=1600. Frequencies are scaled by the protein folding time and the psd is normalized with its maximum value.
- Fig. 9.
-
The angle between the end-to-end direction of the protein and the direction of the flow (upper panel) and RMSD for integrin tethered by the C terminus in a shear flow at (lower panel).
- Fig. 10.
-
Same as in Fig. 9 but for .
- Fig. 11.
-
The peak frequencies, and derived from the power spectrum densities of orientation angle as a function of the Weissenberg number for integrin tethered by the C terminus (empty squares) and the N terminus (filled squares). The solid line corresponds to the relation .
- Fig. 12.
-
The relative extension of ubiquitin anchored by the N terminus as a function of the Weissenberg number for the model without hydrodynamic interactions (filled triangles), and with hydrodynamic interactions for Å (open triangles) and Å ( squares).