The Detection of Molecular Gas in the Outskirts of NGC 6946
Abstract
We present the results of a search for molecular gas emission via the CO line in the far outer disk of the nearby spiral, NGC 6946. The positions targeted were chosen to lie on or near previously-identified outer disk HII regions. Molecular gas was clearly detected out to 1.3 R25, with a further tentative detection at 1.4 R25. The CO detections show excellent agreement with the HI velocities and imply beam-averaged column densities of cm-2 and molecular gas masses of (2-70) M☉ per 21′′ beam (560pc). We find evidence for an abrupt decrease in the molecular fraction at the edge of the optical disk, similar to that seen previously in the azimuthally-averaged areal star formation rate. Our observations provide new constraints on the factors that determine the presence and detectability of molecular gas in the outskirts of galaxies, and suggest that neither the HI column, the metallicity or the local heating rate alone plays a dominant role.
1 Introduction
It has become increasingly apparent in recent years that star formation is not just confined to the optically-bright parts of galaxies. Signposts of low-level star formation, such as HII regions and UV-bright clusters, have been discovered in the far outer regions of galactic disks, well beyond the classical R25 radius (e.g. Ferguson et al. (1998a); Thilker et al. (2005)), and in the tidal HI filaments of some interacting systems (e.g. Ryan-Weber et al. (2004); Braine et al. (2001)). The existence of star formation in these unusual environments, characterised by low metallicity, low HI column density and low interstellar radiation field, provides important constraints on star formation in galaxies, as well as the necessary conditions for sustaining a multi-phase interstellar medium (ISM).
Much theoretical effort has been devoted to understanding the formation of a cold molecular phase in the ISM, a prerequisite for star formation. Thermal instabilities are generally believed to be the primary mechanism for converting cool atomic gas into cold molecular gas once a minimum pressure or local threshold surface density is exceeded (e.g. Elmegreen & Parravano (1994); Schaye (2004); Blitz & Rosolowsky (2006)). Additional mechanisms for forming unstable cold clouds include shocks from spiral density waves and swing-amplifier and magneto-Jeans instabiities (e.g. Dobbs et al. (2006); Kim et al. (2002)). The threshold column densities predicted for molecular cloud formation are on average a few times smaller than those inferred for massive star formation in galaxies (e.g. Skillman (1987); Martin & Kennicutt (2001)).
Direct detection of molecular clouds in extreme environments provides a means to test ideas about cloud formation and survival. Carbon monoxide (CO) is the most abundant heteronuclear molecule (i.e. with permitted rotational transitions) and is excited by collisions at densities typical of molecular clouds, making CO the standard tracer of molecular gas. Concerns have previously been raised (e.g. Pfenniger et al., 1994) as to whether the physical conditions in the outskirts of disks are sufficient to excite CO to detectable temperatures and whether the metallicities in these regions are sufficient to form enough CO for detection. With the discovery of CO emission out to 1.5 R25 in the disk of NGC 4414 (Braine & Herpin, 2004) and in high column density tidal HI filaments in the M81 Group (Brouillet et al., 1992; Walter et al., 2006), these concerns have been proven somewhat unfounded.
In this Letter, we present the results of a search for molecular gas in the far outer disk of the nearby spiral NGC 6946. While the study of molecular gas in NGC 4414 focused on high column HI regions (Braine & Herpin, 2004), we have chosen to search for CO emission in the vicinity of outer disk star-forming regions. NGC 6946 was previously identified through H observations to exhibit very extended massive star formation, out to R25 (Ferguson et al., 1998a), and thus presents an excellent opportunity to attempt to measure and quantify molecular gas at extreme radii. We also report on the null detection of molecular gas at two positions in the far outer disk of another spiral with extended star formation, NGC 1058.
2 Observations
Our search was conducted using the IRAM 30m telescope at Pico Veleta, Spain during July 7-13 1999 in very good summer weather. The 12CO J and J transitions at 115.271 and 230.538 GHz were observed simultaneously in two polarizations (H and V) with the newly installed ”AB” SIS receivers. The filter bank back end was configured into four units of 256 x 1MHz channels, one for each polarization and each frequency, yielding a 650 km s-1 bandpass and a channel separation of km s-1 in the CO(1–0) transition, respectively 330 and 1.3 km s-1 in the CO(2–1) transition. Typical system temperatures (T) for the observations of NGC 6946 and NGC 1058 were 250 K at 115 GHz and 400 K at 230 GHz. All spectra are presented on the main beam temperature scale assuming forward and main beam efficiencies of 0.9 and 0.73 at 115 GHz and 0.84 and 0.51 at 230GHz.
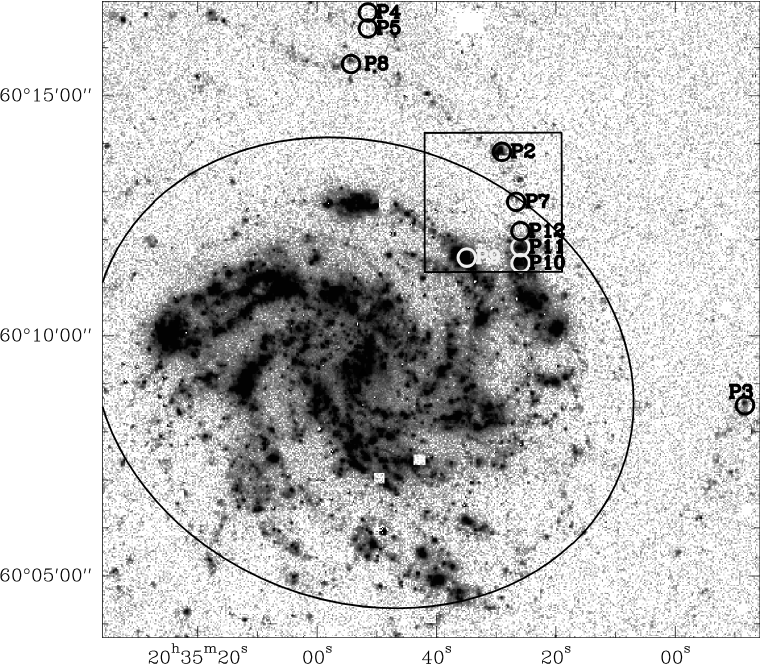
Single pointings were obtained on or near HII regions lying at radii in the range 0.7–1.6 R25 in NGC 6946 (see Figure 1), and 1.0–1.9 R25 in NGC 1058. The IRAM 30m beam size is 21 at 115 GHz and 11 at 230 GHz, corresponding to 560 and 280 pc respectively at the distance of NGC 6946 (5.5 Mpc, see Regan et al. (2006)) and 1 kpc and 0.5 kpc at the distance of NGC 1058 (10 Mpc, see Ferguson et al. (1998a)). As can be seen in Figure 1, the CO beam size was usually larger than the size of the target HII regions.
After eliminating obviously bad spectra and interpolating over occasional bad channels, spectra were summed for each transition and position. Despite observing in position-switching mode with a reference position typically R25 from the galaxy, only a zero-order baseline subtraction was required.
3 Results
The results of our CO search are presented in Table 1. In NGC 6946, CO is clearly detected at 7 out of 10 positions, ranging from 0.7–1.3 R25, with a further tentative detection at 1.4R25 (P3). In NGC 1058, no detections were made.
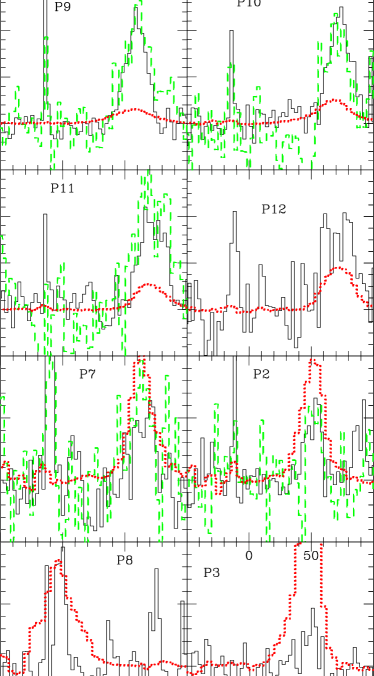
Figure 2 shows the CO(1-0) (and CO(2-1) when detected) spectra of the eight positions in NGC 6946 with molecular gas emission. CO(2–1) emission is detected at most positions with CO(1–0) emission which suggests that the gas is not highly subthermally excited, as it might be if it were extremely diffuse. HI spectra extracted at the same positions and with the same synthesized beam size are overlaid, taken from the 21cm data cube of Boomsma (2007). The HI and CO velocities show excellent agreement, with the maximum offset being less than 3 km s-1. The CO line widths, as determined from gaussian fits, are in the range 8–30 km s-1 and are greater than those expected from individual Giant Molecular Clouds (GMCs), even at the outermost positions. This implies that an ensemble of clouds is observed within the 560 pc CO(1–0) beam in each case, similar to the findings of Braine & Herpin (2004) for the outer disk of NGC 4414.
The spectra at the two outermost positions warrant further discussion. The systemic velocity of NGC 6946 is very close to the velocity of the HI and CO in the Milky Way, thus making comparisons at some positions more difficult than they would be in higher velocity systems. The detection at P8 (1.3 R25) could be called into question since the emission line is separated by only a single velocity channel from the narrow Galactic line at this position. If the line emission were Galactic in origin then we would expect it to have a significant spatial extent on the sky and to be detected at positions P5 and P4. For a GMC lying 500 pc along the line of sight (i.e. 100 pc above the Galactic plane), P5 and P4 correspond to linear distances of 0.12 and 0.16 pc from P8. No CO emission at the velocity detected at P8 is seen at these positions. Fig. 2 shows that weak HI is detected at the local velocity ( km s-1) by the WSRT in all positions but there is likely some spatial filtering out of the local HI signal. At P8 the HI is much stronger at the velocity of the CO we attribute to NGC 6946, further strengthening our argument that the P8 detection is real and that the line belongs to NGC 6946. We thus consider P8 to be a genuine detection of CO emission from NGC 6946.
The line emission at 150 km s-1 towards P3 (1.4 R25) is statistically significant () but another ”line” of similar strength is seen at 270 km s-1. The precise agreement between the CO and HI line velocities at this position certainly supports the reality of the CO feature but the presence of the other peak casts some doubt. As a result, we consider P3 as a probable but still tentative detection.
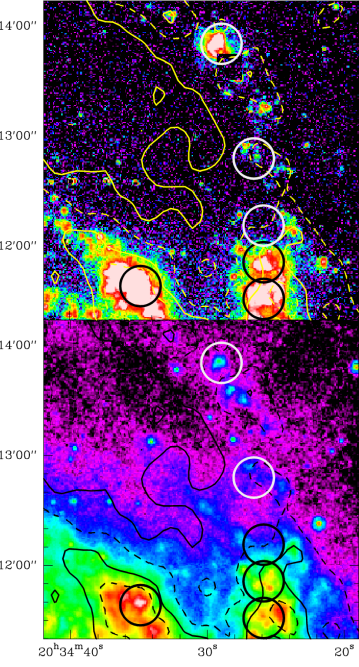
Figure 3 shows a view of the spiral arm segment containing positions P2, P7, and P9–P12 in the H line and in 8m emission, usually attributed to PAHs, with HI contours overlaid. The PAH emission was observed as part of the SINGS project with Spitzer. While the locations of the HI, H, and PAH 8m emission are closely correlated, the intensities of the emission at different wavelengths do not correlate. While P11 and P2 have similar H intensities (see also Table 1), the 8m and CO emission is much weaker further out. The N(H2)/N(HI) ratio also decreases, by more than an order of magnitude, from 0.7 to 1.4 R25 and is largely driven by a sharp decrease in the CO intensity as one crosses R25 (P12 to P7).
Table 1 also lists the implied H2 column density at each position, derived using a ”standard” conversion factor of H2 cm-2 per K km s-1 (Dickman et al., 1986), and the molecular gas mass within the beam, including a correction for Helium. The masses inferred are in the range M ☉. Digel et al. (1994) studied molecular clouds in the far outer disk of the Milky Way (presumably beyond R25 assuming a standard rotation curve) and found clouds of much lower mass, in the range M ☉. If such clouds also exist in the outskirts of NGC 6946, they would individually lie well below our detection limit of M ☉.
4 Discussion
We have presented evidence for the existence of molecular gas in the far outskirts of NGC 6946 and noted a rather abrupt decrease in the molecular gas fraction, as well as the PAH emission, as one crosses R25 along an individual spiral arm. An important question is whether this behavior could be explained by metallicity variations in the underlying gas disk. Indeed there is strong evidence for a radially increasing value (e.g. Sodroski et al., 1995) as well as much higher values in low-metallicity systems (e.g. Rubio et al., 1991). The metallicity in the outer disk of NGC 6946 varies by a factor from log(O/H) to (Ferguson et al., 1998b) while the ICO/N(HI) ratio decreases by a factor of . Focusing only on the positions which bridge R25 (P12 to P2), the metallicity remains essentially constant while the ICO/N(HI) ratio decreases by a factor of . In the absence of a very strong radiation field, the factor should not vary more than linearly with metallicity and Wilson (1995) estimates that from a study of molecular clouds in Local Group galaxies. It is thus reasonable to expect that the ratio might be a factor 2 – 3 higher in the most distant points than at P9, where the ”standard” value is probably appropriate. Such a correction is not sufficient to explain the strong decrease in ICO/N(HI) at R25 and we conclude that there is a genuine drop in the molecular gas content at the edge of the optical disk as defined by R25.
Although our pointings were selected to lie on or near outer disk HII regions, the H luminosity contained within each beam shows significant variation and corresponds to local star formation rates (SFRs) ranging from M⊙ yr-1, using the Kennicutt (1998) calibration (SFRL(H erg s-1). The H emission in some regions is predominantly diffuse (e.g. P12 and P7) and may more reflect ionization by photons produced elsewhere rather than in situ star formation (Ferguson et al., 1996). The star formation efficiency (SFE), defined as SFR/M(H2), ranges from Gyr-1; eliminating the two outlier points (P12 and P2), the range reduces to Gyr-1. The mere presence of a luminous HII region does not guarantee the detection of molecular gas. Position P1 in NGC 1058 is the second most luminous star-forming region targeted in our study, and is our second most sensitive integration, yet CO was not detected there. Intriguingly, there is a potential correlation between the detection of CO(2–1) emission and the presence of a luminous HII region in that the three non-detections of CO(2–1) are among the four lowest H fluxes.
With the exception of P4, the HI column densities at our observed positions within NGC 6946 are quite high, close to or greater than cm-2 on the scale of several hundred parsecs. The HI column density may be an important factor in determining whether molecular gas will be detected but a high HI column is clearly not a sufficient condition (see also Gardan et al., 2007).
It may be purely coincidental that N(H2)/N(HI) changes abruptly across R25 in NGC 6946. While R25 provides a means to characterise the optical extents of galaxies, it is not expected to relate to any underlying physical properties. In NGC 6946, neither the metallicity, the HI surface density nor the surface brightness of the stellar disk exhibit unusual features at this location. Interestingly, the azimuthally-averaged areal star formation rate in NGC 6946 does show a sharp decline near the edge of the optical disk ( R25), although widespread low-level star formation is observed much further out (Ferguson et al., 1998a; Martin & Kennicutt, 2001). The rough correspondence between the star formation and molecular profile breaks could provide support for threshold models (e.g. Elmegreen & Parravano, 1994; Schaye, 2004) although the physics that drives this behavior is still open to debate. Pressure based (Elmegreen & Parravano, 1994; Blitz & Rosolowsky, 2006) and column density based (Schaye, 2004) models are very difficult to distinguish once the HI surface density exceeds that of the stars. Larger-scale mapping of the outer disk of NGC 6946 and sensitive observations of the outskirts of additional galaxies are required in order to more thoroughly understand the molecular content and distribution at large galactocentric radii.
References
- Blitz & Rosolowsky (2006) Blitz, L., & Rosolowsky, E. 2006, ApJ, 650, 933
- Boomsma (2007) Boomsma, R. 2007, Ph.D. Thesis, University of Groningen.
- Braine & Herpin (2004) Braine, J., & Herpin, F. 2004, Nature, 432, 369
- Braine et al. (2001) Braine, J., Duc, P.-A., & Lisenfeld, U. et al. 2001, A&A, 378, 51
- Brouillet et al. (1992) Brouillet, N., Henkel, C., & Baudry, A. 1992, A&A, 262, L5
- Considere & Athanassoula (1988) Considere, S., & Athanassoula, E. 1988, A&AS, 76, 365
- de Vaucouleurs et al. (1991) de Vaucouleurs, G., de Vaucouleurs, A., Corwin, H. G., Jr., Buta, R. J., Paturel, G., & Fouque, P. 1991, Volume 1-3, XII, 2069 pp. 7
- Dickey et al. (1990) Dickey, J. M., Hanson, M. M., & Helou, G. 1990, ApJ, 352, 522
- Dickman et al. (1986) Dickman, R. L., Snell, R. L., & Schloerb, F. P. 1986, ApJ, 309, 326
- Digel et al. (1994) Digel, S., de Geus, E., & Thaddeus, P. 1994, ApJ, 422, 92
- Dobbs et al. (2006) Dobbs, C. L., Bonnell, I. A., & Pringle, J. E. 2006, MNRAS, 371, 1663
- Elmegreen & Parravano (1994) Elmegreen, B. G., & Parravano, A. 1994, ApJ, 435, L121
- Ferguson et al. (1998a) Ferguson, A. M. N., Wyse, R. F. G., Gallagher, J. S., & Hunter, D. A. 1998a, ApJ, 506, L19
- Ferguson et al. (1998b) Ferguson, A. M. N., Gallagher, J. S., & Wyse, R. F. G. 1998b, AJ, 116, 673
- Ferguson et al. (1996) Ferguson, A. M. N., Wyse, R. F. G., Gallagher, J. S., III, & Hunter, D. A. 1996, AJ, 111, 2265
- Gardan et al. (2007) Gardan, E., Braine, J., Schuster, K. F., Brouillet, N. & Sievers, A. 2007, A&A, 473, 91
- Kennicutt (1998) Kennicutt, R. C., Jr. 1998, ApJ, 498, 541
- Kim et al. (2002) Kim, W.-T., Ostriker, E. C., & Stone, J. M. 2002, ApJ, 581, 1080
- Martin & Kennicutt (2001) Martin, C. L., & Kennicutt, R. C., Jr. 2001, ApJ, 555, 301
- Regan et al. (2006) Regan, M. W., et al. 2006, ApJ, 652, 1112
- Pfenniger et al. (1994) Pfenniger, D., Combes, F., Martinet, L. 1994, A&A, 285, 79
- Rubio et al. (1991) Rubio, M., Garay, G., Montani, J., & Thaddeus, P. 1991, ApJ, 368, 173
- Ryan-Weber et al. (2004) Ryan-Weber, E. V., et al. 2004, AJ, 127, 1431
- Schaye (2004) Schaye, J. 2004, ApJ, 609, 667
- Sodroski et al. (1995) Sodroski, T. J., Odegard, N., Dwek, E., et al. 1995, ApJ, 452, 262
- Skillman (1987) Skillman, E. D. 1987, in Star Formation in Galaxies, p. 263.
- Thilker et al. (2005) Thilker, D. A., et al. 2005, ApJ, 619, L79
- Walter et al. (2006) Walter, F., Martin, C. L., & Ott, J. 2006, AJ, 132, 2289
- Wilson (1995) Wilson, C. D. 1995, ApJ, 448, L97
| Posn. | R.A. | Dec. | R/R25 | ICO(1-0) | rms | V | ICO(2-1) | rms | (O/H) | N(H2) | M(H2) | N(HI) | L(H) |
|---|---|---|---|---|---|---|---|---|---|---|---|---|---|
| (J2000.0) | (J2000.0) | K km s-1 | mK | km s-1 | K km s-1 | mK | dex | 1020cm-2 | 105M | 1020cm-2 | 1037erg s-1 | ||
| (1) | (2) | (3) | (4) | (5) | (6) | (7) | (8) | (9) | (10) | (11) | (12) | (13) | (14) |
| NGC 6946 | |||||||||||||
| P9 | 20 34 34.9 | 60 11 38.4 | 0.7 | 4.5 | 17 | 19 | 6.3 | 39 | -3.2 | 9.0 | 70 | 22.1 | 142.5 |
| P10 | 20 34 25.9 | 60 11 31.3 | 0.8 | 2.3 | 16 | 22 | 2.2 | 30 | -3.3 | 4.6 | 36 | 17.1 | 64.3 |
| P11 | 20 34 25.9 | 60 11 51.3 | 0.8 | 2.2 | 15 | 24 | 3.8 | 32 | -3.3 | 4.5 | 34 | 15.2 | 28.9 |
| P12 | 20 34 25.9 | 60 12 11.3 | 0.9 | 1.0 | 10 | 30 | 23 | -3.4 | 2.0 | 15 | 10.1 | 1.4 | |
| P7 | 20 34 26.6 | 60 12 47.9 | 1.0 | 0.21 | 4.3 | 18 | 0.22 | 7 | -3.4 | 0.4 | 3.3 | 9.2 | 2.2 |
| P2 | 20 34 29.0 | 60 13 50.5 | 1.1 | 0.14 | 3.0 | 14 | 0.14 | 5 | -3.5 | 0.3 | 2.2 | 8.3 | 28.8 |
| P8 | 20 34 54.3 | 60 15 40.5 | 1.3 | 0.15 | 5.0 | 8 | 13 | -3.6 | 0.3 | 2.3 | 8.9 | 4.2 | |
| P3 | 20 33 48.4 | 60 08 32.6 | 1.4 | 0.11 | 3.7 | 12 | 8 | -3.9 | 0.2 | 1.7 | 13.6 | 4.7 | |
| P5 | 20 34 51.4 | 60 16 24.9 | 1.5 | 6.1 | 24 | -3.8 | 10.2 | ||||||
| P4 | 20 34 51.4 | 60 16 44.9 | 1.6 | 6.7 | 20 | -3.8 | 5.0 | ||||||
| NGC 1058 | |||||||||||||
| P1 | 02 43 29.3 | 37 18 57.6 | 1.0 | 3.5 | -3.3 | 3.7 | 85.5 | ||||||
| P2 | 02 43 29.4 | 37 17 40.0 | 1.9 | 5.4 | -3.8 | 4.2 | 11.7 | ||||||
Note. — Units of right ascension are hours, minutes and seconds and units of declination are degrees, arcminutes and arcseconds. Col.(1): position ID. Cols.(2) and (3): Right ascension and declination of the pointing. Col.(4) the deprojected radius of the pointing in terms of R25, calculated for NGC 6946 using R (de Vaucouleurs et al., 1991), and and P.A. (Considere & Athanassoula, 1988) and for the almost face-on NGC 1058 using R (de Vaucouleurs et al., 1991) and and P.A.. Cols.(5) and (8): the CO(1–0) and CO(2–1) intensities on the main beam temperature scale respectively. Upper limits are 3 and calculated assuming a 7 channel (18.2 km s-1) line width. Cols.(6) and (9): the rms noise, measured per 2.6 km s-1 channel. Col.(7): the velocity width as determined from fitting gaussians to the CO(1–0) spectra. Col.(10) The oxygen abundance, from (Ferguson et al. (1998b) and Ferguson, unpublished. Note that the metallicities for NGC 6946-P3 and NGC 1058-P1 and P2 are directly measured, whereas those for other positions are inferred from interpolation of the abundance gradient. Cols. (11) and (12) the H2 column density and cloud mass, as described in the text. Col.(13) The HI column density at the position from Boomsma (2007) and Dickey et al. (1990). Col.(14) The H luminosity within a 21 aperture, corrected for Galactic extinction and [NII] emission.