High- =0 SiS Maser Emission in IRC+10216: A New Case of Infrared Overlaps
Abstract
We report on the first detection of maser emission in the =11-10, =14-13 and =15-14 transitions of the =0 vibrational state of SiS toward the C-rich star IRC+10216. These masers seem to be produced in the very inhomogeneous region between the star and the inner dust formation zone, placed at 5-7 R∗, with expansion velocities below 10 km s-1. We interpret the pumping mechanism as due to overlaps between =1-0 ro-vibrational lines of SiS and mid-IR lines of C2H2, HCN and their 13C isotopologues. The large number of overlaps found suggests the existence of strong masers for high- =0 and =1 SiS transitions, located in the submillimeter range. In addition, it could be possible to find several rotational lines of the SiS isotopologues displaying maser emission.
Subject headings:
circumstellar matter — masers — stars: AGB and post-AGB — stars: carbon1. Introduction
The detection of strong maser emission at the frequencies of pure rotational transitions of some molecules is a common phenomenon in circumstellar envelopes (CSE’s) of evolved stars (Elitzur, 1992; Gray, 1999). The maser is usually produced in a small region of the envelope and sometimes provides valuable information on the physical conditions of the emitting region.
Due to the different chemistry, masers are produced by different molecules in O- and C-rich stars. In O-rich stars, SiO exhibits strong maser emission in different rotational transitions within several vibrational states, from =1 to 4 (Cernicharo et al., 1993; Pardo et al., 1998). These masers are formed in a region of the CSE very close to the stellar surface and seem to be driven by NIR radiation (Pardo et al., 2004). In C-rich stars, although SiO is present with similar abundances than in O-rich stars (Schöier et al., 2006), no SiO maser has been detected. The explanation could be that SiO is formed at 3-5 R∗, where the angular dilution of the star is high and the density and temperature lower than in the regions where SiO masers are produced in O-rich stars (Agúndez & Cernicharo, 2006). In C-rich stars only HCN shows strong maser emission in several pure rotational lines within vibrational states from =1 to 4 (Lucas & Cernicharo, 1989; Schilke & Menten, 2003). These masers must be formed in the innermost regions of the CSE. SiS has been previously found to show weak maser emission in the =1-0 =0 transition in IRC+10216 (Henkel et al., 1983).
In this letter, we report on the first detection of maser emission from the =11-10, 14-13 and 15-14 transitions in the =0 vibrational state of SiS (hereafter M1, M2, and M3) observed toward the C-rich star IRC+10216. We have also obtained observations of =1 rotational lines which exhibit thermal emission. We propose that overlaps of =1-0 ro-vibrational transitions of SiS with mid-IR lines of C2H2 and HCN could provide the pumping mechanism for these masers as well as higher- =0 SiS masers in the submillimeter range. This discovery is interesting because this species could play in C-rich stars a role similar to that of SiO in O-rich stars: the energy level pattern of both molecules is similar and it is also formed close to the star, as chemical equilibrium and interferometric observations imply (Bieging & Nguyen-Q-Rieu, 1989).
2. Observations
The observations of the =0 =6-5 and =8-7 to =15-14 transitions of SiS (see left panels, Fig. 1) were carried out on 2004 June 19 with the IRAM 30 m radio telescope. Four SIS receivers operating at 1, 1.3, 2, and 3 mm were used simultaneously. System temperatures were in the range 120-225 K for the 1, 1.3 and 2 mm receivers and 200-600 K for the 1 mm receivers. Atmospheric opacities ranged between 0.08 at 108 GHz to 0.28 at 267 GHz. For the =10-9 SiS line at 181.5 GHz, the system temperature was significantly higher, 104 K, due to proximity to the atmospheric water line at 183.3 GHz. The intensity scale was calibrated using two absorbers at different temperatures according to the Atmosphere Transmission Model ATM (Cernicharo, 1985; Pardo et al., 2001). Pointing and focus were regularly checked on the nearby quasar OJ 287. The observations were made in wobbling mode, with 180” offset and the secondary nutating at a rate of 0.5 Hz. The backends were a filter bank with 256 MHz bandwidth and 1 MHz resolution and an autocorrelator with 80 kHz resolution (0.080.2 km s-1). The lines of SiS in the =1 state (see right panel, Fig. 1) were also observed with the IRAM 30 m telescope between 1989 and 2001.
Additionally we show some spectra corresponding to ro-vibrational lines of SiS (see center panels in Fig. 1) from a mid-IR high resolution spectrum (11-14 m) obtained in 2002 December with the TEXES spectrometer mounted on the 3 m telescope IRTF (observational procedures described in Lacy et al., 2002; Fonfría Expósito et al., 2006).
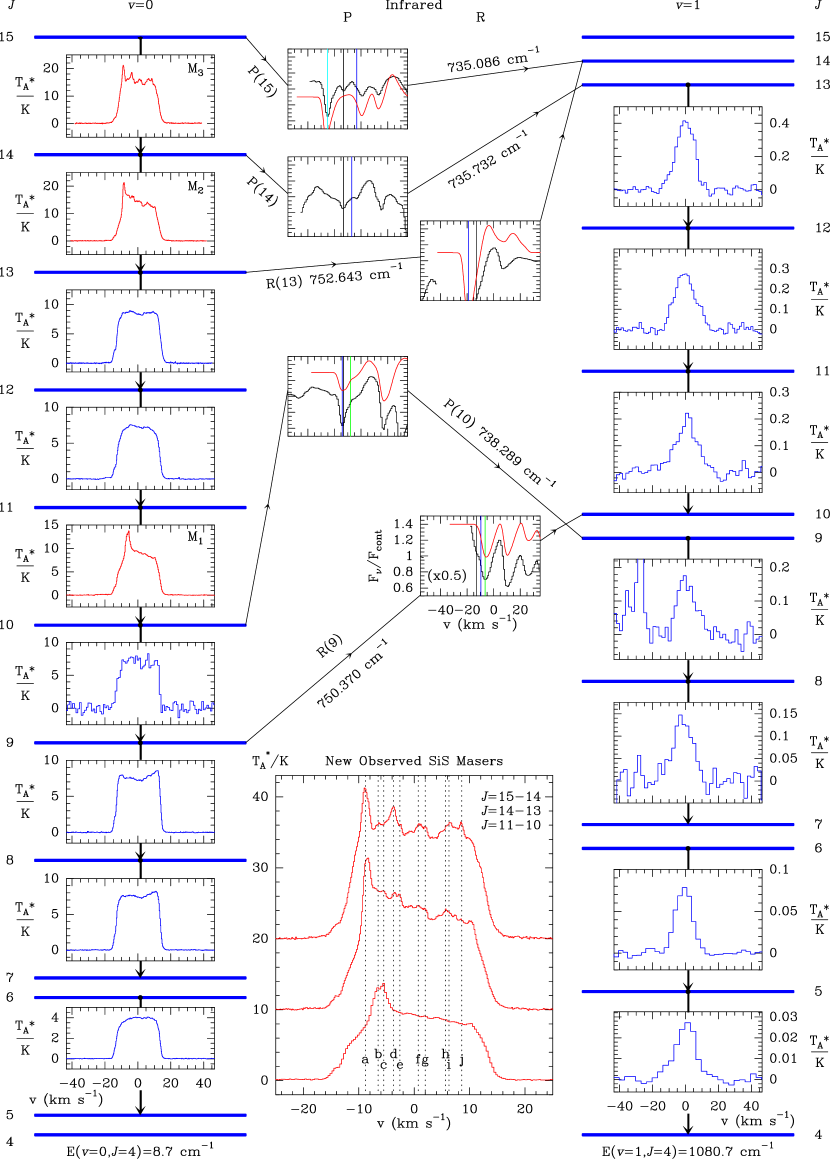
3. Results and Discussion
The =1 rotational lines show single cusped profiles and their relative intensities indicate that the rotational levels are thermally populated. The linewidths correspond to velocities of 9-11 km s-1, lower than the terminal velocity 14.5 km s-1 (Cernicharo et al., 2000), thus the emission arises from the innermost region of the CSE, between the photosphere and the inner dust formation zone, placed at 5 R∗ (Keady et al., 1993). We can derive the SiS abundance in that region from the =1 lines assuming an uniform sphere at a distance of 180 pc with a radius of 10 R∗, illuminated by the central star (R∗=51013 cm, T∗=2300 K), with T=1000 K and n=1.6109 cm-3 (mean values for this region derived by Fonfría Expósito et al. 2006) and an expansion velocity of 11 km s-1. We solve the statistical equilibrium for SiS considering 100 rotational levels and 3 vibrational states and apply the LVG radiative transfer formalism using the code developed by J. Cernicharo. With the assumed n, the column density for H2 is 71023 cm-2 and the derived one for SiS is 5.01018 cm-2. Hence, the SiS abundance is 710-6. This result is compatible with a higher SiS abundance in the innermost CSE (from LTE chemistry models, 310-5, Agúndez & Cernicharo 2006) and an abundance further away of 6.5 according to observations of =0 rotational lines over the outer CSE by Bieging & Nguyen-Q-Rieu (1989).
Most =0 rotational lines show a rounded or slightly double peaked profile with the blue part absorbed by cold SiS through the envelope. However, M1, M2 and M3 show extra emission in the form of narrow peaks (FWHM=1-3 km s-1). The velocities of these features, within the to 10 km s-1 range, indicate that SiS maser emission arises from different regions located between the star and the inner dust formation zone (5 R∗). The lines M2 and M3 have been previously observed by Sahai et al. (1984) but no maser emission was noticed. This could be due either to the limited sensitivity of their observations or to a time variability of the SiS maser phenomenon. The bottom-center panel of Fig. 1 shows in detail the line profiles of the observed masers. Up to ten maser features labelled (,…,) are identified. The most complex line profile is that of M3. It is formed by 5 main features: , , , , with =, , , and km s-1, respectively. The line profiles show that the strongest peaks are at negative velocities, having their red counterparts rather weak. This behavior was previously found by Henkel et al. (1983) for the =0 =1-0 line, which mostly consists of a narrow peak (FWHM=0.3 km s-1) centered at km s-1. The strong asymmetry of the lineshapes can be either due to blanking by the star of the redshifted maser or by amplification of the blueshifted emission by the foreground stellar environment.
The strongest observed maser, M3, with T60 K (F300 Jy; with thermal and non-thermal emission), is weak compared to some SiO masers detected in O-rich stars (e.g. Cernicharo et al., 1993) or to HCN masers observed in IRC+10216 (Lucas & Cernicharo, 1989; Schilke & Menten, 2003). However, M1, M2, and M3 are stronger than the SiS =1-0 maser observed towards IRC+10216 by Henkel et al. (1983). The similarity between maser features in M2 and M3 indicates that they may arise from the same regions and produced by the same pumping mechanism; the maser in M1 is probably formed in other regions. Hence, we suggest two possible geometries of the innermost CSE to explain the observed features:
() An onion-like innermost region, where each maser is produced in a shell. This hypothesis is supported by the symmetry of features – and –. The peaks at extreme velocities, and , would be produced just in front of and behind the star near the inner dust formation shell (5 R∗) with expansion velocities of 5-11 km s-1. The features and would be produced in a similar way but in an inner shell with a lower expansion velocity. Finally, the central peak, , would be formed in a shell very close to the star, with the whole shell contributing to the maser emission. M1 would be produced in a cap-shaped region in front of the star.
() All the masers are formed in different positions of a clumpy shell. The different features in M2 and M3 would be produced in different regions of the shell: peaks and in front of and behind the star and the other peaks (, , and ) in different clumps, as occur with the only feature of M1.
The classic pumping mechanism for the SiO 0 masers observed in O-rich stars resides in the increase of the trapping lifetime (A/)v→v-1 with for -1 transitions, when they become optically thick (Kwan & Scoville, 1974). Such mechanism produces masers in adjacent rotational lines of the state, and explains the =1 and 2 SiO masers (Bujarrabal & Nguyen-Q-Rieu, 1981; Lockett & Elitzur, 1992). However, the masers observed in rotational transitions of 29SiO, 30SiO, and in =3 and 4 of SiO do not show the latter behavior and have been interpreted as due to IR overlaps between ro-vibrational lines of SiO isotopologues (Cernicharo et al., 1991; González-Alfonso & Cernicharo, 1997). For SiS, the absence of maser emission in =1 rotational lines and the odd =0 pattern also exclude the Kwan & Scoville pumping mechanism. This suggests that overlaps of =1-0 ro-vibrational transitions of SiS with those of mode of C2H2 and mode of HCN, could provide the pumping mechanism. C2H2 and HCN are abundant in the inner CSE of IRC+10216 and dominate the 11-14 m spectrum (Fonfría Expósito et al., 2006). Overlaps with these two species have been already proposed by Sahai et al. (1984) to explain the different profiles of adjacent lines of SiS. However, the SiS frequencies used in that work were not as accurate (10-1 cm-1) as those available today. We have calculated those frequencies from the Dunham coefficients determined by Sanz et al. (2003), for which the error of the band center is cm-1 (0.04 km s-1; the relative accuracy of P and R lines is much better). The frequencies of C2H2, H13CCH, HCN, and H13CN lines have been taken from the HITRAN Database 2004 (Rothman et al., 2005), with an accuracy better than cm-1 (0.4 km s-1) for C2H2 and H13CCH, and cm-1 for HCN and H13CN.
Table 1 shows the mid-IR line overlaps of SiS with C2H2, HCN, and their most abundant isotopologues. For the overlap search we selected coincidences within 10 km s-1. However, since the CSE is expanding, every region of the envelope is receding from the others. Hence, if the population of the SiS levels is affected by an overlap with a strong line of other species, the frequency of this overlapping transition must be higher than the SiS one. This would restrict the condition to positive . Nevertheless, due to the linewidth, lines at 0 can overlap the SiS lines. Hence, we have set the negative cutoff to one half of the typical linewidth in the innermost CSE (5 km s-1; Fonfría Expósito et al. 2006). Therefore, our search is restricted to km s-1. All the ro-vibrational SiS lines commented hereafter refer to =10 transitions and will be labelled with the usual spectroscopic nomenclature R, Q, P (see footnote of Table 1).
| Line | (cm-1) | Mol. | Transition | (km/s) |
|---|---|---|---|---|
| Overlaps Involving SiS Levels of Observed Lines | ||||
| R 9 | 750.3695 | HCN | R | |
| P10 | 738.2889 | C2H2 | R | 1.2 |
| R13 | 752.6431 | C2H2 | R | 5.9 |
| P14 | 735.7324 | C2H2 | Q | |
| P15 | 735.0861 | C2H2 | Q | |
| Overlaps Involving SiS Levels of Unobserved Lines | ||||
| P 2 | 743.2624 | C2H2 | R | 0.6 |
| P16 | 734.4368 | C2H2 | Q | 1.1 |
| P20 | 731.8114 | C2H2 | Q | 9.5 |
| P22 | 730.4815 | C2H2 | Q | |
| R22 | 757.5819 | C2H2 | R | 0.1 |
| R22 | 757.5819 | H13CN | R | 5.2 |
| P23 | 729.8123 | H13CCH | Q | 8.7 |
| P24 | 729.1402 | C2H2 | Q | 9.4 |
| P25 | 728.4654 | H13CCH | Q | |
| R25 | 759.1733 | HCN | R | 3.6 |
| R26 | 759.6977 | C2H2 | R | |
| R33 | 763.2816 | H13CN | R | 6.1 |
| P38 | 719.4363 | C2H2 | P | 4.5 |
| R40 | 766.7130 | C2H2 | R | 4.3 |
| R42 | 767.6652 | C2H2 | R | 8.7 |
| R45 | 769.0697 | C2H2 | R | |
| P48 | 712.1720 | C2H2 | P | 4.7 |
Note. — Overlaps of SiS with C2H2, H13CCH, HCN and H13CN found in the mid-IR range cm-1 with km s-1, where and , (corresponding SiS =0 rotational frequencies below 900 GHz). The lines and frequencies at the left correspond to the vibrational transitions =10 of SiS. The errors on the velocities are km s-1. The notation for the C2H2 and H13CCH vibrational states involved in the ro-vibrational transitions is , whereas for HCN and H13CN is . The parity of the lower level is even () and odd (). The transitions are labelled as R, P, and Q for , , 0.
In order to qualitatively interpret the effects of IR overlaps on maser emission, we have used the same LVG radiative transfer code modified to account for overlaps, changing the intensity at the overlapping frequency and the escape probability for photons from the overlapped lines. Thus, for some SiS lines, the excitation temperature becomes negative (maser activation) and the brightness temperature is considerably enhanced. M2 and M3 are naturally explained by the overlap of the R line of SiS with the strong C2H2 line R (Table 1). SiS molecules are easily excited from =0 =13 to =1 =14 through R and decay to the =0 =15 via P, creating a population inversion between the =0 =13 and 15, and producing maser emission in M2 and M3. M1 may be produced by the overlap of the P SiS line with the strong C2H2 line R. This overlap can pump SiS molecules from =0 =10 to =1 =9 through P, depopulates the =0 =10 level and produces the inversion between =0 =10 and 11.
We have also looked for overlaps of =1-0 higher- SiS lines with C2H2 and HCN transitions to try to predict SiS masers at submillimeter wavelengths. Some of them are shown in the second block of Table 1. They suggest, for example, that a maser could be found in rotational transitions involving the =0 =23 level (likely =24-23 and maybe 23-22), or the =0 =25 and 26 states (perhaps in the =0 =27-26 and maybe 26-25). These overlaps could also produce masers in =1 rotational transitions.
There are many overlaps of other SiS isotopologues with lines of C2H2, HCN and 28Si32S. With the adopted criteria for the overlap search (see footnote of Table 1), we have found 91, 93, 76, and 94 coincidences for 29SiS, 30SiS, Si34S, and Si33S, respectively. Consequently, although these species are less abundant than 28Si32S, the population of some levels could be inverted producing maser emission.
This study represents the discovery of three new SiS masers and should be complemented with future observations of higher- =0 and 1 rotational transitions. Furthermore, a detailed multi-molecule non-local radiative transfer model would help to understand the dust formation region and the role of SiS in C-rich evolved stars.
References
- Agúndez & Cernicharo (2006) Agúndez, M. & Cernicharo, J., 2006, ApJ, astro-ph/0605645
- Bieging & Nguyen-Q-Rieu (1989) Bieging, J., H. & Nguyen-Q-Rieu, 1989, ApJ, 343, L25
- Bujarrabal & Nguyen-Q-Rieu (1981) Bujarrabal, V. & Nguyen-Q-Rieu, 1981, A&A, 102, 65
- Cernicharo (1985) Cernicharo, J. 1985, ATM: A Program to Compute Atmospheric Opacity between 0 and 1000 GHz, IRAM Internal Report
- Cernicharo et al. (1991) Cernicharo, J., Bujarrabal, V., & Lucas, R., 1991, A&A, 249, L27
- Cernicharo et al. (1993) Cernicharo, J., Bujarrabal, V., & Santarén, J., L., 1993, ApJ, 407, L33
- Cernicharo et al. (2000) Cernicharo, J., Guélin, M., & Kahane, C., 2000, A&AS, 142, 181
- Elitzur (1992) Elitzur, M., 1992, ARA&A, 30, 75
- Fonfría Expósito et al. (2006) Fonfría Expósito, J. P., Cernicharo, J., Richter, M. J., & Lacy, J., 2006, ApJ, submitted
- González-Alfonso & Cernicharo (1997) González-Alfonso, E. & Cernicharo, J., A&A, 322, 938
- Gray (1999) Gray, M., 1999, Philos. Trans. R. Soc. London A., 357, 3277
- Henkel et al. (1983) Henkel, C., Matthews, H. E., & Morris, M., 1983, ApJ, 267, 184
- Keady et al. (1988) Keady, J. J., Hall, D. N. B., & Ridgway, S., T., 1988, ApJ, 326, 832
- Keady et al. (1993) Keady, J. J. & Ridgway, S., T., 1993, ApJ, 406, 199
- Kwan & Scoville (1974) Kwan, J. & Scoville, N., 1974, ApJ, 194, L97
- Lacy et al. (2002) Lacy, J. H., Richter, M. J., Greathouse, T. K. et al., 2002, PASP, 114, 153
- Lafont et al. (1982) Lafont, S., Lucas, R., & Omont, A., 1982, A&A, 106, 201
- Lockett & Elitzur (1992) Lockett, P. & Elitzur, M., 1992, ApJ, 399, 704
- Lucas & Cernicharo (1989) Lucas, R. & Cernicharo, J., 1989, A&A, 218, L20
- Pardo et al. (1998) Pardo, J. R., Cernicharo, J., González-Alfonso, E., & Bujarrabal, V., 1998, 329, 219
- Pardo et al. (2001) Pardo, J. R., Cernicharo, J., & Serabyn, G., 2001, IEEE Trans. Antennas Propagation, 46, 1683
- Pardo et al. (2004) Pardo, J. R., Alcolea, J., Bujarrabal, V., Colomer, F., del Romero, A., & de Vicente, P., 2004, 424, 145
- Rothman et al. (2005) Rothman, L. S., Jacquemart, D., et al., 2005, J. Quant. Spec. Radiat. Transf., 96, 139
- Sahai et al. (1984) Sahai, R., Wootten, A., & Clegg, R. E. S., 1984, ApJ, 284, 144
- Sanz et al. (2003) Sanz, M. E., McCarthy, M. C., & Thaddeus, P., 2003, J. Chem. Phys., 119, 11715
- Schilke & Menten (2003) Schilke, P. & Menten, K. M., 2003, ApJ, 583, 446
- Schöier et al. (2006) Schöier, F. L., Olofsson, H., & Lundgren, A. A., 2006, A&A, astro-ph/0604213