A Search for Near-Infrared Molecular Hydrogen Emission in the CTTS LkH 264 and the debris disk 49 Cet ††thanks: Based on observations collected at the European Southern Observatory, Chile (program ID 60.A-9064(A)).
We report on the first results of a search for molecular hydrogen emission from protoplanetary disks using CRIRES, ESO’s new VLT Adaptive Optics high resolution near-infrared spectrograph. We observed the classical T Tauri star LkH 264 and the debris disk 49 Cet, and searched for S(1) H2 emission at 2.1218 m, S(0) H2 emission at 2.2233 m and S(1) H2 emission at 2.2477 m. The H2 line at 2.1218 m is detected in LkH 264 confirming the previous observations by Itoh et al. (2003). In addition, our CRIRES spectra reveal the previously observed but not detected H2 line at 2.2233 m in LkH 264. An upper limit of 5.3 ergs s-1 cm-2 on the S(1) H2 line flux in LkH 264 is derived. The detected lines coincide with the rest velocity of LkH 264. They have a FWHM of 20 km s-1. This is strongly suggestive of a disk origin for the lines. These observations are the first simultaneous detection of S(1) and S(0) H2 emission from a protoplanetary disk. 49 Cet does not exhibit H2 emission in any of the three observed lines. We derive the mass of optically thin H2 at K in the inner disk of LkH 264 and derive stringent limits in the case of 49 Cet at the same temperature. There are a few lunar masses of optically thin hot H2 in the inner disk ( 0.1 AU) of LkH 264, and less than a tenth of a lunar mass of hot H2 in the inner disk of 49 Cet. The measured 1-0 S(0)/1-0 S(1) and 2-1 S(1)/1-0 S(1) line ratios in LkH 264 indicate that the H2 emitting gas is at a temperature lower than 1500 K and that the H2 is most likely thermally excited by UV photons. The S(1) H2 line in LkH 264 is single peaked and spatially unresolved. Modeling of the shape of the line suggests that the disk should be seen close to face-on () and that the line is emitted within a few AU of the LkH 264 disk. A comparative analysis of the physical properties of classical T Tauri stars in which the H2 S(1) line has been detected and non-detected indicates that the presence of H2 emission is correlated with the magnitude of the UV excess and the strength of the H line. The lack of H2 emission in the NIR spectra of 49 Cet and the absence of H emission suggest that the gas in the inner disk of 49 Cet has dissipated. These results combined with previous detections of 12CO emission at sub-mm wavelengths indicate that the disk surrounding 49 Cet should have an inner hole. We favor inner disk dissipation by inside-out photoevaporation, or the presence of an unseen low-mass companion as the most likely explanations for the lack of gas in the inner disk of 49 Cet.
Key Words.:
stars: emission-line – stars: pre-main sequence – planetary systems:protoplanetary disks| Star | Sp.T. | Age | CO sub-mm | object | ||||
| [K] | [pc] | [Myr] | [MJ] | |||||
| LkH 264 | K5Vea | 4350b | 300c | 2d | … | 85a | CTTS | |
| 49 Cet | A1Ve | 9970b | 61f | 20g | 0.4 | debris disk | ||
| a Itoh et al. (2003b). b Kenyon & Hartmann (1995). c Straižys et al. (2002). d Jayawardhana et al. (2001). | ||||||||
| e From Chen et al. (2006). f Hipparcos catalogue. g Zuckerman & Song (2004). h Dent et al. (2005) | ||||||||
| i Zuckerman et al. (1995). j Thi et al. (2001) and Bocklée-Morvan et al. (1995). | ||||||||
| refers to the total mass in the disk deduced from mm dust continuum emission assuming a | ||||||||
| gas to dust ratio of 100. | ||||||||
1 Introduction
The discovery of extrasolar planets triggered an increasing interest in the physical mechanisms behind the process of planet formation. Many recent efforts have been directed to the study of disks surrounding pre-main-sequence stars. Observational and theoretical evidence suggests that planets are forming in these disks. The observational characterization of the physical structure and dynamics of the gas and dust in protoplanetary disks is of paramount importance for understanding the process of planet formation.
In the inner 1 AU of protoplanetary disks, intense UV or X-ray heating can bring the gas temperatures to a few thousand Kelvin. At these high temperatures, ro-vibrational transitions of H2 are excited and a rich spectrum of H2 lines in the near-infrared is expected to be produced. The study of H2 quiescent ro-vibrational emission111By quiescent emission we mean emission at the rest velocity of the star. H2 emission can also be produced by shocked gas associated with outflows. However, in such a case the emission is expected to be doppler shifted more than 20 km s-1 with respect to the rest velocity of the star. towards pre-main-sequence stars with disks offers the opportunity to address the question of the presence of hot gas in the disk, by probing the temperature and density in the innermost regions where terrestrial planets are expected to form. For example, the H2 S(1) line at 2.1218 m (one of the strongest H2 ro-vibrational lines) is sensitive to a few lunar masses of gas. Therefore, the absence of the line would be strongly suggestive of little or no hot gas in the systems.
In this paper we present the first results of a sensitive search for near-infrared H2 emission from protoplanetary disks using CRIRES, ESO’s new VLT near-infrared high-resolution spectrograph. We searched for the H2 S(1) line at 2.1218 m, H2 S(0) line at 2.2233 m and H2 S(1) line at 2.2477 m, towards LkH 264, a classical T Tauri star with previously reported detections of the S(1) line by Itoh et al. (2003), and 49 Cet, a debris disk with evidence of a large reservoir of cold gas at sub-mm wavelengths (Dent et al. 2005, Zuckerman et al. 1995). For a summary of the stellar physical properties of LkH 264 and 49 Cet see Table 1. We confirm the detection of H2 emission at 2.1218 m in LkH 264, and announce, for the first time, the detection of H2 emission at 2.2233 m from a disk (LkH 264). We report the non-detections of H2 emission at 2.2477 m in LkH 264, and at 2.1218, 2.2233 and 2.2477 m in 49 Cet.
The paper is organized as follows. We start with a description of the observations and the data reduction. In section 3 we present our results and calculate the mass limits for the hot ( K) H2 in the systems. In Section 4, based upon the measured 1-0 S(0)/1-0 S(1) and 2-1 S(1)/1-0 S(1) line ratios in LkH 264, we determine the excitation mechanism of the observed H2 emission. By modeling of the shape of the S(0) H2 line, we derive constraints on the H2 emitting region and the inclination of the disk around LkH 264. Finally we discuss the disk properties of the stars in which H2 emission has been detected and the prospects for future investigations. Our conclusions are presented in Section 5.
| Star | Date | UT | Airmass | seeing | Calibrator a | Airmass | seeing | |||
| [m] | [hh:mm] | [s] | [arcsec] | [s] | [arcsec] | |||||
| LkH 264 | 2.1218 | 8 Nov 2006 | 06:25 | 720 | 1.4 | 1.2 | HIP 13327 | 160 | 1.3 | 0.9 |
| 2.2233, 2.2477 | 8 Nov 2006 | 06:52 | 720 | 1.4 | 1.0 | HIP 13327 | 160 | 1.3 | 0.9 | |
| 49 Cet | 2.1218 | 9 Nov 2006 | 02:38 | 240 | 1.1 | 0.8 | HIP 8497 | 40 | 1.0 | 1.2 |
| 2.2233, 2.2477 | 9 Nov 2006 | 03:07 | 240 | 1.2 | 0.7 | HIP 8497 | 40 | 1.0 | 1.2 | |
| a Spectrophotometric standard stars were observed immediately following the science observations. | ||||||||||
| LkH 264 | 49 Cet | ||||||
| 1-0 S(1) | 1-0 S(0) | 2-1 S(1) | 1-0 S(1) | 1-0 S(0) | 2-1 S(1) | ||
| 2.1218 m | 2.2233 m | 2.2477 m | 2.1218 m | 2.2233 m | 2.2477 m | ||
| Continuum | [ergs s-1 cmm-1] | ||||||
| 3 | [ergs s-1 cmm-1] | ||||||
| Integrated Line Fluxa | [ergs s-1 cm-2] | ||||||
| a For the calculation of upper limits, we assumed that the FWHM of the line is 6.6 km s-1. | |||||||
2 Observations
We obtained high-resolution ()222The spectral resolving power of our CRIRES observations was determined by the FWHM of the Gaussian fit of an unresolved skyline. A at 2.12 m corresponds to a resolution of 6.6 km s-1. This FWHM is sampled on 5 pixels of the CRIRES detector. near-infrared spectra of LKH 264 and 49 Cet, on 2006 November 8-9, using the ESO-VLT cryogenic high-resolution infrared echelle spectrograph CRIRES (Käufl et al. 2004), mounted on ESO UT1 ”Antu” 8-m telescope atop Cerro Paranal Chile, during the CRIRES science-verification phase. CRIRES uses a mosaic of four Aladdin III InSb arrays providing an effective 4096 x 512 detector array in the focal plane. Adaptive Optics (MACAO - Multi-Applications Curvature Adaptive Optics) was used to optimize the signal-to-noise ratio and the spatial resolution. The science targets were used as natural guide stars.
Our observations were performed using a 31” long, 0.4” wide, north-south oriented slit. The observations were made by nodding the telescope 10” along the slit. To correct for bad pixels and decrease systematics due to the detector, a random jitter smaller than 2” was added to the telescope in addition to the nodding offset at each nodding position. For the telluric correction spectrophotometric standard stars at similar airmass to the science target were observed immediately following the science observations.
The observations were performed employing the wave-ID 27/1/n and the wave-ID 25/-1/n, providing a spectral coverage from 2.0871 to 2.1339 m and from 2.2002 to 2.2552 m respectively. To obtain the wavelength calibration, observations of an internal Th-Ar calibration lamp with 3x30 second exposures were executed immediately following the target and standard star spectroscopy observations at each wave-ID setting. A summary of the observations is provided in Table 2.
2.1 Data Reduction
The data was reduced using the CRIRES pipeline and the ESO/CPL recipes. In each chip, raw image frames at each nodding position were flat-field corrected, then image pairs in the nodding sequence (AB) were subtracted and averaged resulting in a combined frame (), thereby correcting for the sky-background. The frames at each nodding position were corrected for jittering using the jitter information from the fits headers. The ensemble of combined frames were stacked in one single 2D frame. The spectrum was extracted by summing the number of counts inside the PSF in the dispersion direction in the 2D spectrum. The absolute wavelength calibration was obtained by cross-correlation with the Th-Ar lamp frame taken immediately after the science exposure. The wavelength calibration was done for each chip independently. The one-dimensional spectrum was divided by the exposure time (see Table 2).
To correct for telluric absorption, the one-dimensional extracted science spectrum was divided by the one-dimensional extracted spectrum of the standard star. The standard star spectrum was corrected for differences in air-mass and air-pressure with respect to the science target spectrum employing the method described by Carmona et al. (2005). Small offsets of a fraction of a pixel in the wavelength direction were applied to the standard star spectrum until the best signal-to-noise in the corrected science spectra was obtained.
Absolute flux calibration was found by multiplying the telluric corrected spectrum by the flux of the standard star at the wavelengths observed. The flux of the standard star in the K band was found from the magnitude of the standard star using Vega as the reference star333The flux of Vega in the K band used is 4.14 W m-2 m-1 (Cox, 2000).. The absolute flux calibration is accurate at the 20% level. Imperfections in the telluric correction are the principal source of uncertainty.
3 Results
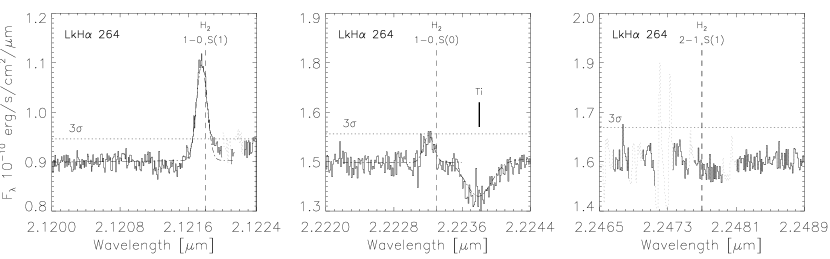
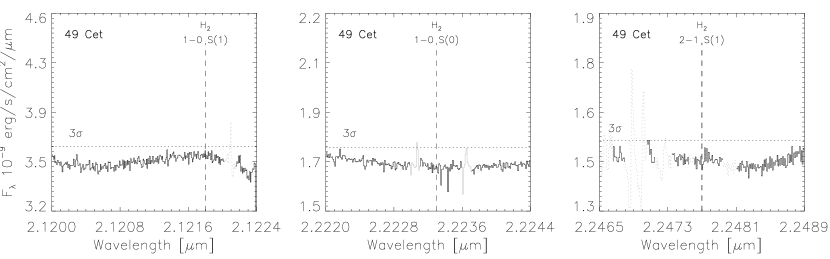
We present in Figure 1 the spectra of LkH 264 and 49 Cet. LkH 264 exhibits H S(1) emission at 2.1218 m and the H S(0) feature at 2.2233 m. Our observations confirm the previous detections of the H S(1) line reported by Itoh et al. (2003). The line flux measured from our CRIRES spectrum is 50% fainter than the line reported by Itoh et al. (2003) (see Section 3.2). In contrast to Itoh et al. (2003) the H S(0) line is detected in our CRIRES spectra of LkH 264. The H S(1) line is not seen in LkH 264. The Si line at 2.1210 m reported by Itoh et al. (2003) is not confirmed by our CRIRES spectrum. We observe Ti absorption lines at 2.2217 and 2.2238 m of FWHM of 48.9 km s-1 and EW 0.2 Å. These lines are gravity sensitive, and would suggest that the underlying photosphere is of a late K dwarf (see, e.g., Greene & Lada 2002) in agreement with the spectral type K5Ve of LkH 264 . The broadening of the lines indicates a of 40 km s-1 in LkH 264. In the case of 49 Cet none of the three H2 features are present in emission or absorption. The spectrum does not exhibit photospheric absorption features. We summarize our results in Table 3. We should note that the 49 Cet observations were less deep than the LkH 264, however, the distance of the target (61 pc) compensate for this.
3.1 Upper Flux Limits on H2 Emission in 49 Cet
3 upper limits for the integrated line flux of the observed H2 lines in 49 Cet were determined by calculating the standard deviation of the continuum flux in the vicinity of the H2 features and multiplying 3 times the standard deviation (see horizontal dotted lines in Figure 1) times the FWHM of a CRIRES unresolved line (4.95 m). They are reported in Table 3. The continuum is spatially unresolved. The mean PSF FWHM measured in the continuum is 3.7 and 6.0 pixels for the spectrum at 2.12 and 2.22 m respectively. Using the CRIRES pixel scale of 0.086 arcsec/pixel, we obtain a PSF FWHM of 0.3” and 0.5” for each spectrum. At the distance of 49 Cet (61 pc), that corresponds to 20 and 31 AU respectively. We conclude that the size of the NIR continuum-emitting region of 49 Cet has an upper limit of 20 AU.
3.2 Molecular Hydrogen Emission in LkH 264
The central wavelength of the S(1) H2 emission in LkH 264 was measured to be 2.121757 0.000005 m by a Gaussian fit. Assuming an error on the wavelength calibration of 1.0 km s-1 (1 pixel), it corresponds to a velocity shift of -6.0 1.0 km s-1. At the time of the observations the velocity correction444We employed the rvcorrect function of IRAF to calculate the velocity shift. due to the motion of the Earth was +0.4 km s-1. The velocity shift is therefore -5.6 1.0 km s-1, in agreement with the center of the line of -5.1 1.2 km s-1 by Itoh et al. (2003) and the rest velocity of the star of -5.9 1.2 km s-1 by Itoh et al. (2003) and -4.2 2.5 km s-1 by Hearty et al. (2000). Our observations confirm that the H2 emission observed is coincident with the rest velocity of the star. The detected H2 S(1) emission line is symmetric. The observed FWHM of the line555Convolved with the instrumental width of 6.6 km s-1. is 20.6 1 km s-1. The Equivalent Width (EW) of the line is -0.32 0.01 Å, and the integrated line flux is 3.0 erg s-1 cm-2. The observed line is 10 km s-1 narrower and slightly fainter than the line observed by Itoh et al. (2003). The line flux observed is within the range of 1 to 7 erg s-1 cm-2 line fluxes reported towards other classical T Tauri stars (Weintraub et al. 2000, Bary et al. 2003).
The H2 S(0) feature at 2.2233 m is detected with a 3 level confidence (see Figure 1). Employing a Gaussian fit, the central wavelength of the line found is 2.22321 0.00005 m. This corresponds to a velocity shift of -12 7 km s-1 which is in agreement with the velocity shift found in the S(1) line. The error in the determination of the center of the S(0) line is larger because the line is detected with a much smaller confidence level. The FWHM of the line is 19.8 1 km s-1. The EW of the line is -0.07 0.01 Å, and the integrated line flux is 1.0 erg s-1 cm-2. This line flux is smaller than the previous flux upper limits by Itoh et al. (2003) demonstrating the improvement in sensitivity reached by CRIRES.
The H2 S(1) emission is spatially unresolved. The mean PSF FWHM in the continuum measured is 4.2 pixels. Using the CRIRES pixel scale of 0.086 arcsec/pixel and a distance of 300 AU for LkH 264, we obtain a PSF FWHM of 0.36” indicating that the S(1) line is produced in the inner 50 AU of the LkH 264 disk. The H2 S(0) emission is also spatially unresolved. The mean PSF FWHM in the continuum measured is 0.58” (6.8 pixels) corresponding to an upper limit of 90 AU for the H2 S(0) emitting region. The very similar FWHM of the H S(0) and the H S(1) ( 20 km s-1) suggests that the gas responsible for the H2 emission is located in similar regions of LkH 264. Since both H2 lines are spatially unresolved, and both lines presumably come from the same region, we conclude that the H2 emitting region should be in the inner 50 AU of the LkH 264 disk. In Section 4.2, from the line ratio of the detected lines (i.e. temperature of the H2 emitting the lines) and the shape of the line profile, we set more stringent limits to the location of the emission.
Employing a similar approach as described for 49 Cet, we derived an upper limit for the flux of 5.3 erg s-1 cm-2 for the H2 S(1) feature at 2.2477 m in LkH 264. Assuming an error of 20% in the flux calibration of the spectra, the 1-0 S(0)/1-0 S(1) line ratio is 0.33 0.1 and the 2-1 S(1)/1-0 S(1) line ratio is 0.2. These line ratios are consistent with the line ratios of a gas at LTE at a temperature cooler than 1500 K (Mouri 1994).
3.3 Mass of Hot H2 in LkH 264 and 49 Cet
Assuming optically thin emission and a source size equal or smaller to the beam size of the telescope, the mass of hot H2 gas in was determined from the S(1) line flux employing (Bary et al. 2003, Thi et al. 2001)
| (1) |
with being the S(1) line flux or the flux upper limit, the distance in pc to the source, the energy difference in ergs between the levels and of the transition (9.3338 ergs), the Einstein coefficient ( s-1) and the level populations at temperature of the H2 gas at the upper level , J of the transition (Bary et al. 2003). Under LTE conditions at 1500 K, . In LkHα 264 the mass of hot gas is (1.5 MMoon). Since the flux observed by our CRIRES observations is 50% lower to that reported by Itoh et al. (2003) the derived mass is 50% lower. Using the same set of equations, the upper limit to the mass of H2 at 1500 K obtained for 49 Cet is (0.1 MMoon). Note that if a lower temperature is assumed, the level populations are smaller and the deduced mass of H2 is larger.
Comparing the disk masses deduced from observations of dust continuum at mm wavelengths (see Table 1) with the gas mass probed by the S(1) H2 line (see Table 3), we can observe that the amount of gas that is probed by the S(1) H2 line is very small with respect to the total amount of gas inferred to be in the disk. Bary et al. (2003) suggest that a conversion factor of could be used for deducing the total mass of the gas from the masses obtained from the S(1) H2 line. Applying such a conversion factor for LkH 264 we obtain a total disk mass of 0.5 to 50 M⊙ and for 49 Cet a total disk mass of 0.04 to 0.4 M⊙. In the case of 49 Cet the deduced upper limits to the disk mass are in agreement with the mass deduced from mm dust continuum observations. In the case of LkH 264 the total mass deduced is much too high to be consistent with the mass obtained from observations at mm wavelengths. In addition, the estimate is unrealistic since a disk this massive would have fragmented under the influence of its own gravity.
4 Discussion
4.1 The excitation mechanism of the H2 line in LkH 264
H2 emission can be the result of thermal (collisions) and non-thermal (radiative decay from excited electronic states) excitation mechanisms. In the thermal case, the gas is heated either by shocks, X-rays or UV-photons. In this case, the H2 spectrum is characterized by a single excitation temperature typically between 1000 and 2000 K. In the non-thermal case, the electronic excitation results from the absorption of a UV photon in the Lyman-Werner band (912-1108 Å) or the collisions with a fast electron due to X-ray ionization (Mouri 1994).
The first step in our analysis is to determine whether the H2 emission observed in LkH 264 originates in an outflow (shock excited emission) or in a disk. The small velocity shift, the line shape (well reproduced by a disk model, see §4.2), and the fact that the emission is spatially unresolved are not in favor of shock excited H2. An additional strong argument against shock excitation of H2 is that LkHa 264 does not exhibit [OI] forbidden emission at 6300 Å (Cohen and Kuhi 1979); a classical signature of outflows in T Tauri stars. The lack of this line indicates that in LkH 264 the outflow is not present or at least that it is very weak. We conclude that the H2 emission observed in LkH 264 originates very likely in a disk.
The thermal and non-thermal excitation mechanisms are distinguishable on the basis of line ratios (Mouri 1994 and references there in). With Figure 3b of Mouri (1994), we find that the measured 1-0 S(0)/1-0 S(1) (0.33 0.1) and the 2-1 S(1)/1-0 S(1) (0.2) line ratios in LkH 264 are consistent with thermal emission of a gas cooler than 1500 K. If the distribution of errors is assumed Gaussian, then a 3 error of 0.1 in the 1-0 S(0)/1-0 S(1) ratio implies that there is a 90% probability that 1-0 S(0)/1-0 S(1) 0.28. Therefore, the most likely scenario is that the H2 emitting gas is at a temperature cooler than 1000 K and that the H2 is thermally excited by UV photons666Itoh et al. (2003) employing upper limits to the 1-0 S(0) emission suggested that the 1-0 S(0)/1-0 S(1) is smaller than 0.26 for LkH 264. We detect the 1-0 S(0) line and find that most likely this line ratio is higher than 0.28.. LkH 264 is also an X-ray source (Hearty et al. 2000). Nevertheless, given the line 1-0 S(0)/1-0 S(1) ratio measured, the probability that the heating mechanism is X-ray excitation is less than 1% (1-0 S(0)/1-0 S(1) 0.23). The conclusion that the H2 observed emission is very likely due to UV-photons is supported by the fact that LkH 264 has a strong UV excess (, Bastian & Mundt 1979).
4.2 H2 Emitting Region and Inclination of the Disk around LkH 264
The spectral resolution of CRIRES ( 6.6 km s-1) and the thermal width of a 1500 K line ( 2.4 km s-1) are significantly smaller than the FWHM of 20 km s-1 of the H2 lines observed in LkH 264. Therefore, the line width must be linked to the dynamics of the gas in the region that is emitting the line. If the molecular hydrogen emission in LkH 264 originates in a disk, the shape of the line allows us to constrain the region where the emission is produced if the inclination is known, or to constrain the inclination of the disk if the region where the emission is produced is given.
Implementing the two-layer Chiang and Goldreich (1997) disk model code CG plus (Dullemond et al. 2001), we modeled the disk around LkH 264. As inputs for the model we used, a disk without a puffed-up inner rim with an inner truncation radius at 3000 K, a disk size of 250 AU, a mass777 Note that the disk mass employed here is deduced from mm dust continuum emission, therefore, it is an estimate of the mass of the cold outer disk. Since most of the 85 MJ are located beyond a few tens of AU from the star and the total disk mass depends on the (unknown) value of the dust mass absorption coefficient and the gas-to-dust mass ratio, our parameterization of the disk would be a lower limit to the possible disk mass. Nevertheless, the uncertainty in the total disk mass has a small influence in the line fitting, because the contribution of the inner disk to the total mass is minor and the H2 emission is produced in the optically thin upper layer of the disk. of 85 MJ, a density power law factor of -1.5 and a luminosity of 0.53 log() for LkH 264. The luminosity was determined from the spectral type K5V ( K), using a distance of 300 pc, a magnitude of 12 mag, an extinction AV = 0.5 mag (Itoh et al. 2003) and a bolometric correction of -0.72 (Kenyon and Hartmann, 1995). We found that the regions of the disk with a surface layer at K are located at 0.1 AU.
Prescribing a mass of 0.8 M⊙ for LkH 264 (found by its location in the HR diagram employing the evolutionary tracks of Palla and Stahler 1993), an H2 emitting region from 0.1 to 10 AU, and assuming that the intensity of the H2 line is described by a power law according to the radius ( being a negative number) we calculated the expected line profile produced by the inclined disk. We proceed as follows. Suppose there is a parcel of gas situated at a radius of width d and angular size d that emits a line intensity with a profile , in a disk inclined at an angle surrounding a star of mass at a distance from the Earth. The doppler shift of a line at frequency emitted by the parcel of fluid is given by
| (2) |
with being the speed of light. Assuming that the line profile is Gaussian, the doppler shifted line profile emitted by the parcel of fluid is
| (3) |
where . The FWHM (in km s-1) in strict terms is the thermal broadening of the line, however, for the purpose of calculating of the observed profile by the instrument, we assumed the FWHM to be the resolution of the spectrograph (in our case 6.6 km s-1). The flux emitted by the parcel of fluid is therefore
| (4) |
and the total emitted line flux is the sum of the contributions of all the fluid parcels
| (5) |
Here, and are the inner and outer radius of the region responsible for the emission. For our calculation we assumed that AU, AU, and pc. The results are weakly dependent on the selection of a larger since the intensity decreases rapidly as a function of radius. is selected as 0.1 because it is at this radius at which the temperature starts to be cooler than 1500 K in the disk surface of LkH 264. The resulting synthetic line profile was scaled in such a way that the peak flux of the synthetic line is equal to the peak flux of the line (minus continuum) observed. The exponent of the intensity as a function of radius was assumed to be equal to -3, -2 and -1 for each set of models.
With the inclination being the only free parameter, we manually changed its value for each value of until we found a good fit for the line. If the inclination selected was too large, a double peaked profile was obtained, if it was too small, the velocity wings and the width of the line obtained were too narrow. Thus, only a small interval of inclinations fit the line profile for each value of . We found that for reproducing the observed line profile, the inclination of the disk should be close to face-on, from 8o to 35o for power law exponents ranging from -3 to -1 respectively. In Figure 2 we present the best fit found: an inclination of 20o and . The close to face-on inclination derived from our CRIRES data is consistent with the polarization measurements of Bastien (1982), who found that the polarization degree of LkH 264 in the optical is fairly low (), which is consistent with a small inclination (p is zero for i=0). If the H2 S(1) line intensity decreases with an exponent as a function of radius, then 50% of the line flux is produced within 0.1 AU and 1 AU of the LkH 264 disk, 40% of the line flux is emitted within 1 and 7 AU and the remainder of the flux (10%) is emitted at larger radii.

| EW H | AV | log | ||||||||
| Star | Sp.T. | [ M⊙ yr-1] | [Å] | [mag] | [mag] | [mag] | [mag] | [erg s-1] | [MJ] | Ref. H2 |
| Detections | ||||||||||
| LkH 264 | K5 Ve | 1 - 10 af | 85 h | 0.52 | 0.37 | 0.08 | -2.10 | 29.7 | 85q | 1,2 |
| TW Hya | K7 Ve | 0.005 ag | 86 h | 0.18a | 0.86 | 0.8a | -1.8a | 30.3 | 1.4r | 3 |
| GG Tau Aa | K7 Ve | 0.175 | 54 h | 3.20a | 2.73 | 1.0a | -1.6a | 29.4 | 290p | 3,6 |
| GG Tau Ab | M0.5 Ve | 0.175 | 54 h | 0.72a | 1.42 | 1.0a | -1.5a | 29.4 | 290p | 3,6 |
| LkCa 15 | K5 Ve | 0.015 ah | 13 h | 0.64 h | 1.98a | 1.6a | -0.5a | 29.6e | 10s | 3,6 |
| AA Taub | K7-M0 Ve | 0.033 | 37 b | 0.93 | 0.9c | 0.4 | -2.2d | 29.6e | 21p | 6 |
| CW Taub | K3 Ve | 0.016 ai | 135 b | 2.34 | 1.46c | 0.15 | -1.65 | 30.5l | 15p | 6 |
| UY Aurb | K7 Ve | 0.656 | 73 b | 1.05 | 0.92f | 0.33 | -2.18 | 29.4e | 0.9t | 6 |
| GM Aurb | K7-M0 Ve | 0.096 | 97 b | 0.14 | 1.5g | 1.4 | -1.2d | 29.7e | 60p | 6 |
| CS Cha | K5 Ve | 1.6 aj | 13 h | 0.06i | 1.72i | 1.68 | 0.49 | 30.2v | 21w | 7 |
| ECHA J0843.3-7905 | M3.2 Vex | 0.010 ak | 111 z | 0.1ac | ad | … | … | 28.5aa | ae | 8 |
| Non-Detections | ||||||||||
| CD -33o7795 | M1.5Ve | al | 15 m | 0.07n | 2.39n | 2.35 | -0.33 | 30.6 | 0.1u | 5 |
| IP Tau | M0 Ve | 0.008 | 11 h | …y | 2.04y | 2.04y | 0.63 | 29.5 | 5t | 3 |
| IQ Taub | M0.5 Ve | 0.18 aj | 8 b | 0.77 | 0.93 | 0.49 | -2.17 | 29.5 | 40p | 3 |
| V836 Tauha | K7 V | 0.001 | 9 h | 0.71i | 2.71i | 2.31 | -0.21 | 29.8 | 40t | 3 |
| RECX 5 | M4.0 Vex | 0.0005 ak | 9 z | 0.1ac | ad | … | … | 29.0ab | ae | 8 |
| RECX 9 | M4.5 Vex | 0.0004 ak | 12 z | 0.1ac | ad | … | … | 28.4ab | ae | 8 |
| References : (1) Carmona et al. 2007 (this work); (2) Itoh et al. (2003); (3) Bary et al. (2003); (4) Bary et al. (2002); | ||||||||||
| (5) Weintraub et al. (2000); (6) Shukla et al. (2003); (7) Weintraub et al. (2005). (8) Ramsay Howat & Greaves (2007) | ||||||||||
| Notes: refers to the total mass in the disk deduced from mm dust continuum emission assuming a gas to dust ratio of 100. | ||||||||||
| a Average value from Table 5 of Bary et al. (2003); b Spectral Type, H EW and AV from Cohen & Kuhi (1979); | ||||||||||
| c Varsavsky (1960); d Average between the excess of the two spectral types; e Neuhäuser et al. (1995); f Mendoza (1966); | ||||||||||
| g Bastian & Mundt (1979); h H EW by Herbig & Bell (1988); ha Given the H EW we classified the source as CTTS ; | ||||||||||
| i Herbig & Bell (1988); j Quadruple system (Soderblom et al. 1998); k Mermilliod (1986); l XEST data by Güdel et al. (2007); | ||||||||||
| m Craig et al. (1997); n Gregorio-Hetem et al.(1992); p Beckwith et al. (1990); q Itoh et al. (2003b); | ||||||||||
| r Weinberger et al. (2002); s Qi et al. (2003); t Osterloh & Beckwith (1995); | ||||||||||
| u Jayawardhana et al. (1999), Weinberger et al. (2004) and Uchida et al. (2004) do not find evidence for infrared excess in the | ||||||||||
| source. Here we adopt the lower limit on the disk’s masses of Osterloh & Beckwith (1995) as upper limit for the disk’s mass. | ||||||||||
| v Costa et al. (2000); w Lommen et al. (2007); y ROTOR data (Grankin et al. 2007) gives an E of -0.74 which is more | ||||||||||
| than a magnitude off from that of Herbig & Bell (1988). Maybe there is some long-term evolution of this system that changes its | ||||||||||
| colors on a long time scale. We worked with the ROTOR color but did not correct for redenning when calculating the excess; | ||||||||||
| x Luhman & Steeghs (2004); z Jayawardhana et al. (2006); aa Lawson et al. (2002); ab Mamajek et al. (1999); ac Lyo et al. (2004); | ||||||||||
| ad No photometry published; ae No 1.3 mm continuum flux published. af Accretion rate from Gameiro et al. (2002); | ||||||||||
| ag Muzerolle et al. (2000); ah Akeson et al. (2005); ai Valenti et al. (1993); aj Johns-Krull et al. (2000); ak Lawson et al. (2004); | ||||||||||
| al Mohanty et al. 2003 detected H in emission of 10% width 270 km s-1. Since no broad OI (8446 Å) or Ca II (8446) emission was | ||||||||||
| reported by those authors, should be lower than 10 yr-1 (Jayawardhana et al. 2003); Gullbring et al. (1998). | ||||||||||

4.3 H2 NIR Ro-vibrational Emission in LkH 264 and Other T Tauri Disks
The mass determination of H2 gas in the inner disk is crucial for constraining the properties of the gas in the terrestrial planet forming region. However, the detections of ro-vibrational H2 emission from disks are relatively scarce compared to the large number of pre-main-sequence stars with gas-rich disks that are known. So far the 1-0 S(1) line has been detected in few classical T Tauri stars (CTTS): TW Hya, GG Tau A, LkCa 15 (Weintraub et al. 2000, Bary et al. 2002, 2003), AA Tau, CW Tau, UY Aur, GM Tau (Shukla et al. 2003), CS Cha (Weintraub et al. 2005), ECHAJ0843.3-7905 (Ramsay Howat & Greaves 2007) and LkH 264 (Itoh et al. 2003, this paper), and in four weak-line T Tauri stars (WTTS): DoAr 21 (Bary et al. 2003), V773 Tau (Shukla et al. 2003), Sz33 and Sz 41 (Weintraub et al. 2005). Our CRIRES observations show, for the first time, the simultaneous detection of the S(1) and S(0) H2 emission from a protoplanetary disk. Since the detections are not very numerous, it would be useful to know if the T Tauri stars with detected H2 near-infrared ro-vibrational emission are peculiar objects.
In the case of H2 emission detected in WTTS, DoAr 21 and V773 Tau are among the brightest X-ray WTTS (see Table 1 and 4 of Bary et al. 2003 and for V773 Tau the XEST data of Güdel et al. 2007)888log of V773 Tau is 31.0 erg s-1. The star is a quadruple system (Duchême et al. 2003). The K-type binary is expected to widely dominate in X-rays (Audard, private communication)..
In the case of CTTS, such a correlation is not apparent. In Table 4, we summarize some important physical properties of the CTTS in which a search was done for H2 S(1) emission999At the time of writing, non-detections have been only reported in Weintraub et al. (2000) and Bary et al. (2003). In the cases of the observations by Shukla et al. (2003) and Weintraub et al. (2005) only the names of the stars in which H2 was detected are published.. We list properties related to the accretion process such as the accretion rate, H emission EW and the excess. In addition, we present the X-ray luminosity and the disk’s mass deduced from mm dust continuum emission reported in the literature. For the calculation of the excess, we first determined the dereddened color employing the visual extinction assuming an interstellar medium extinction law (). Thereafter we subtracted from the dereddened color the color intrinsic to the spectral type of the source by Johnson (1966). In the case of multiple spectral types for a source, we selected their average value.
With the intention of unveiling empirical correlations between the physical properties of the sources and the detectability of the H2 S(1) line, employing the data collected in Table 4, we created a series of plots relating the physical properties of the sources (see Figure 3).
Two possible mechanisms of excitation have been proposed as responsible for the H2 emission in disks: X-ray and UV excitation. We observe in Figure 3 (panels b and c) that in the case of the CTTS there is no clear correlation between the X-ray luminosity and the detectability of the H2 line. We have sources with faint X-ray luminosity and H2 detections (e.g. CW Tau) and sources with relatively high X-ray luminosity but without H2 detections (e.g. CD -33o7795)101010 Note that in the case of CD -33o7795, it could be argued that there is no detection because there is no disk: this source does not show infrared excess (Jayawardhana et al. 1999; Weinberger et al. 2004; Uchida et al. 2004). However the source does exhibit H in emission Craig et al. (1997) and excess.. In addition, in several sources with X-ray luminosities smaller than that of V836 Tau (a non-detection) the H2 line has been detected. We conclude that X-ray excitation could play a role in the heating of the gas, but that in the case of CTTS studied so far, it seems to not be the dominant factor in the excitation of NIR H2 emission.
The second source for the excitation of H2 emission is UV photons. UV photons are produced in large quantities during the accretion process. The excess and the H emission are considered standard signatures of accretion in T Tauri stars. In Figure 3a we show the Hα EW vs the excess. We observe that the higher the excess and the stronger the H line are, the higher the number of sources with H2 detections. The non-detections are situated in the area of small Hα EW and low excess. This result suggests that the higher the accretion rate in the systems is, the higher the probability of exhibiting the S(1) H2 line. For example the only object exhibiting H2 2.12 m emission in the Chamaeleontis cluster is ECHA J0843.3-7905, a source with strong H emission and a comparatively high accretion rate (10 yr-1, Lawson et al. 2004). We should note that there are detections of the H2 line in two objects (CS Cha and LkCa 15) that are located in the region of the H vs excess diagram where three non-detections are situated. In the case of CS Cha, the cause of the emission is probably the high X-ray luminosity. In the case of LkCa 15 no X-rays have been detected. But, LkCa 15 is an edge-on disk source. The lack of X-ray luminosity and of a large U-V excess for this star may be related to the disk geometry. It is also interesting to realize that there is a non-detection in a source (IQ Tau) that has a strong excess. However, IQ Tau exhibits a very small H EW.
Our CRIRES target, LkH 264, is one of the sources with the strongest excess in the sample. With respect to other physical characteristics (Hα EW, disk mass and X-ray luminosity), LkH 264 is a ”normal” source. Therefore, it is likely that in LkH 264 UV photons are mainly responsible for the H2 emission. This conclusion is supported independently by the measured 1-0 S(0)/1-0 S(1) and 2-1 S(1)/1-0 S(1) line ratios as previously discussed.
Concerning the disk mass and the detectability of the H2, there is no apparent correlation between them. H2 detections and non-detections are present in the disk mass range from 1 to 40 MJ. In summary, LkH 264 and the CTTSs in which H2 emission has been detected share typical physical properties of classical T Tauri stars. Therefore, in the near future, we expect to see more detections of the H2 near-infrared lines to come out of high-resolution spectrographs on a routine basis.
4.4 49 Cet Disk
49 Cet is a young isolated star with age between 10 Myr and 100 Myr. Its position on the colour-magnitude diagram with field stars and a few well-studied clusters indicates that it is roughly intermediate in age between IC 2391 and the Pleiades. It is 40 pc below the Galactic plane, within the Local Bubble, and its velocity is inconsistent with being near Sco-Cen (or its cloud complexes) or Taurus in the recent past. While its velocity would be very discrepant for a very young system (20-30 Myr), its UVW is in the ballpark of some known 30-80 Myr systems (e.g., IC 2391, NGC 2451A). However, it’s velocity is not near that of the Gould Belt ( 30 Myr groups within 0.5 kpc; Mamajek, private communication).
Optical spectroscopy of 49 Cet basically shows the typical spectrum of an A-type main sequence star. 49 Cet does not exhibit H in emission and does not present UV excess in its Spectral Energy Distribution (SED). 49 Cet, therefore, is very likely not accreting. In the JHK bands the colors of 49 Cet do not differ significantly with respect to the JHK colors of an A1V star. However, in the mid- and far-infrared (i.e., 25, 60 and 100 m) 49 Cet exhibits emission in excess of photospheric levels, thereby revealing the existence of a circumstellar disk. Recent analysis of sub-arcsec mid-infrared imaging of 49 Cet by Wahhaj et al. (2007) suggests that the bulk of the mid-infrared emission comes from very small grains ( 0.1 m) confined between 30 and 60 AU from the star, and that most of the non-photospheric flux is radiated by an outer disk of large grains ( 15 m) of inner radius AU and outer radius 900 AU. In their analysis Wahhaj et al. (2007) conclude that the most likely scenario is that the inner 20 AU is strongly depleted of dust.
Zuckerman and Song (2004) proposed an age of 20 Myr for 49 Cet, an age in which the gaseous disk is expected to have already dissipated. However, Zuckerman et al. (1995) and Dent et al. (2005) observed CO and emission towards 49 Cet, thereby revealing the existence of a reservoir of cold gas. Dent et al. (2005) modeled the double peaked CO emission and proposed that the line is emitted from a compact disk of outer radius 17 AU inclined at 16o or a disk of outer radius 50 AU but inclined at 35o. Thi et al. (2001) based on ISO measurements claimed the detection of the pure rotational 0-0 S(0) H2 emission at 28 m in 49 Cet, but recent more sensitive Spitzer IRS observations by Chen et al. (2006) did not confirm the detection of the line.
The detection of CO emission in the sub-mm and the apparent existence of a dust gap in the interior of the 49 Cet disk pose the question whether gas still exists within the inner disk (R 20 AU). The upper limit on the flux of the H2 ro-vibrational lines in 49 Cet derived from our CRIRES data set stringent constraints on the amount of hot gas in the inner disk of 49 Cet (R 1 AU): 49 Cet has less than a tenth of lunar mass of gas at T1500 K. Our observations give additional support to the hypothesis that the disk of 49 Cet has an inner hole. The lack of Hα in emission and the non-detection of pure rotational and ro-vibrational emission of warm and hot H2 in 49 Cet indicate that 49 Cet may have an inner hole in gas as well111111The lack of H2 emission means, either the dissipation of H2 or lack of excitation mechanism. We favor the dissipation of H2 because the H2 NIR lines are sensitive to very small amounts of gas. Only a few moon masses of optically thin hot ( K) H2 will provide detectable line fluxes. In addition, this interpretation is consistent with the lack of Hα in emission and the non-detection of pure rotational emission of warm H2 in 49 Cet.. This result supports the idea that gas and dust are dissipated on the same time scale in the inner disk (Sicilia-Aguilar et al. 2006), and is strongly suggestive that the disk disappears inside-out.
One interesting question to address is the possible mechanism of disk dissipation. It has been suggested (e.g., Alexander et al. 2006) that inside-out photoevaporation occurs very rapidly in a time scale of a few 105 years once the phenomenon is triggered after a disc life time of few million years. A challenge to this scenario is the presence of CO in the outer disk. Once the photoevaporation starts in the inner part of the disk, the entire gaseous disk should dissipate in a very short time frame as well (Alexander et al. 2006). Therefore, one puzzling aspect in this scenario is the reason why the outer gas remains in the system. An alternative scenario is to assume the presence of a sub-stellar companion to explain the lack of gas in the inner disk. This explanation has the advantage that the presence of a gas rich outer disk is a natural part of the planet formation process. Giant planets are thought to form in the inner 20 AU of the disk and the outer disk disappears later once the planets have been formed. We note that indications for the presence of a planet in a disk, as required for this scenario, have recently been found in a precursor of a 49-Cet type star, the Herbig Ae/Be star HD 100456 (Acke & van den Ancker 2006). The existence of low mass companion(s) as an explanation for the lack of gas and dust in the inner disk of 49 Cet is a suggestive idea that, given the relative closeness of the target ( 61 pc), it will be possible to test. For example, Apai et al. (2007) made a sensitive adaptive optics search for close companions to a sample of 8 nearby cold debris disks ( 20 - 70 pc) and found no evidence for companions of masses higher than 3 - 7 MJ and higher at separations larger than 15 AU. Future high-contrast imaging facilities such as SPHERE at ESO-VLT, will allow to search for lower mass companions at closer separations.
5 Conclusions
We observed the classical T Tauri star LkH 264 and the debris disk 49 Cet and searched for ro-vibrational S(1) H2 emission at 2.1218 m, S(0) H2 emission at 2.2233 m, and S(1) H2 emission at 2.2477 m, using CRIRES ( km s-1) at ESO-VLT. We confirmed the detection of the S(1) H2 line in LkH 264 at the rest velocity of the star. The line has a flux of 3.0 ergs cm-2 s-1, and a FWHM of 20.6 km s-1. In addition, the enhanced sensitivity of CRIRES allowed the observation of the previously undetected S(0) H2 line in LkH 264. The line has a flux of 1.0 ergs cm-2 s-1, and a FWHM 19.8 km s-1. An upper limit of 5.3 ergs s-1 cm-2 was derived for the S(1) H2 line flux in LkH 264. The very similar FWHM of the two H2 lines detected suggests that the emitting gas is located in similar regions in the disk. Both lines are spatially unresolved. The measured mean PSF’s FWHM ( 0.36”) in the H2 1-0 S(1) spectrum indicates that the H2 emitting region is located in the inner 50 AU of the disk assuming a distance of 300 pc for LkH 264. The measured 1-0 S(0)/1-0 S(1) (0.33 0.1) and the 2-1 S(1)/1-0 S(1) (0.2) line ratios in LkH 264 indicate that the H2 emitting gas is at a temperature lower than 1500 K and that the H2 is most likely thermally excited by UV photons. The measured line ratios suggest that X-ray excitation plays only a minor role in the heating of the emitting H2 in LkH 264. The flux of the S(1) H2 line in LkH 264 implies that there are a few lunar masses of hot H2 gas in the inner disk of LkH 264. The S(1) H2 line in LkH 264 is single peaked. Modeling of the S(1) line shape indicates that the disk is close to face-on (). The best model fit suggests that the disk of LkH 264 is inclined 20 for a H2 emitting region extending from 0.1 to 10 AU with a power law relation of the intensity as a function of radius with exponent . If the H2 S(1) line intensity decreases with an exponent as a function of radius, then 50% of the line flux is produced within 0.1 AU and 1 AU of the LkH 264 disk, 40% of the line flux is emitted within 1 and 7 AU and the rest of the flux at larger radii.
A comparative analysis of the physical properties of classical T Tauri stars in which the H2 S(1) line has been detected versus non-detected shows that there is a higher chance of observing the H2 near-infrared lines in CTTS with a high excess and a strong H line. This result suggests that there is a higher probability of detecting the H2 S(1) line in systems with high accretion. In contrast to weak-lined T Tauri stars, there is no apparent correlation between the X-ray luminosity and the detectability of the H2 S(1) line in classical T Tauri stars. Taken as a group, LkH 264 and the CTTS in which the H2 emission has been detected exhibit typical properties of classical T Tauri stars. Therefore, we expect NIR ro-vibrational H2 lines from T Tauri disks to be detected on a routine basis in the near future.
The non-detection of any of the three H2 lines in 49 Cet puts stringent constraints on the amount of hot gas in the inner disk. From the upper limit for the flux of the S(1) H2 line we deduced that less than a tenth of lunar-mass of gas at K is present in the inner 1 AU of the disk surrounding 49 Cet. The lack of H2 ro-vibrational emission in the spectra of 49 Cet, combined with non detection of pure rotational lines of H2 (Chen et al. 2006) and the absence of H emission suggest that the gas in the inner disk of 49 Cet has dissipated. These results together with the previous detection of 12CO emission at sub-mm wavelengths (Zuckerman et al. 1995; Dent et al. 2005) point out that the disk of 49 Cet should have a large inner hole, and it is strongly suggestive of theoretical scenarios in which the disk disappears inside-out. We favor inner disk dissipation by inside-out photoevaporation, or the presence of an unseen low-mass companion(s) as most likely explanations for the lack of warm gas in the inner disk of 49 Cet.
Acknowledgements.
This research has made use of the SIMBAD database operated at CDS, Strasbourg, France. A.C. would like to thank R. Mund for helpful discussions concerning outflows in T Tauri stars, M. Audard for kindly providing XEST X-ray luminosities of several sources, G. van der Plas for calculations of the rotational broadening of absorption lines, and C. Fallscheer for comments to the manuscript. Special thanks to the CRIRES science-verification team for executing the observations in Paranal and for their support in the data-reduction process.References
- Acke & van den Ancker (2006) Acke, B., & van den Ancker, M. E. 2006, A&A, 449, 267
- Akeson et al. (2005) Akeson, R. L., et al. 2005, ApJ, 635, 1173
- Alexander et al. (2006) Alexander, R. D., Clarke, C. J., & Pringle, J. E. 2006, MNRAS, 369, 229
- Apai et al. (2007) Apai, D., et al. 2007, ArXiv e-prints, 710, arXiv:0710.0206
- Bary et al. (2002) Bary, J. S., Weintraub, D. A., & Kastner, J. H. 2002, ApJ, 576, L73
- Bary et al. (2003) Bary, J. S., Weintraub, D. A., & Kastner, J. H. 2003, ApJ, 586, 1136
- Bastian & Mundt (1979) Bastian, U., & Mundt, R. 1979, A&AS, 36, 57
- Bastian (1982) Bastian, U. 1982, A&A, 109, 245
- Beckwith et al. (1990) Beckwith, S. V. W., Sargent, A. I., Chini, R. S., & Guesten, R. 1990, AJ, 99, 924
- (10) Bockelé-Morvan, et al. 1995, in Circumstellar Dust Disks and Planet Formation, ed. R. Ferlet & A. Vidal-Madjar (Gif sur Yvette: Editions Fronti res)
- Carmona et al. (2005) Carmona, A., van den Ancker, M. E., Thi, W.-F., Goto, M., & Henning, T. 2005, A&A, 436, 977
- Chen et al. (2006) Chen, C. H., et al. 2006, ApJS, 166, 351
- Chiang & Goldreich (1997) Chiang, E. I., & Goldreich, P. 1997, ApJ, 490, 368
- Cohen & Kuhi (1979) Cohen, M., & Kuhi, L. V. 1979, ApJS, 41, 743
- Costa et al. (2000) Costa, V. M., Lago, M. T. V. T., Norci, L., & Meurs, E. J. A. 2000, A&A, 354, 621
- Cox (2000) Cox, A. N. 2000, Allen’s astrophysical quantities, 4th ed. Publisher: New York: AIP Press; Springer, 2000. Edited by Arthur N. Cox.
- Craig et al. (1997) Craig, N., Christian, D. J., Dupuis, J., & Roberts, B. A. 1997, AJ, 114, 244
- Dent et al. (2005) Dent, W. R. F., Greaves, J. S., & Coulson, I. M. 2005, MNRAS, 359, 663
- Duchêne et al. (2003) Duchêne, G., Ghez, A. M., McCabe, C., & Weinberger, A. J. 2003, ApJ, 592, 288
- Dullemond et al. (2001) Dullemond, C. P., Dominik, C., & Natta, A. 2001, ApJ, 560, 957
- Gameiro et al. (2002) Gameiro, J. F., Folha, D. F. M., & Costa, V. M. 2002, A&A, 388, 504
- Greene & Lada (2002) Greene, T. P., & Lada, C. J. 2002, AJ, 124, 2185
- Gregorio-Hetem et al. (1992) Gregorio-Hetem, J., Lepine, J. R. D., Quast, G. R., Torres, C. A. O., & de La Reza, R. 1992, AJ, 103, 549
- Grankin et al. (2007) Grankin, K. N., Melnikov, S. Y., Bouvier, J., Herbst, W., & Shevchenko, V. S. 2007, A&A, 461, 183
- Güdel et al. (2007) Güdel, M., Padgett, D. L., & Dougados, C. 2007, in Protostars and Planets V., Edited by B. Reipurth, D. Jewitt, and K. Keil. University of Arizona Press, Tucson, 2007
- Gullbring et al. (1998) Gullbring, E., Hartmann, L., Briceno, C., & Calvet, N. 1998, ApJ, 492, 323
- Hearty et al. (2000) Hearty, T., Fernández, M., Alcalá, J. M., Covino, E., & Neuhäuser, R. 2000, A&A, 357, 681
- Herbig & Bell (1988) Herbig, G. H., & Bell, K. R. 1988, Lick Observatory Bulletin, Santa Cruz: Lick Observatory, —c1988,
- Itoh et al. (2003) Itoh, Y., et al. 2003b, ApJ, 586, L141
- Itoh et al. (2003) Itoh, Y., Sugitani, K., Ogura, K., & Tamura, M. 2003, PASJ, 55, L77
- Jayawardhana et al. (1999) Jayawardhana, R., Hartmann, L., Fazio, G., Fisher, R. S., Telesco, C. M., & Piña, R. K. 1999, ApJ, 521, L129
- Jayawardhana et al. (2001) Jayawardhana, R., Wolk, S. J., Barrado y Navascués, D., Telesco, C. M., & Hearty, T. J. 2001, ApJ, 550, L197
- Jayawardhana et al. (2003) Jayawardhana, R., Mohanty, S., & Basri, G. 2003, ApJ, 592, 282
- Jayawardhana et al. (2006) Jayawardhana, R., Coffey, J., Scholz, A., Brandeker, A., & van Kerkwijk, M. H. 2006, ApJ, 648, 1206
- Johnson (1966) Johnson, H. L. 1966, ARA&A, 4, 193
- Johns-Krull et al. (2000) Johns-Krull, C. M., Valenti, J. A., & Linsky, J. L. 2000, ApJ, 539, 815
- Kaufl et al. (2004) Käufl, H.U. et al. 2004, SPIE, 5492, 1218
- Kenyon & Hartmann (1995) Kenyon, S. J., & Hartmann, L. 1995, ApJS, 101, 117
- Lawson et al. (2002) Lawson, W. A., Crause, L. A., Mamajek, E. E., & Feigelson, E. D. 2002, MNRAS, 329, L29
- Lawson et al. (2004) Lawson, W. A., Lyo, A.-R., & Muzerolle, J. 2004, MNRAS, 351, L39
- Lommen et al. (2007) Lommen, D., et al. 2007, A&A, 462, 211
- Luhman & Steeghs (2004) Luhman, K. L., & Steeghs, D. 2004, ApJ, 609, 917
- Lyo et al. (2004) Lyo, A.-R., Lawson, W. A., Feigelson, E. D., & Crause, L. A. 2004, MNRAS, 347, 246
- Mamajek et al. (1999) Mamajek, E. E., Lawson, W. A., & Feigelson, E. D. 1999, ApJ, 516, L77
- Mendoza V. (1966) Mendoza V., E. E. 1966, ApJ, 143, 1010
- Mermilliod (1986) Mermilliod, J. C. 1986, Bulletin d’Information du Centre de Donnees Stellaires, 31, 185
- Mohanty et al. (2003) Mohanty, S., Jayawardhana, R., & Barrado y Navascués, D. 2003, ApJ, 593, L109
- Mouri (1994) Mouri, H. 1994, ApJ, 427, 777
- Muzerolle et al. (2000) Muzerolle, J., Calvet, N., Briceño, C., Hartmann, L., & Hillenbrand, L. 2000, ApJ, 535, L47
- Neuhaeuser et al. (1995) Neuhaeuser, R., Sterzik, M. F., Schmitt, J. H. M. M., Wichmann, R., & Krautter, J. 1995, A&A, 297, 391
- Osterloh & Beckwith (1995) Osterloh, M., & Beckwith, S. V. W. 1995, ApJ, 439, 288
- Palla & Stahler (1993) Palla, F., & Stahler, S. W. 1993, ApJ, 418, 414
- Qi et al. (2003) Qi, C., Kessler, J. E., Koerner, D. W., Sargent, A. I., & Blake, G. A. 2003, ApJ, 597, 986
- Howat & Greaves (2007) Howat, S. K. R., & Greaves, J. S. 2007, MNRAS, 379, 1658
- Sicilia-Aguilar et al. (2006) Sicilia-Aguilar, A., Hartmann, L. W., Fürész, G., Henning, T., Dullemond, C., & Brandner, W. 2006, AJ, 132, 2135
- Shukla et al. (2003) Shukla, S. J., Bary, J. S., Weintraub, D. A., & Kastner, J. H. 2003, Bulletin of the American Astronomical Society, 35, 1209
- Soderblom et al. (1998) Soderblom, D. R., et al. 1998, ApJ, 498, 385
- Straižys et al. (2002) Straižys, V., Černis, K., Kazlauskas, A., & Laugalys, V. 2002, Baltic Astronomy, 11, 231
- Thi et al. (2001) Thi, W. F., et al. 2001, ApJ, 561, 1074
- Uchida et al. (2004) Uchida, K. I., et al. 2004, ApJS, 154, 439
- Valenti et al. (1993) Valenti, J. A., Basri, G., & Johns, C. M. 1993, AJ, 106, 2024
- Varsavsky (1960) Varsavsky, C. M. 1960, ApJ, 132, 354
- Wahhaj et al. (2007) Wahhaj, Z., Koerner, D. W., & Sargent, A. I. 2007, ApJ, 661, 368
- Weinberger et al. (2002) Weinberger, A. J., et al. 2002, ApJ, 566, 409
- Weinberger et al. (2004) Weinberger, A. J., Becklin, E. E., Zuckerman, B., & Song, I. 2004, AJ, 127, 2246
- Weintraub et al. (2000) Weintraub, D. A., Kastner, J. H., & Bary, J. S. 2000, ApJ, 541, 767
- Weintraub et al. (2005) Weintraub, D. A., Bary, J. S., Kastner, J. H., Shukla, S. J., & Chynoweth, K. 2005, Bulletin of the American Astronomical Society, 37, 1165
- Zuckerman (1995) Zuckerman, B., Forveille, T., & Kastner, J.H. 1995, Nature, 373, 494
- Zuckerman & Song (2004) Zuckerman, B., & Song, I. 2004, ApJ, 603, 738