Structural efficiency of percolation landscapes in
flow networks
Abstract
Complex networks characterized by global transport processes rely on the presence of directed paths from input to output nodes and edges, which organize in characteristic linked components. The analysis of such network-spanning structures in the framework of percolation theory, and in particular the key role of edge interfaces bridging the communication between core and periphery, allow us to shed light on the structural properties of real and theoretical flow networks, and to define criteria and quantities to characterize their efficiency at the interplay between structure and functionality. In particular, it is possible to assess that an optimal flow network should look like a ”hairy ball”, so to minimize bottleneck effects and the sensitivity to failures. Moreover, the thorough analysis of two real networks, the Internet customer-provider set of relationships at the autonomous system level and the nervous system of the worm Caenorhabditis elegans –that have been shaped by very different dynamics and in very different time-scales–, reveals that whereas biological evolution has selected a structure close to the optimal layout, market competition does not necessarily tend toward the most customer efficient architecture.
I Introduction
Despite profound differences, natural and artificial networked systems share striking similarities. Complex networks science Albert and Barabási (2002); Dorogovtsev and Mendes (2003); Newman (2003) has successfully rationalized several of the most ubiquitous features, such as the small world property or the presence of strong degree heterogeneity, relating them to the existence of general organizing principles. These self-organization laws also shape the observed large-scale connectivity layout of a special, yet common, class of networks describing transport processes, be it of matter, energy, or information. These networks are characterized by asymmetric interactions giving rise to local flows that collectively organize into a large-scale stream dominated by a processing core which transfers input into output: the universal bow-tie architecture Broder et al. (2000) that is intimately related to the functional activity of these systems.
In general terms, most previous research exploring the relation between form and function in complex networks has been mainly focused on the analysis of topological features such as modular ordering revealing functional aspects Guimerà et al. (2007), with fewer exceptions treating directly functional aspects such as efficiency Latora and Marchiori (2001). Specifically, transport has been studied as one of the main functions influenced by topology S. Sreenivasan and Stanley (2007); Gallos et al. (2007) and functional design principles of global flux distributions have been discussed for biological networks Segrè et al. (2002); Csete and Doyle (2004); Fischer and Sauer (2005). Despite these efforts, the “form follows function” assertion still remains to be fully understood from a complex networks science perspective, a major difficulty in the fact that present network patterns are the result of non-stationary and adaptive evolutionary histories that can greatly vary for different networks. However, general self-organization principles should not only govern structure but also their interplay with functional features.
Our purpose of inferring information about function and evolution from a precise knowledge of the topological makeup requires the understanding of how flow networks organize to develop functionality. In this respect, percolation theory on complex networks Newman et al. (2001) provides a valuable framework to discuss their connectedness and to identify the components that are key to a complete description of their global connectivity layouts conforming the percolation landscapes. This analysis, in turn, allows us to quantify the degree of efficiency that the network has achieved in relation to its operativeness as a global transport system. In particular, the major role played by interfaces, bridging the communication between the different percolation components Serrano and Rios (2007), allowed us to define structural efficiency in terms of two complementary aspects: stress or structural load carried by the interfaces –which also informs about robustness–, and closeness or extent of the direct access to the processing core. We use theoretical arguments to propose the conformation of maximal structural efficiency and demonstrate by the analysis of real networks that biological systems exposed to long-term evolutionary pressure may be much closer to optimality than information technologies systems at an early stage of development dominated by competitive forces.
II The architecture of percolation landscapes
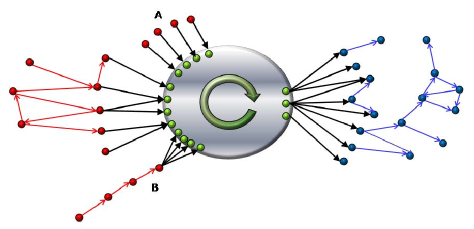
Global communication is essential to develop efficient collective behavior. In flow networks, represented as directed complex networks, global connectivity is ensured by the presence of architectural elements that allow to traverse the network from the input to the output components. These layouts are best rationalized in the framework of percolation theory, so we call them percolation landscapes. Characteristic topologies in the percolated phase denote a global flux that organize in distinct linked components comprising macroscopic portions of the system (Fig. 1 gives a schematic representation). In the percolated phase, the traditional node percolation map Newman (2002); Dorogovtsev et al. (2001); Boguñá and Serrano (2005) recognizes a core structure, the giant strongly connected component (SCC), which vertices can communicate with each other following directed paths. In many real systems this core is a processing unit which transfers input to output, and so it is connected to peripheral components. The input comes from an afferent component, the giant in-component (IN), composed by all vertices that can reach the SCC but cannot be reached from it, and the output goes to an efferent component, the giant out-component (OUT), made of all vertices that are reachable from the SCC but cannot reach it. Secondary structures such as tubes or tendrils could also be present Broder et al. (2000). Changing the perspective from nodes to edges, this picture is complemented by the edge percolation map Serrano and Rios (2007), where the number of relevant structures increases to five: the edges pure components, ICE, OCE, and SCE, that are formed by edges connecting nodes within the IN, OUT, and SCC respectively; and edges forming the interfaces, ITF and OTF, that bridge the peripheral components (IN and OUT, respectively) to the core.
This pattern is obviously further shaped by system dependent specificities that are the reflection of functional demands and evolutionary and/or adaptive forces. In particular, the specific conformation of the interfaces determines the structural efficiency and robustness of the network as a global transport system and the potential risk of bottleneck effects.
| ASR | ASRR | CEN | CENR | ||||
| NP | IN | 20060 | 18900 | 800 | 29 | 25 | 2 |
| SCC | 90 | 880 | 40 | 195 | 219 | 2 | |
| OUT | 17 | 120 | 30 | 55 | 36 | 2 | |
| Main | 20167 | 19900 | 800 | 279 | 279 | 0 | |
| TOTAL | 24545 | 24545 | 279 | 279 | |||
| EP | ICE | 20180 | 6500 | 400 | 9 | 3 | 2 |
| ITF | 10833 | 22000 | 2000 | 175 | 154 | 8 | |
| SCE | 389 | 2300 | 200 | 1322 | 1490 | 20 | |
| OTC | 226 | 1000 | 100 | 330 | 230 | 20 | |
| OCE | 12 | 150 | 50 | 36 | 4 | 3 | |
| Main | 31640 | 32000 | 2000 | 1872 | 1883 | 5 | |
| TOTAL | 45914 | 45914 | 1903 | 1903 | |||
II.1 Percolation landscapes of real networks
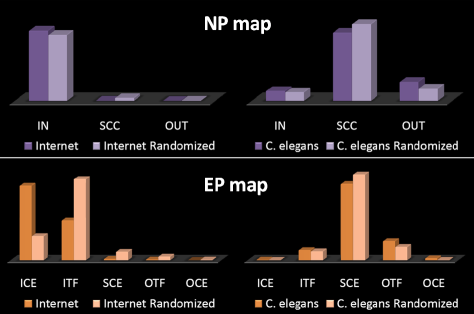
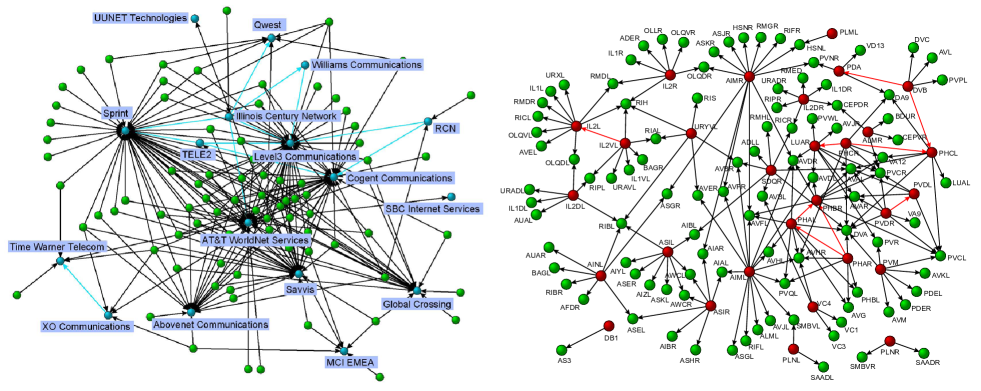
We consider here two different information processing systems characterized by global transport phenomena: one socio-technological, the Internet, in contraposition with one biological, the nervous system of the nematode worm Caenorhabditis elegans (C. elegans). The node and edge percolation maps of their directed network reconstructions are detailed in Fig. 2 and Table 1.
Their maximally random counterparts are also analyzed as null models. In practice, the randomization is achieved at the stationary state of a rewiring process that at each time step randomly selects a couple of links and exchange their ending points Maslov and Sneppen (2002) avoiding the formation of multiple and self-connections and bidirectional links while preserving the degree distribution . The randomized version would preserve as well degree -degree correlations and higher-order effects which correspond to structural constraints ensuring the realizability of the network Boguñá et al. (2004). The comparison of real networks with their randomized counterparts makes therefore possible to determine to which extent the measured values are due to global organizing principles and not to random assemblages affected by finite-size effects. In this work, the randomized counterparts are produced out of randomized realizations.
II.1.1 Internet customer-provider AS relationships (ASR)
The Internet is one of the paradigmatic information technology and communication networks Pastor-Satorras and Vespignani (2004). From an operative point of view, it is composed of thousands of Internet Service Providers, usually identified with autonomous systems (ASs), that operate individual parts of the whole infrastructure and engage in contractual relationships to collectively route traffic through the network. Such business dependencies Dimitropoulos et al. (2007) are mappable to a directed graph representation of unambiguous customer-provider relationships among ASs.
The directed graph is reconstructed from the map 2007-04-02 of inferred AS relationships provided by CAIDA (http://www.caida.org/data/active/as-relationships/). Relationships among ASs are usually realized in the form of business agreements, generally simplified to customer-provider, peer-to-peer and sibling-to-sibling. In a purely directed version of the network, where links represent net flow of payments for services provided, relations between siblings immediately cancel out since they administratively belong to the same organization. Peer-to-peer relations are however not trivial because they just freely exchange traffic between themselves and their customers but not up in the hierarchy. Anyway, we assume here that the later are balanced in both directions so as a first approximation we neglect them as well. On the other hand, customer-provider relationships are unambiguously represented by directed edges from customer to provider. We are left with a purely directed network of nodes and directed links, after removing () peer-to-peer and () sibling-to-sibling relations). The in-degree distribution is very broad and well described by a power law with characteristic exponent . The out-degree distribution is strongly bounded and decays extremely fast with a maximum out degree of .
This network presents an extremely asymmetric structure at the level of the node percolation map, with a huge IN component, a restricted SCC, and an even smaller OUT component (Table 1). By comparison, the randomized counterpart is characterized by a similar IN component, but by ten-fold larger (albeit still small in absolute terms) SCC and OUT components. This information about the node partition should be complemented by the analysis of the edge percolation map to provide a first glimpse of the different architectural organization of the real versus the randomized network. Again the size in number of edges of the core and the efferent structures (see left graph in Fig. 3 for details about the efferent components) are qualitatively in accordance with the values for the randomized network, despite being smaller. However, the organization of the afferent components is very different from random. The ICE of the real network contains as many edges as nodes in the IN component. Moreover, the number of ITF edges connecting the IN and SCC components is just half the number of IN nodes: on average, thus, there are two IN nodes for every ITF edge, which further implies that many nodes in the in-component lack direct access to the core. By converse, the randomization predicts an ITF double in number of edges than actually observed with a correspondingly reduced ICE, so a more shallow IN.
II.1.2 Synaptic neuronal structure of C. elegans (CEN)
A different family of information transport systems that naturally emerge as archetypical networks are biological nervous systems. As for most other complex networks, their structure is intimately related to their function and the emergent behavior cannot be understood from the mere summation of the individual neuronal actions. We focus on the nervous system of the C. elegans worm which is practically completely known Chen et al. (2006).
Network representations of brains display neurons as vertices and connection between pairs are present whenever a synapse or gap junction has been observed. We use the updated data set presented in Chen et al. (2006) (http://www.wormatlas.org/). The pharyngeal system comprises 20 neurons and is almost totally disconnected from the rest of the network. It is excluded along unconnected neurons, as well as connections of the somatic nervous system to non-neural cells. We further restrict to chemical synapses excluding gap junctions, very different from the previous in nature and function. For simplicity, polarity or multiplicity of connections are not taken into account but directionality is. The synapses are directed in nature but reciprocal connections has been detected (). We handled this issue by exploiting the imbalance in the number of observed synapses in each direction, so that we preserve the directionality of the larger number. In this treatment, just of them cancel out (). The final set contains nodes and links. As reported previously, it turns out to be a small-world network Watts and Strogatz (1998) with tails of the cumulative distribution of degrees for both incoming and outgoing neuronal links that have been reported to be well approximated by exponential decays Amaral et al. (2000).
Its percolation layout is surprisingly close to random organization. In contrast to the Internet, the main structure consists of a big core with an OUT twice as large as the IN one (see right graph in Fig. 3 for details about the afferent components), in accordance to the randomized counterpart. The number of edges within the peripheral components is extremely small, so that the C. elegans nervous system seems to rely on clear input and output signals with direct access to the SCC, the computational processing core, through well populated interfaces.
III Interfaces and structural efficiency
Interfaces play the pivotal role of connecting the IN and OUT components to the network core, the SCC component. Setting aside the discussion of wiring costs Achard and Bullmore (2007), the efficiency of interfaces at fulfilling such task may be loosely defined using complementary measures able to capture both the amount of load that the interface edges must bear, the ”stress”, and the extent of the direct access that peripheral component nodes have to the SCC through the interface, the ”closeness”.
III.1 Stress as random-walk betweenness
As elements transported in the system travel the network, edges are subject to loads that can be characterized as betweenness, a topological measure of the number of paths between nodes in different components that traverse those edges. Betweenness is thus a measure of the extent to which such edges have control or are under stress because of the flow passing through them. Typically, betweenness is calculated taking into account only shortest-paths between pairs of nodes Freeman (1977). Here, we are however interested in more realistic situations and assume that the topological structure is supporting blind flow without global knowledge of the system. A more appropriate measure is therefore the random-walk betweenness Newman (2005), that counts all possible routes assuming that information wanders at random until it finds the target. Edges with higher random-walk betweenness are expected to be more important for the spread of information across the system and, if the load is excessive, bottleneck effects could even appear.
In order to calculate the random-walk betweenness of the edges at the interfaces, we slightly modify the original proposal as a centrality measure for vertices Newman (2005). The percolation landscape is explored by means of two symmetric random walks on the unweighted directed network with homogeneous diffusion probabilities and absorbing sinks in the nodes of the SCC. Nodes in the IN act as sources of diffusive particles -either units of energy, packets of information, economic goods, monetary units…- which spread from neighbor to neighbor following outgoing links, each chosen with equal probability among the possibilities. The hopping process is stopped whenever the diffusive particle arrives to a node in the SCC following a given link in the ITF, which receives the annotation. The symmetric process originates particles in the nodes of the OUT, which travel backwards following incoming links selected with equal probability among the possibilities, and the diffusion is equally stopped whenever a node in the SCC is reached through a particular link in the OTF, which receives the annotation. By repeating the processes a sufficient number of times for each source node it is possible to obtain the probability vector that a traveling unit originated at one of the peripheral components uses the edge in the corresponding interface to reach the core. After multiplying by the size of the source component in number of nodes , the resulting vector informs about the structural load that each link in the interface supports. Vector corresponds to a normalized probability distribution whenever tendrils or tubes are not considered. The presence of those appendices produce cul-de-sac which receive part of the diffusion unloading partially the interfaces.
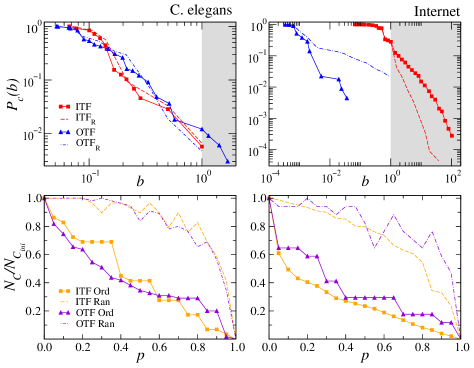
In Fig. 4 (upper panels), we provide the cumulative distribution of the values , the random-walk betweenness for edge in interface (I=ITF or OTF), which correspond to the loads of the edges at the interfaces of the ASR and CEN networks. The cumulated probability density function of the loads shows that they are not uniformly distributed for either network but have heavy tails denoting large fluctuations, with a few links bearing a much higher level of structural stress. This heterogeneity is not per se indicating that the interface is overstressed. The random-walk betweenness is moderately highly correlated with degree Newman (2005) meaning that, in general, vertices with higher degree tend also to have higher random-walk betweenness, so that strong disorder in the topology could induce spurious heterogeneity in the load distribution.
In order to assess whether the structural load could represent a potential danger of bottleneck formation in traffic related processes running on the network, one has to define further what is expected as a low load in the situation of maximal structural efficiency. We make the assumption that such efficiency is reached whenever each edge in the interface carries at most a unitary load. This gives a simple criteria which makes possible to compare different networks but also different links of the same interface. At the same time, the results should be again validated by investigation of the maximally random counterpart. In Fig. 4 (upper panels), grey areas denote stress regions with loads above . Whereas the CEN network entirely conforms once more to the randomized prediction with the practical totality of loads below the threshold, most edges of the in-interface of the ASR network appear to be overstressed, a clear indicator of the vulnerability of the system. The region of loads much below usually corresponds to peripheral leaf nodes connected to multiple core nodes. Apart from a signature of local robustness, this diversification could be interpreted as well as a quality of being a peripheral spreader or collector of flow.
Finally, the average stress-related structural efficiency of an interface can be simply approximated as
| (1) |
that is, the average number of interface edges that mediate between peripheral nodes and the SCC. This average coincides with the inverse of the average betweenness of the edges at the interfaces, . Higher values of are clearly desirable as peripheral nodes would have more routes to the SCC.
III.2 Stress and robustness
The loads of the edges at the interfaces are related to their robustness, defined as a measure of the ability of the interfaces to communicate different components under malfunction or failure. In the bottom panels of Fig. 4, we show the fraction of nodes remaining connected in the peripheral components after the removal of an increasing fraction of edges at the corresponding interface. Two different experiments are performed, the first choosing edges according to load in decreasing order and the second selecting them at random. The results prove that although the interfaces seem to be quite robust against random failures, the failure of high load edges would disconnect a bigger portion of peripheral nodes, thus strongly affecting the behavior of the system. The CEN and AS networks substantially differ in this respect. About 40% of interface edges must be removed in CEN before 50% of the peripheral nodes are disconnected from the SCC in the targeted experiment. By converse, the AS network is more delicate because the same degree of disconnection is reached by removing just 20% of the interface edges.
| Internet | InternetR | C. elegans | C. elegansR | |||
|---|---|---|---|---|---|---|
| INd=1 | 40.71% | 84% | 1% | 100.00% | 100% | 0% |
| INd>1 | 59.29% | 16% | 1% | 00.00% | 0% | 0% |
| INl | 32.34% | 74% | 1% | 75.86% | 90% | 6% |
| INnl | 67.66% | 26% | 1% | 24.14% | 10% | 6% |
| ITFl | 73.23% | 84.8% | 0.2% | 73.71% | 92% | 5% |
| ITFnl | 26.77% | 15.2% | 0.2% | 26.29% | 8% | 5% |
| OUTd=1 | 94.12% | 93% | 4% | 100.00% | 100% | 0% |
| OUTd>1 | 5.88% | 7% | 4% | 0.00% | 0% | 0% |
| OUTl | 70.59% | 18% | 3% | 58.18% | 90% | 6% |
| OUTnl | 29.41% | 80% | 3% | 41.82% | 10% | 6% |
| OTFl | 96.46% | 78% | 9% | 57.27% | 88% | 7% |
| OTFnl | 3.54% | 22% | 9% | 42.73% | 12% | 7% |
III.3 Closeness
The random walk methodology presented above cannot discriminate between peripheral conformations with different access to the SCC if equal loads are associated to interface edges (as a simple example, see tree-like groups and in Fig.1). The concept of closeness allows us to shed light on the different efficiencies that characterize these dissimilar architectures.
By convention, leaf vertices are those with in-degree or out-degree , so that they are restricted to belong to a peripheral component. In-leaf edges (out-leaf edges) are considered as directed links leaving from (pointing to) a leaf vertex111Strictly speaking, vertices with in-degree are usually referred as root vertices. We refer to them as leaf vertices for economy of language. Note also that according to the definitions of in-leaf (out-leaf) edges, the in (out) interface cannot contain out-leaf (in-leaf) edges and that from the perspective of vertices the definitions would be reversed.. Non-leaf edges in the interfaces are the ones that ensure the communication from/to nodes not directly connected to the core. These non-leaf edges are the potentially responsible for bottleneck effects, since they service from more than a single IN or OUT node. A first estimate of how this topological considerations affects efficiency at the structural level is given by the closeness average degree,
| (2) |
which is the number of interface non-leaf edges available for each peripheral node which is not directly connected to the SCC (thus, with a distance from the SCC greater than ).
| ASR | ASRR | CEN | CENR | |||
|---|---|---|---|---|---|---|
| 0.54 | 1.15 | 0.04 | 6.03 | 6.3 | 0.3 | |
| 0.24 | 1.1 | 0.1 | 0 | |||
| 13.29 | 8 | 1 | 6.00 | 6.5 | 0.2 | |
| 8.00 | 30 | 20 | 0 | |||
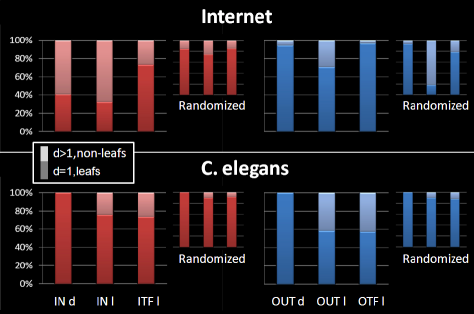
Values for the decomposition of the ASR and CEN interfaces and the peripheral components into leafs and non-leaf units along with average degree efficiency measures as defined in Eq. (1) and Eq. (2) are shown in Table 2, Table 3, and Fig. 5. In general terms, the higher the averages the more structurally efficient the system is expected to be. An important imbalance is observed between the in and out values for ASR. According to the average values, the in-interface presents a certain level of inefficiency, with low average degrees combined with a low number of leafs, much below random expectations. In this situation, potential bottleneck effects are more likely. In contrast, the out component shows high levels of structural efficiency, with the practical totality of nodes being root nodes directly connected to the core. On the other hand, all peripheral CEN nodes have direct access to the core, a signature of high efficiency.
III.4 Maximum structural efficiency and the “hairy” ball
Under the requirements of low stress and high closeness, and in the approximation of inexpensive edges, maximum efficiency would be realized by a percolation landscape structured as a perfect “hairy ball”, with all the nodes in the peripheral components directly attached to the core through leaf edges, each carrying at most a unitary load 222The absence of nodes at distances larger than could involve a marginal deviation from the “hairy ball” conformation with a few loads slightly greater than due to inner connections in the peripheral component., thus without endangering bottleneck effects. Moreover, the interfaces would be robust because the failure or malfunctioning of any of its edges would affect a minimum number of nodes in the peripheral components. Finally, all peripheral nodes would have direct access to the core. Any departure from the “hairy ball” paradigm would lead to situations in which at least one of the two or both requests for structural efficiency, low stress and high closeness, are violated to some degree.
IV Conclusions
Our thorough analysis of percolation landscapes shows that the conformation of interfaces plays a central role in the performance of complex flow networks as global transport systems, governing their efficiency against bottlenecks and their robustness against failures. We highlight that, from the purely structural efficiency perspective, a ”hairy ball” design would be optimal. Appealingly, such behavior may be even displayed by a very close to random architecture as seen for the synaptic neuronal network of C. elegans. Of the two real systems analyzed in this work, this is the one much closer to such optimality whereas the Internet network presents inefficiencies. These findings point to two, not mutually exclusive, interpretations. On the one hand, different adaptation dynamics are surely at work: whereas the present structure of the C. elegans nervous system tries to optimize its collective performance without inter-neuron competition, the Internet network emerges, due to its customer-provider relations, as a competitive network where it is not the global optimization which is sought for but rather the individual Internet service provider gain. In this respect, global efficiency is important only in relation to its marketable value. Interestingly, the Internet customer-provider network outperforms its randomized version in the OTF and OUT components, which describe the ultimate cash flow, and underperforms it in the afferent components, where end-users are. On the other hand, evolution of the worm nervous system might have allowed better architectures to emerge, due to its evolutionary time-scale (hundred of millions of years) running much longer than the time-span of existence of the commercial Internet network (slightly more than ten years).
Clearly, these results only shed light on the basic structural ingredients for efficiency and robustness. Indeed, several other constraints (e.g. costs of edge deployment and maintenance or capacity), are at play which should be taken into account for more precise and system specific analysis. Yet, percolation landscapes represent a first general framework to highlight potential problems in a network structure, possibly suggesting specific actions to reinforce stressed elements or the redistribution of loads so to reduce the risk of bottlenecks and the impacts of failures.
Acknowledgements.
The authors thank Marián Boguñá for useful comments and discussions. This work has been financially supported by DELIS under contract FET Open 001907 and the SER-Bern under contract 02.0234.References
- Albert and Barabási (2002) R. Albert and A.-L. Barabási, Rev. Mod. Phys. 74, 47 (2002).
- Dorogovtsev and Mendes (2003) S. N. Dorogovtsev and J. F. F. Mendes, Evolution of networks: From biological nets to the Internet and WWW (Oxford University Press, Oxford, 2003).
- Newman (2003) M. E. J. Newman, SIAM Review 45, 167 (2003).
- Broder et al. (2000) A. Broder, R. Kumar, F. Maghoul, P. Raghavan, S. Rajagopalan, S. Stata, A. Tomkins, and J. Wiener, Computer Networks 33, 309 (2000).
- Guimerà et al. (2007) R. Guimerà, M. Sales-Pardo, and L. A. N. Amaral, Nature Physics 3, 63 (2007).
- Latora and Marchiori (2001) V. Latora and M. Marchiori, Phys. Rev. Lett. 87, 198701 (2001).
- S. Sreenivasan and Stanley (2007) E. L. Z. T. S. Sreenivasan, R. Cohen and H. E. Stanley, Physical Review E 75, 036105 (2007).
- Gallos et al. (2007) L. K. Gallos, C. Song, S. Havlin, and H. A. Makse, Proc. Natl. Acad. Sci. USA 104, 7746 7751 (2007).
- Fischer and Sauer (2005) E. Fischer and U. Sauer, Nature Genetics 37, 636 (2005).
- Csete and Doyle (2004) M. Csete and J. Doyle, TRENDS in Biotechnology 22, 446 (2004).
- Segrè et al. (2002) D. Segrè, D. Vitkup, and G. M. Church, Proc. Natl. Acad. Sci. USA 99, 15112 (2002).
- Newman et al. (2001) M. E. J. Newman, S. H. Strogatz, and D. J. Watts, Phys. Rev. E 64, 026118 (2001).
- Serrano and Rios (2007) M. A. Serrano and P. D. L. Rios, arXiv:0706.3156v1 [cond-mat.dis-nn] (2007).
- Boguñá and Serrano (2005) M. Boguñá and M. A. Serrano, Phys. Rev. E 72, 016106 (2005).
- Dorogovtsev et al. (2001) S. N. Dorogovtsev, J. F. F. Mendes, and A. N. Samukhin, Phys. Rev. E 64, 066110 (2001).
- Newman (2002) M. E. J. Newman, Phys. Rev. Lett. 89, 208701 (2002).
- Pastor-Satorras and Vespignani (2004) R. Pastor-Satorras and A. Vespignani, Evolution and Structure of the Internet. A Statistical Physics Approach (Cambridge University Press, Cambridge, 2004).
- Dimitropoulos et al. (2007) X. Dimitropoulos, D. Krioukov, M. Fomenkov, B. Huffaker, Y. Hyun, kc claffy, and G. Riley, ACM SIGCOMM Computer Communication Review 37, 29 (2007).
- Chen et al. (2006) B. L. Chen, D. H. Hall, and D. B. Chklovskii, Proc. Natl. Acad. Sci. USA 103, 4723 (2006).
- Achard and Bullmore (2007) S. Achard and E. Bullmore, PLOS Computational Biology 3, 174 (2007).
- Freeman (1977) L. Freeman, Sociometry 40, 35 41 (1977).
- Newman (2005) M. E. J. Newman, Social Networks 27, 39 (2005).
- Watts and Strogatz (1998) D. J. Watts and S. H. Strogatz, Nature 393, 440 (1998).
- Amaral et al. (2000) L. A. N. Amaral, A. Scala, M. Barthélemy, and H. E. Stanley, Proc. Natl. Acad. Sci. USA 97, 11149 (2000).
- Maslov and Sneppen (2002) S. Maslov and K. Sneppen, Science 296, 910 913 (2002).
- Boguñá et al. (2004) M. Boguñá, R. Pastor-Satorras, and A. Vespignani, European Physical Journal B 38, 205 (2004).