Hadron Structure from Inclusive and Exclusive Cross-Sections in ep scattering
Abstract
The contribution of both inclusive and exclusive cross-section data from HERA to our knowledge of parton distribution functions is reviewed and future prospects are outlined.
1 Introduction
The kinematics of lepton hadron scattering is described in terms of the variables , the invariant mass of the exchanged vector boson, Bjorken , the fraction of the momentum of the incoming nucleon taken by the struck quark (in the quark-parton model), and which measures the energy transfer between the lepton and hadron systems. The differential cross-section for the neutral current (NC) process is given in terms of the structure functions by
where . The structure functions and are directly related to quark distributions, and their dependence, or scaling violation, is predicted by pQCD. For low , , is sea quark dominated, but its evolution is controlled by the gluon contribution, such that HERA data provide crucial information on low- sea-quark and gluon distributions. At high , the structure function becomes increasingly important, and gives information on valence quark distributions. The charged current (CC) interactions also enable us to separate the flavour of the valence distributions at high-, since their (LO) cross-sections are given by,
Parton Density Function (PDF) determinations are usually global fits [1, 2, 3], which use fixed target DIS data as well as HERA data. In such analyses, the high statistics HERA NC data have determined the low- sea and gluon distributions, whereas the fixed target data have determined the valence distributions. Now that high- HERA data on NC and CC and inclusive double differential cross-sections are available, PDF fits can be made to HERA data alone, since the HERA high cross-section data can be used to determine the valence distributions. This has the advantage that it eliminates the need for heavy target corrections, which must be applied to the -Fe and fixed target data. Furthermore there is no need to assume isospin symmetry, i.e. that in the proton is the same as in the neutron, since the distribution can be obtained directly from CC data.
The H1 and ZEUS collaborations have both used their data to make PDF fits [4]. In Section 2 we review the published PDF analyses paying particular attention to the treatment of correlated systematic errors. In Section 3 we present the preliminary results of a combination of ZEUS and H1 data. In Section 4 we discuss the improvement in our knowledge of the gluon PDF, which comes from the addition of jet data to the PDF fits, and we present the measurements of which have been made using HERA jet data. In Section 5 we present preliminary fits using HERA-II data and in Section 6 we conclude by looking at the propsects for the future.
2 Comparing ZEUS and H1 published PDF analyses
Full details of the analyses are given in the relevant publications, in this contribution we examine the differences in the two analyses, recapping only salient details. For both HERA analyses the QCD predictions for the structure functions are obtained by solving the DGLAP evolution equations [6] at NLO in the scheme with the renormalisation and factorization scales chosen to be . These equations yield the PDFs at all values of provided they are input as functions of at some input scale . The resulting PDFs are then convoluted with coefficient functions, to give the structure functions which enter into the expressions for the cross-sections. For the ZEUS analysis, the coefficient functions are calculated using the general-mass variable flavour number scheme of Roberts and Thorne [10]. For the H1 analysis, the zero-mass variable flavour number scheme is used.
The HERA data are all in a kinematic region where there is no sensitivity to target mass and higher twist contributions, but a minimum cut must be imposed to remain in the kinematic region where perturbative QCD should be applicable. For ZEUS this is GeV2, and for H1 it is GeV2. Both collaborations have included the sensitivity to this cut as part of their model uncertainties.
In the ZEUS analysis (called the ZEUS-JETS fit), the PDFs for valence, , valence, , total sea, , the gluon, , and the difference between the and contributions to the sea, , are each parametrized by the form
| (1) |
where , at GeV2. The total sea , where for each flavour, and for all other flavours. The flavour structure of the light quark sea allows for the violation of the Gottfried sum rule. However, there is no information on the shape of the distribution in a fit to HERA data alone and so this distribution has its shape fixed consistent with the Drell-Yan data and its normalisation consistent with the size of the Gottfried sum-rule violation. A suppression of the strange sea with respect to the non-strange sea of a factor of 2 at , is also imposed consistent with neutrino induced dimuon data from CCFR. Parameters are further restricted as follows. The normalisation parameters, , for the and valence and for the gluon are constrained to impose the number sum-rules and momentum sum-rule. The parameter which constrains the low- behaviour of the and valence distributions is set equal, since there is no information to constrain any difference. In the present fits to HERA-I data it is also necessary to constrain the high- sea and gluon shapes, because HERA-I data do not have high statistics at large-, in the region where these distributions are small. The sea shape has been restricted by setting for the sea, but the gluon shape is constrained by including data on jet production in the PDF fit, as discussed in Sec. 4. Finally the ZEUS analysis has 11 free PDF parameters. ZEUS have included reasonable variations of these assumptions about the input parametrization in their analysis of model uncertainties. The strong coupling constant was fixed to [11]. Full account has been taken of correlated experimental systematic errors by the Offset Method, as described in ref [3, 12].
For the H1 analysis (called the H1 2000 PDF fit), the value of GeV2, and the choice of quark distributions which are parametrized is different. The quarks are considered as -type and -type with different parametrizations for, , , and , with , as usual, and the the form of the quark and gluon parametrizations given by Eq. 1. For and the polynomial, , for the gluon and , , and for , . The parametrization is then further restricted as follows. Since the valence distributions must vanish as , the low- parameters, and are set equal for and , and for and . Since there is no information on the flavour structure of the sea it is also necessary to set equal for and . The normalisation, , of the gluon is determined from the momentum sum-rule and the parameters for and are determined from the valence number sum-rules. Assuming that the strange and charm quark distributions can be expressed as independent fractions, and , of the and type sea, gives the further constraint . Finally there are 10 free parameters. H1 have also included reasonable variations of these assumptions in their analysis of model uncertainties. The strong coupling constant was fixed to and this is sufficiently similar to the ZEUS choice that we can rule it out as a cause of any significant difference. Full account has been taken of correlated experimental systematic errors by the Hessian Method, see ref. [12].
The different treatments of correlated experimental systematic errors deserves a little more dicussion since modern deep inelastic scattering experiments have very small statistical uncertainties, so that the contribution of systematic uncertainties becomes dominant and consideration of point to point correlations between systematic uncertainties is essential.
For both ZEUS and H1 analyses the formulation of the including correlated systematic uncertainties is constructed as follows. The correlated uncertainties are included in the theoretical prediction, , such that
where, , represents the prediction from NLO QCD in terms of the theoretical parameters , and the parameters represent independent variables for each source of systematic uncertainty. They have zero mean and unit variance by construction. The symbol represents the one standard deviation correlated systematic error on data point due to correlated error source . The is then formulated as
| (2) |
where, , represents a measured data point and the symbol represents the one standard deviation uncorrelated error on data point , from both statistical and systematic sources. The experiments use this in different ways. ZEUS uses the Offset method and H1 uses the Hessian method.
Traditionally, experimentalists have used ‘Offset’ methods to account for correlated systematic errors. The is formulated without any terms due to correlated systematic errors ( in Eq. 2) for evaluation of the central values of the fit parameters. However, the data points are then offset to account for each source of systematic error in turn (i.e. set and then for each source ) and a new fit is performed for each of these variations. The resulting deviations of the theoretical parameters from their central values are added in quadrature. (Positive and negative deviations are added in quadrature separately.) This procedure gives fitted theoretical predictions which are as close as possible to the central values of the published data. It does not use the full statistical power of the fit to improve the estimates of , and thus it is a more conservative method of error estimation than the Hessian method.
The Hessian method is an alternative procedure in which the systematic uncertainty parameters are allowed to vary in the main fit when determining the values of the theoretical parameters. Effectively, the theoretical prediction is not fitted to the central values of the published experimental data, but these data points are allowed to move collectively, according to their correlated systematic uncertainties. The theoretical prediction determines the optimal settings for correlated systematic shifts of experimental data points such that the most consistent fit to all data sets is obtained. Thus, in a global fit, systematic shifts in one experiment are correlated to those in another experiment by the fit. In essence one is allowing the theory to calibrate the detectors. This requires confidence in the theory, but more significantly, it requires confidence in the many model choices (such as the parametrization at ) which go into setting the boundary conditions for the theory .
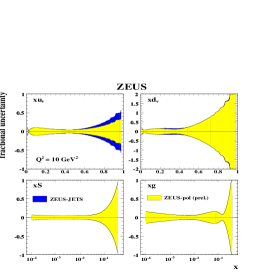
To compare these two methods the ZEUS analysis has been performed using the Hessian method as well as the Offset method and Fig. 1 compares the PDFs, and their uncertainties, using these two methods.
The central values of the different methods are in good agreement but the use of the Hessian method results in smaller uncertainties, for a the standard set of model assumptions. However, model uncertainties are more significant for the Hessian method than for the Offset method. The PDF parameters obtained for different model choices can differ by much more than their experimental uncertainties, because each model choice can result in somewhat different values of the systematic uncertainty parameters, , and thus a different estimate of the shifted positions of the data points. This results in a larger spread of model uncertainty than is found in the Offset method, for which the data points cannot move. Thus when the total uncertainty from both experimental and model sources is computed there is no great difference between these two aproaches.
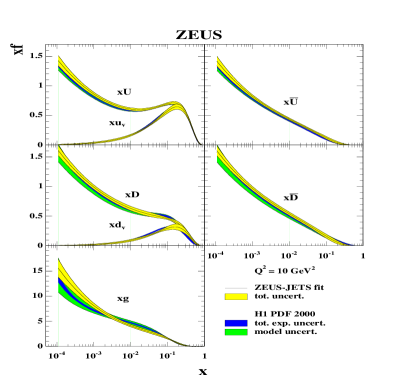
Fig. 2 compares the results of the H1 and ZEUS analyses and illustrates the comparability of the ZEUS (Offset) total uncertainty estimate to the H1 (Hessian) experimental plus model uncertainty estimate. Whereas the extracted PDFs are broadly compatible within errors, there is a noticeable difference in the shape of the gluon PDFs. This can be traced to small but significant differences in the slope of low- data.
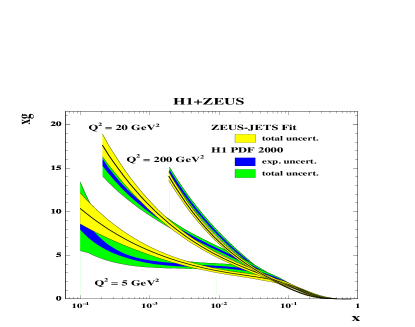
Thus there could be an advantage in combining ZEUS and H1 data into a single data set [13], not just in terms of reducing statistical errors, but also in reducing systematic errors by using each experiment to calibrate the other.
3 Combining ZEUS and H1 HERA-I data
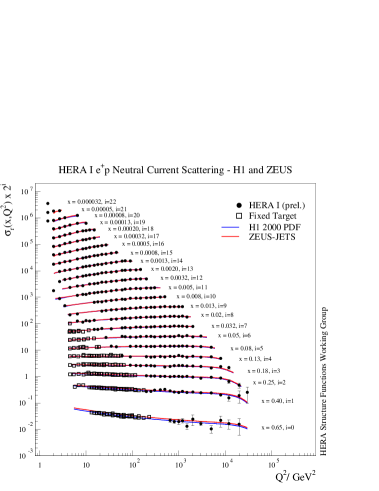
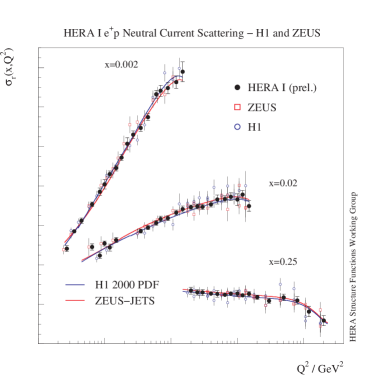
Essentially, since ZEUS and H1 are measuring the same physics in the same kinematic region, one can try to combine them using a ’theory-free’ Hessian fit in which the only assumption is that there is a true value of the cross-section, for each process, at each point. The systematic uncertainty parameters, , of each experiment are fitted to determine the best fit to this assumption. Thus each experiment is calibrated to the other. This works well because the sources of systematic uncertainty in each experiment are rather different. Once the procedure has been performed the resulting systematic uncertainties on each of the combined data points are significantly smaller than the statistical errors. Fig. 3 shows the NC reduced cross-sections from the HERA combination and compares the individual H1 and ZEUS results with those of the combination so that the scale of the improvement can be appreciated..
4 Adding exclusive jet cross-section data to PDF fits, and measurements of
The gluon PDF contributes only indirectly to the inclusive DIS cross sections, through the scaling violations. However it makes a direct contribution to jet cross sections through boson-gluon and quark-gluon scattering, so that measurements of these cross sections can constrain the gluon density. Furthermore, the addition of the jet production data allows an accurate determination of to be made in a simultaneous fit for and the PDF parameters.
In the ZEUS-JETS PDF fit, ZEUS neutral current DIS inclusive jet cross sections and direct photoproduction dijet cross sections have been used to constrain the gluon. The predictions for the jet cross sections were calculated to NLO in QCD using the programme of Frixione and Ridolfi [14] for photoproduced dijets and Disent [15] for jet production in DIS. These calculations are too slow to be used iteratively in the fit. Thus, they were used to compute LO and NLO weights, , which are independent of and the PDFs, and are obtained by integrating the corresponding partonic hard cross sections111For the dijet photoproduction cross sections, the weights also included the convolution with the photon PDFs. in bins of (the proton momentum fraction carried by the incoming parton), (the factorisation scale) and (the renormalisation scale). The predictions for the NLO QCD cross sections are then obtained by folding these weights with the PDFs and according to the formula
| (3) |
where the three sums run over the order in , the flavour of the incoming parton, and the indices () of the , and bins, respectively. This procedure reproduces the NLO predictions to better than .
The cross-section predictions for photoproduced jets are sensitive to the choice of the input photon PDFs. The AFG photon PDF [16] was used in the fits, but in order to minimise sensitivity to this choice, the analysis was restricted to use only the ‘direct’ photoproduction cross sections. These are defined by the cut , where is a measure of the fraction of the photon’s momentum that enters into the hard scatter.
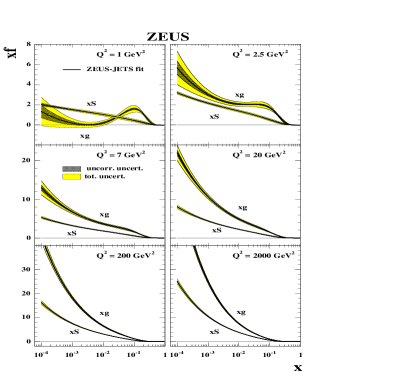
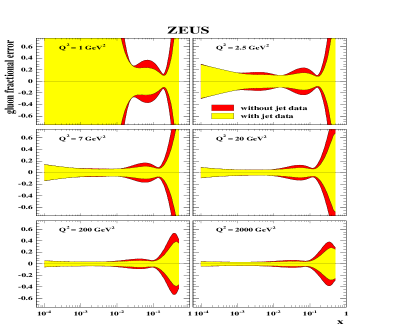
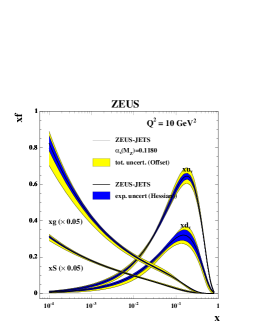
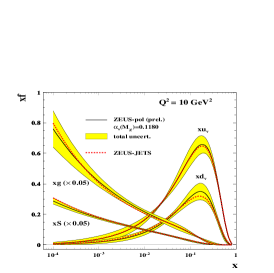
Fig 4 shows that the jet data constrain the gluon mainly in the range , although the momentum sum-rule ensures that the indirect constraint of these data is still significant at higher . The decrease in the uncertainty on the gluon distribution is striking; for example at GeV2 and the uncertainty is reduced from to . A similar decrease in uncertainty by a factor of about two is found in this mid- range, over the full range.
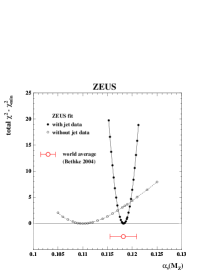
The value of is fixed in most PDF fits but a simultaneous fit for and the PDF parameters can be made. Such fits to inclusive cross-section data do not yield accurate values of because of the strong correlation between and the gluon shape which comes from the DGLAP equations. However including jet data in the fit provides additional constraints. In the ZEUS-JETS fit with free the value
is obtained. Figure 5 illustrates the improved accuracy of the extraction of due to the inclusion of the jet data. The profile around the minimum is shown as a function of for the ZEUS-JETS fit with free, and a similar fit in which the jet data are not included.
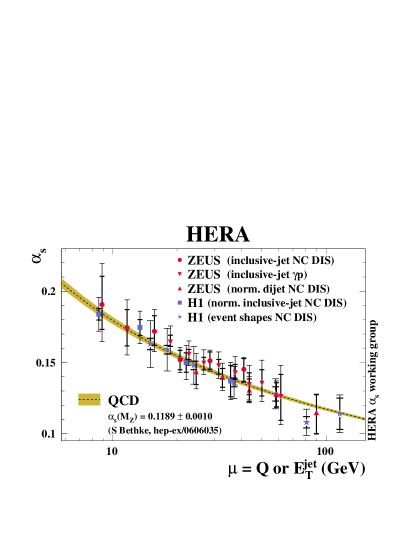
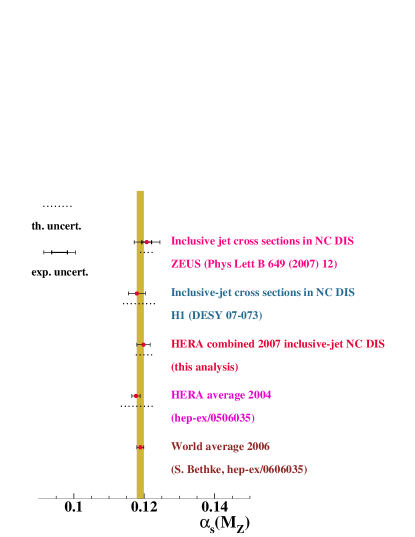
There have also been accurate determinations of using HERA jet data independent of PDF fits and a combined ZEUS and H1 extraction has been made [17]. Fig. 6 compares this combined value to those of the individual experiments and to the world average, and also illustrates the running of with as determined from the HERA experiments.
5 Adding HERA-II data to PDF fits
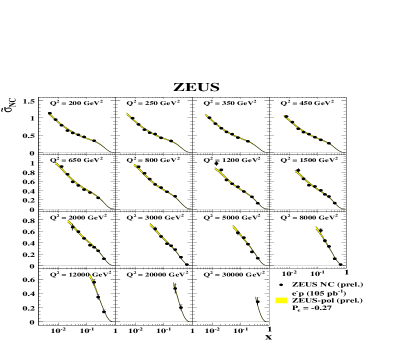
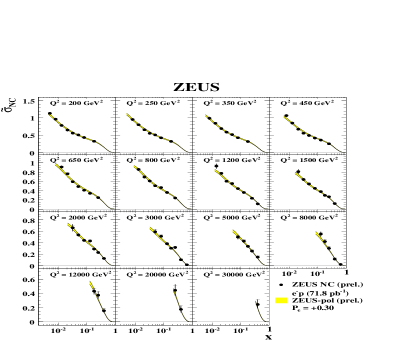
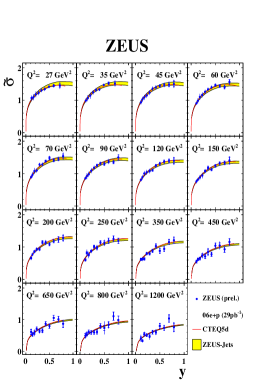
The determinations of the valence PDFs from HERA-I data are not as accurate as those from global fits, but this is rapidly improving with the addition of HERA-II data. Fig 7 shows ZEUS NC data from the 2004-6 running period with polarised beams. There are of negatively polarised, , data and of positively polarised, , data. This data, and CC data from 2004-5, have been input to the ZEUS-JETS fit analysis framework and this new fit is called the ZEUS-pol fit [18]. The polarization of the data has been exploited to measure the neutral current vector and axial vector couplings [18]. The results of this ZEUS-pol fit are superimposed on the data in Fig 7.
The PDFs extracted from the ZEUS-pol fit are compared to those of the ZEUS-JETS fit in Fig 8. The central values of the fit are very compatible with the ZEUS-JETS fit, and the -valence quark uncertainty is reduced significantly at large . The improvement is mostly in the -valence quark at present because the data are quark dominated at large . We can expect improvements in the -valence distribution when the final CC HERA-II data become available.
6 The future
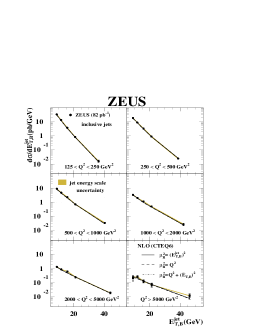
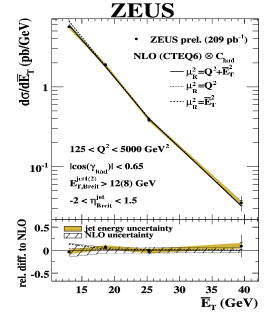
We conclude with a look to the future. HERA data will continue to improve our knowledge of PDFs for the next few years. Firstly, there is more jet data both from HERA-I [19, 20, 21] and from of HERA-II [22, 23] analyses, as shown in Fig 9. Inputting these data should improve determinations of the high- gluon.

It is also interesting to investigate the low- gluon, where the theoretical formalism of the NLO DGLAP equations may need extending to account for resummation [24, 25, 26] or even non-linear terms [27]. Fig. 4 shows the gluon and the sea PDFs predicted by the ZEUS-JETS fit. For GeV2 the gluon PDF is larger than and steeper than the sea PDF, but for lower it flattens and even becomes valence-like. This counter intuitive behaviour may come from the use of the DGLAP equations outside their region of applicability. At low the form of the DGLAP equations is such that one has and . The determination of the gluon distribution is coming from the measurement of the scaling violations, , but these may be determined by either the gluon density or the splitting function. Thus the odd behaviour of the gluon may in fact derive from use of an incorrect splitting function. The use of a calculation of the low- splitting functions which includes resummation results in a steeper gluon PDF [24]. To settle these ambiguities definitively we need a measurement of the gluon density at small which does not derive from the scaling violations of , for example a measurement of or , .
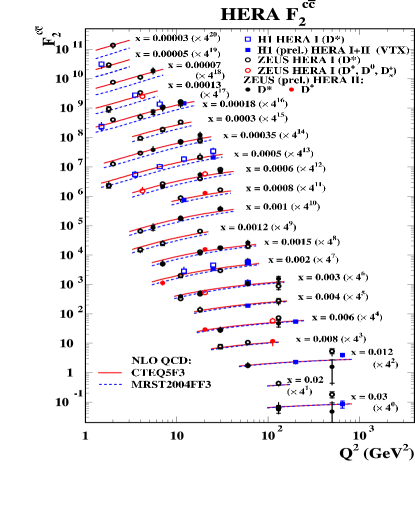
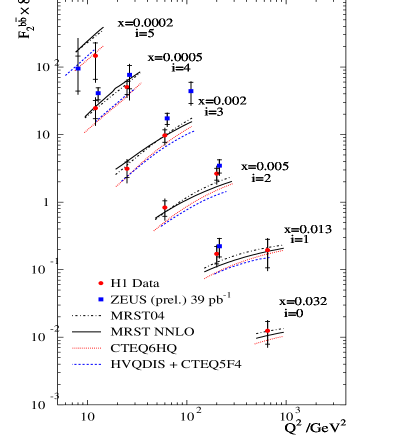
So far the addition of charm data to PDF fits has made little impact [28] but there is new data on from ZEUS, using production from of HERA-I running [29], and using (and ) production from [30] (and [31]) of HERA-II running. There is also H1 data on from [32] of HERA-II data and these have been averaged together with the HERA-I data. Both collaborations have also extracted , H1 using the same data sample as for their charm extraction and ZEUS using of HERA-II data [33]. These data are shown in Fig. 10. In principle heavy quark data should give information on the gluon distribution since heavy quarks are generated by and . However, at the present time there is some theoretical disagreement about heavy quark production schemes [34, 35, 36] such that these data may tell us more about the correct treatment of heavy quarks than about PDFs.
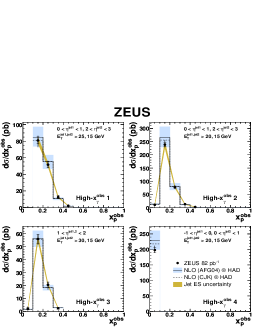
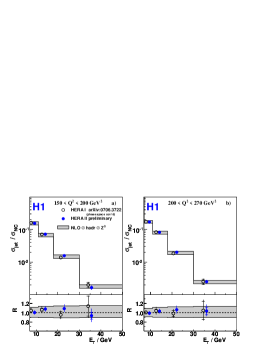
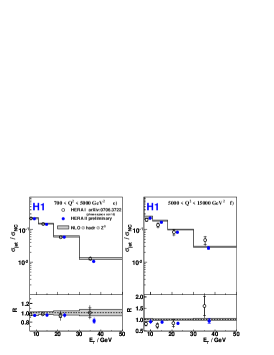
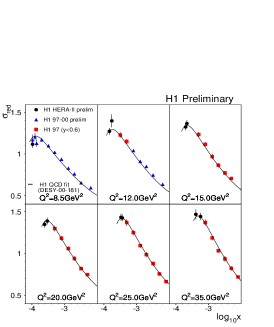
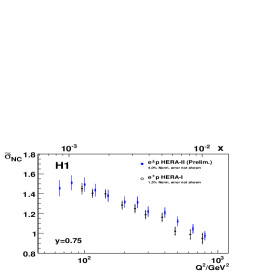
The structure function depends strongly on the gluon [37]. A model independent measurement of requires data at different beam energies so in 2007 HERA was run at proton beam energies GeV and GeV. only makes strong contributions to the cross-section at high , and measurements at high- require technically challenging identification of low energy scattered electrons. Both collaborations have been preparing for this challenge by extending their measurement capabilities to high using the nominal energy HERA-I and HERA-II running. Fig 11 shows data at high- from ZEUS HERA-II 2006 running [38], and from H1 HERA-I running, at low- [39], and HERA-II running, at high- [40]. These data not only pave the way for measurement of , they are also interesting in their own right since they access a new kinematic regime. Thus we look forward to exciting new information on hadron structure from these measurements in the near future.
References
- [1] A.D. Martin et al., Eur. Phys.J C23, 73 (2002)
- [2] J. Pumplin et al., JHEP 0207, 012 (2002)
- [3] ZEUS Coll., S. Chekanov et al., Phys. Rev D 67, 012007 (2003)
- [4] ZEUS Coll., S. Chekanov et al., Eur.Phys.J C 42, 1 (2005)
- [5] H1 Coll., C.Adloff et al., Eur.Phys.J C 30, 32 (2003)
- [6] G. Altarelli, G. Parisi, Nucl.Phys. B126, 298 (1977)
- [7] V.N. Gribov, L.N. Lipatov, Sov.J.Nucl.Phys 15, 438 (1972)
- [8] L.N. Lipatov, Sov.J.Nucl.Phys 20, 94 (1975)
- [9] Yu.L. Dokshitzer, JETP 46, 641 (1977)
- [10] R.S. Thorne and R.G. Roberts, Phys.Rev D57, 6871 (1998)
- [11] S. Eidelman, Phys.Lett B 592, 1 (2004)
- [12] A.M. Cooper-Sarkar, J.Phys G 28, 2669 (2002)
- [13] ZEUS and H1 Collaborations, ZEUS-prel 07, 036 (2007)
- [14] S. Frixione and G. Ridolfi, Nucl.Phys. B507, 315 (1997)
- [15] S. Catani and M.H. Seymour, Nucl.Phys. B510, 503 (1998)
- [16] P. Aurenche et al, Z.Phys. C64, 521 (1994)
- [17] C. Glasman., arxiv:hep-ex 0709, 4426 (2007)
- [18] C. Gwenlan, Dis summary, available on http://chep.knu.ac.kr/lp07/htm/S2/S02-4.pdf. Talk at XXIIIth Int. Conf. on Lepton Photon Physics (LP2007), Daegu, Korea, Aug 2007
- [19] ZEUS Collaboration, DESY 06, 128 (2007)
- [20] ZEUS Collaboration, DESY 07, 092 (2007)
- [21] H1 Collaboration, DESY 07, 073 (2007)
- [22] ZEUS Collaboration, ZEUS-prel 07, 005 (2007)
- [23] H1 Collaboration, H1-prel 07, 131 (2007)
- [24] C. D. White and R. S. Thorne, Phys. Rev. D75, 034005 (2007)
- [25] G. Altarelli, R. D. Ball and S. Forte, Nucl. Phys B742, 1 (2006)
- [26] M. Ciafaloni et al., Phys. Lett B635, 320 (2006)
- [27] E. Iancu, AIP. Conf. Proc. 892, 43 (2007)
- [28] A.M. Cooper-Sarkar, arxiv:hep-ph 0709, 0191 (2007)
- [29] ZEUS Collaboration, DESY 07, 052 (2007)
- [30] ZEUS Collaboration, Abstract 106. Europhysics. Conf. on High Energy Physics (EPS2007), Manchester, UK, July 2007
- [31] ZEUS Collaboration, Abstract 107. Europhysics. Conf. on High Energy Physics (EPS2007), Manchester, UK, July 2007
- [32] H1 Collaboration, H1-prel 07, 171 (2007)
- [33] ZEUS Collaboration, Abstract 108. Europhysics. Conf. on High Energy Physics (EPS2007), Manchester, UK, July 2007
- [34] P. Thompson, J.Phys. G34, 177 (2007)
- [35] Wu Ki Tung et al., arxiv:hep-ph 0707, 0320 (2007)
- [36] R.S. Thorne, Phys.Rev D73, 054019 (2006)
- [37] A.M. Cooper-Sarkar et al, Z.Phys. C39, 281 (1998)
- [38] ZEUS Collaboration, Abstract 78. Europhysics. Conf. on High Energy Physics (EPS2007), Manchester, UK, July 2007
- [39] H1 Collaboration, H1-prel 07, 042 (2007)
- [40] H1 Collaboration, H1-prel 07, 144 (2007).