Comment on “Solving the mystery of booming sand dunes”
Abstract
We show here that the standard physical model used by Vriend et al. to analyse seismograph data, namely a non-dispersive bulk propagation, does not apply to the surface layer of sand dunes. According to several experimental, theoretical and field results, the only possible propagation of sound waves in a dry sand bed under gravity is through an infinite, yet discrete, number of dispersive surface modes. Besides, we present a series of evidences, most of which have already been published in the literature, that the frequency of booming avalanches is not controlled by any resonance as argued in this article. In particular, plotting the data provided by Vriend et al. as a table, it turns out that they do not present any correlation between the booming frequency and their estimate of the resonant frequency.
I Acoustics in sand dunes
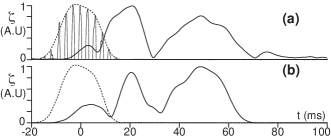
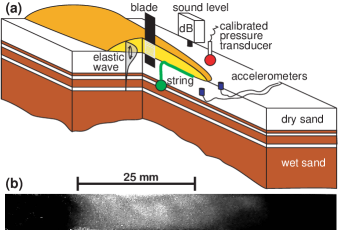
It is a well-known fact that sand dunes present a layered structure due to successive avalanches and capillary water retention. We focus here on the acoustic propagation within the metre scale surface layer composed of dry sand. According to Vriend et al. [2007], in [Andreotti 2004; Bonneau et al. 2007], we “only consider low-speed surface waves of around 50 m/s” while “booming results from the propagation of body waves, not surface waves”. This statement reflects a misunderstanding of acoustic waves in granular media. In fact, we have shown that, contrarily to ordinary elastic solids, bulk modes (the ‘body waves’) do not exist at all [Bonneau et al. 2007]. Instead, there is an infinite yet discrete number of surface modes (not a single one) with a dispersive propagation (i.e. not a single wave speed independent of vibration frequencies). This has been directly evidenced in the field and in a lab experiment (Figure 1), and reproduced by an independent team [Jacob et al. 2007].
The explanation is simple. Sand is a divided medium that presents non-linearities of geometrical origin. As the grains do not have plane/plane contact, they behave like a spring whose stiffness depends on the normal force applied to put them into contact. As a consequence, the speed of sound depends on confining pressure – roughly as , where is the effective number of contacts per grain. A striking consequence is that the order of magnitude of the propagation speed under a pressure of of sand is lower than the sound velocity in air (although density is times larger). Therefore the effective compressibility is extraordinarily small! This property cannot be explained without involving geometrical effects at the scale of a grain. This dependence on pressure has been proven several times experimentally and numerically for moderately large ( m of sand in Jia et al.). Due to gravity-induced pressure (), the surface layer of a dune does not constitute a homogeneous system as increases with depth. Thus, no plane wave Fourier mode can exist in such a medium; only an infinite number of surface modes guided by the sound speed gradient may propagate. Consequently, a mode labelled is localized within a depth below the surface ( is the wavelength) i.e. in a zone where the typical pressure is . Thus, the surface propagation velocity increases with the mode number in a similar way as (between and typically). So, even in the limit of an infinite depth (no finite-depth layering), gravity produces a wave-guide effect, but no resonance.
Considering now a layer of sand of finite depth , a second wave-guide effect get superimposed to the first one and resonant modes may appear. As the system is still not homogeneous due to gravity, these resonant modes are not Fourier modes. By definition, they do not propagate – i.e. they have a vanishing group velocity – so that they correspond to cut-off frequencies of the system: no wave can propagate at a velocity smaller than the first resonant frequency . The influence of the finite depth is in fact limited to a very narrow range of frequencies. As soon as the depth is larger than the wavelength (in practice, for a frequency above ), it can be considered as infinite and the gravity effect prevails [Bonneau et al. 2007].
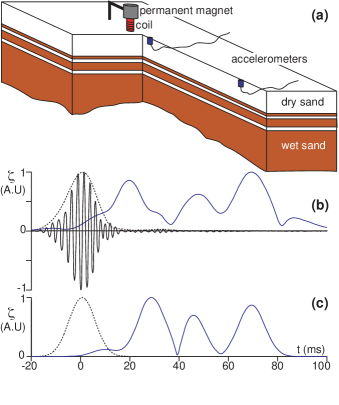
Then, it is easy to realize that if one strikes such a gradient-index medium with a sledge hammer (basically, the procedure used by Vriend et al.), a series of wave packets corresponding to the different surface modes will be propagated that are related to the gravity induced index gradient and not to the effect of the finite depth . Moreover, this procedure only gives access to the group velocity at the mean frequency of excitation – yet not controlled nor specified by Vriend et al. – and not at all at the frequency of spontaneous booming. Consequently, from such a procedure, just by reading the multi-modal structure of a seismograph obtained using only surface transducers, one cannot conclude to the existence of multiple layers nor determine the resonant frequencies. Actually, if Vriend et al. were right, they could easily provide a crucial test by performing measurements with transducers buried in the bulk, as those reported in Andreotti [2004] (see Auxiliary figures). The vibration in the soil during booming avalanches is already strongly reduced at mm below the surface (Auxiliary Figure), which evidences directly that the song of dunes is not related to a resonant mode at the meter scale but to surface propagation.
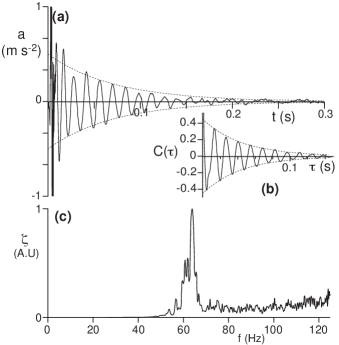
As a conclusion, the quantity determined by Vriend et al. has probably nothing to do with the resonant frequency . Besides, one may wonder why they did not measured directly the resonant frequencies for the seek of comparison with the booming frequency . Using two different methods, we have ourselves performed such measurements using two different methods (Auxiliary Material). For a depth of dry sand of the order of cm, we find typically Hz; for m, the resonance becomes hardly visible and is below Hz. This is much smaller than the values found by Vriend et al. and than the booming frequency ( Hz in Morocco). So, as already evidenced in our previous papers, the phenomenon is not driven by a resonance effect. As shown in Bonneau et al. [2007], the resonant frequency plays another role. As the surface waves do not propagate below , the later controls the threshold for the booming phenomenon. A large enough layer of dry sand is required for the surface waves to propagate and thus for booming to occur. The best situation is thus an infinite layer of dry sand and not a layered one.
II Field evidences against the selection of the frequency by a resonance
Vriend et al. have missed another very important step of the argument presented in Andreotti [2004]. The booming frequency is controlled by the shear rate (i.e. by the rate at which the grains collide with each other) in the shear zone separating the avalanche from the static part of the dune. Of course, depends on the way the avalanche is forced. When a granular flow is driven by a pressure gradient, e.g. by pushing with the hand or the bottom, can be varied and so does the emission frequency . Besides, the reproduction of the phenomenon at small scale [Haff 1986; Douady et al. 2006; Bonneau et al. 2007] is a direct proof that the acoustic emission is not related to the dune itself. Note in particular that controlled lab experiments have allowed to produce sustained booming (not short squeaks), varying continuously from gravity to pressure gradient driving.
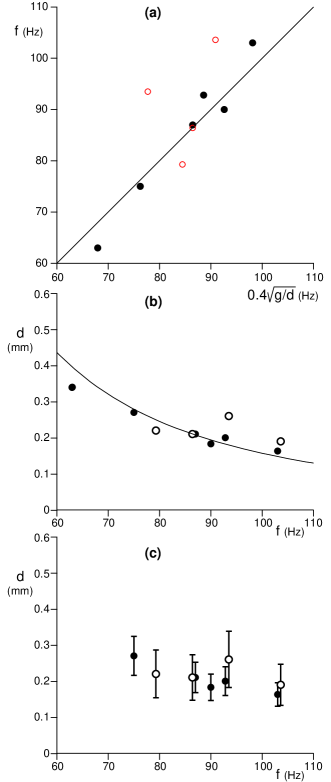
Spontaneous avalanches on the slip face of dunes are driven by gravity in an homogeneous and steady way. In that case, only, and thus are expected to scale as , with subdominant dependencies on the nature of the grains and the presence of cohesion. These conditions can be reproduced by a man-made slide only if the velocity of the body is constant. This is never the case in the movies provided by Vriend et al. to illustrate their measurements. In the auxiliary animation, we show that a pulsed driving leads to a low frequency squeak similar to that measured by Vriend et al. (e.g. point at Hz in their figure 3). It is pretty clear that such an inhomogeneous and unsteady driving do not resemble the spontaneous avalanching process and thus, the avalanche has no reason to yield a constant booming frequency . By contrast, during our field trips in Morocco from 2002 up to now, we have recorded around spontaneous avalanches and man-triggered slides, on barkhan dunes ranging from to m in height. This was done in different places and by different weather conditions. We always measured the same frequency within a tone. In particular, during our field trip of April 2007, we have performed a series of experiments for different flow thicknesses , measured coherently by two independent techniques (see Auxiliary figures). Again, provided that avalanches were homogeneous and steady, the frequency turned out to be constant. This demonstrates that the frequency is not either selected by a resonance effect over the depth of the avalanching flow.
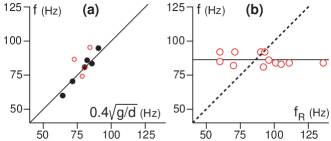
Figure 2 compares our predictions for the frequency of homogeneous booming avalanches () and that proposed by the Caltech team (). Once the data obtained by Vriend et al. in Dumont are plotted (fig. 2b) – and not anymore presented in a Table – no correlation can be observed between and what they claim to be the resonant frequency (see above). By contrast, with a choice of representation different from Vriend et al. (see tables and fig. 4 in Auxiliary Material), the relation between and appears beyond any doubt (fig. 2a and solid line in fig. 2b). This accumulation of evidences shows that the emission frequency is neither controlled by a resonance effect at the scale the avalanche as suggested by Douady et al. [2006] nor at the scale of a superficial layer as suggested by Vriend et al [2007].
The instability mechanism proposed in Andreotti [2004] is based on the interaction between the plastic deformations (shear band) and the elastic compression (acoustics) of the granular material. The collisions between grains induce a transfer of momentum from translation to vibration modes. In turn, the surface waves tend to synchronise the collisions. Importantly, this phase synchronisation linear instability do not depend on the fact that the vibrations modes are propagating or resonant. Although some ‘mysteries’ about singing dunes still remain to be solved, our explanation remains the single one consistent with all the existing observations.
III Auxiliary Material
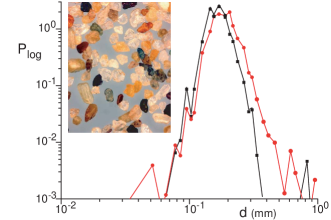
Auxiliary material for this comment gives the details necessary to understand our arguments and reproduce our measurements. There are three points of disagreement with Vriend et al. First, we show with a movie (Animation S1) that a man-made slide produces a booming similar to spontaneous avalanches only if the body is kept rigid and the sliding velocity as constant as possible. This movie is to be compared to those provided by Vriend et al. as Auxiliary Material, where the avalanches are systematically pulsed and inhomogeneous. Second, we show that the representation used by Vriend et al. to compare the frequency and the grain diameter (Fig. 4) does not allow to see the obvious correlation of Fig. 2a. We provide the table of the frequencies used in the figures of the comment (Fig. 2a, 2b and 4). A movie (Animation S1), a schematic of the measurement set-up (Fig. 5), granulometric measurements (Fig. 3) and different frequency spectra (Fig. 6) are provided to document the data points obtained in the Atlantic Sahara. It may serve as a reference to start a data-base of steady homogeneous booming avalanches. Third, we show that the method used by Vriend et al. to measure the first resonant frequency is not correct. We provide the measurement set-up for our controlled acoustic field experiments (Fig. 7a), including two methods to determine directly the resonant frequency (Fig. 8). Using these methods, we obtain a resonant frequency lower and not equal to the booming frequency.
| Place | f (Hz) | d ( m) |
|---|---|---|
| Kelso | ||
| Sidi-Aghfenir | ||
| Copiapo | ||
| El Cerro Bramador | ||
| Sand moutain | ||
| Tarfaya |
| Place | f (Hz) |
|---|---|
| Big dune | |
| Eureka | |
| Kelso | |
| Dumont |
References
- (1) Andreotti, B. (2004), The song of dunes as a wave-particle mode locking, Phys. Rev. Lett., 93, 238001.
- (2) Bonneau, L., B. Andreotti, and E. Clément (2007), Surface elastic waves in granular media under gravity and their relation to booming avalanches, Phys. Rev. E, 75, 016602.
- (3) Deboeuf, S., E. Lajeunesse, O. Dauchot and B. Andreotti (2006) Flow rule,self-channelization and levees in unconfined granular flows, Phys. Rev. Lett., 97, 158303.
- (4) Douady, S. et al. (2006), The song of the dunes as a self-synchronized instrument, Phys. Rev. Lett., 97, 018002.
- (5) Jop, P., Y. Forterre and O. Pouliquen (2005) Crucial role of side walls for granular surface flows, J. Fluid. Mech., 541, 167.
- (6) Jacob, X. et al., cond-mat/0710.2321.
- (7) Haff, P.K. (1986), Booming dunes, Am. Sci., 74, 376 381.
- (8) Jia, X., C. Caroli, and B. Velicky (1999) Ultrasound Propagation in Externally Stressed Granular Media, Phys. Rev. Lett., 82, 1863-1866.
- (9) Malloggi, F., J. Lanuza, B. Andreotti and E. Cl ement (2006) Erosion waves: transverse instabilities and fingering, Europhys. Lett., 75, 825.
- (10) Vriend, N.M. et al. (2007), Solving the mystery of booming sand dunes, Geophys. Res. Lett., 34, L16306, doi:10.1029/2007GL030276.