Initial Observations of Sunspot Oscillations Excited by Solar Flare
Abstract
Observations of a large solar flare of December 13, 2006, using Solar Optical Telescope (SOT) on Hinode spacecraft revealed high-frequency oscillations excited by the flare in the sunspot chromosphere. These oscillations are observed in the region of strong magnetic field of the sunspot umbra, and may provide a new diagnostic tool for probing the structure of sunspots and understanding physical processes in solar flares.
1 Introduction
Solar flares represent a process of conversion of magnetic energy into heat, kinetic energy of plasma eruptions and high-energy particles. Solar flares may excite various types of oscillations and waves in various layers of the Sun, from ”sunquakes” in the interior (Kosovichev & Zharkova 1998) to coronal Morton waves (Moreton 1960) and coronal loop oscillations (Aschwanden et al. 1999). The mechanisms of these oscillations and waves are not fully understood yet, but obviously related to the energy release and transport properties. For instance, the seismic response (”sunquakes”) are believed to be related to the hydrodynamic impact on the lower atmosphere and photosphere by shocks generated in the area heated by high-energy electrons. The spatial-temporal properties of the seismic wave source are closely related to the properties of hard X-ray source (Kosovichev 2006a, b). The sunquakes represent packets of high-frequency acoustic waves traveling through the Sun’s interior. The waves propagate through the active regions and sunspots with strong magnetic field without significant distortion of the wave front and large changes in the travel times. The magnetic field effects in the sunquake waves, which to some extent are obviously present, have not been detected.
Here, we report on observations from Hinode spacecraft of a different type of oscillations excited by a solar flare. These oscillations are observed in the chromosphere of the sunspot umbra and inner penumbra, and, thus, probably represent some kind of magnetohydrodynamic oscillatory modes. Unfortunately, the relatively low cadence of the observations did not allow us to identify the specific mode of the oscillations. Nevertheless, these oscillations carry potentially interesting information about the flare energy release and transport and properties of sunspots, and deserve further observational and theoretical studies.
2 HINODE Observations of December 13, 2006, Flare
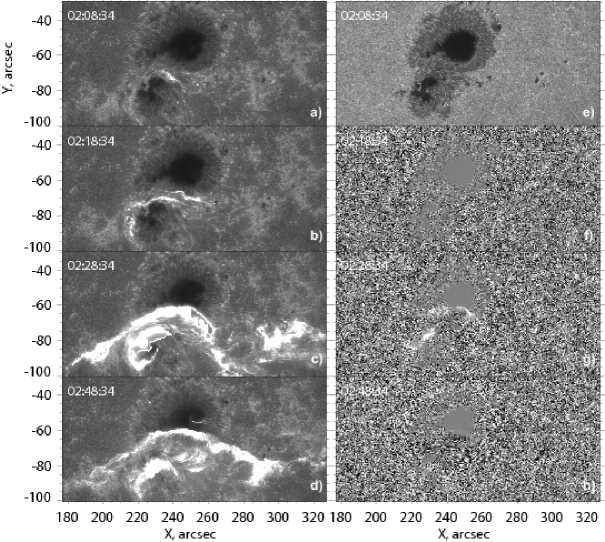
Images of the solar flare of December 13, 2006, were obtained by the Solar Optical Telescope (SOT) onboard the solar space mission Hinode in two spectral filters, the molecular line G-band and Ca II H. In each filter the images were obtained every 2 minutes with the spatial resolution of 0.2 acrsec. The pixel size of the images was 0.109 arcsec. The first observations of sunspot oscillations from Hinode by Nagashima et al. (2007) have shown that the G-band signal is suppressed in the sunspot umbra, but the Ca II H data reveal high-frequency oscillations with a peak around 6 mHz, originally discovered by Beckers & Tallant (1969). We also use the Ca II H images in this study (Fig. 1a-d. The images were carefully tracked to remove the proper motion of the large sunspot.
A first signature of the flare appeared in the Ca II H images at about 2:08 UT between two sunspots of the opposite magnetic polarity (Fig. 1a). The energy release was probably triggered by strong shearing flows around the following (smaller in size) sunspot (Zhang et al. 2007). Strong shearing flows have been observed also in other flares (e.g. Deng et al. 2006). The flare emission quickly extended during the next 10 min, forming a two-ribbon structure (Fig. 1b). The ribbons expanded in length and separated from from each other moving into the sunspot areas (Fig. 1c). The two-ribbon structure is also clearly visible in the G-band images (Fig. 1g) indicating that the perturbation extends into the photosphere. At this stage a bright arcade of connecting loops with the footpoints in the ribbons appeared in the Ca II H images (Fig. 1d). A movie of the image differences revealed a characteristic oscillatory pattern in the umbra of the larger sunspot after the start of the flare. The oscillations appear to form traveling waves with a more-or-less regular wave front.
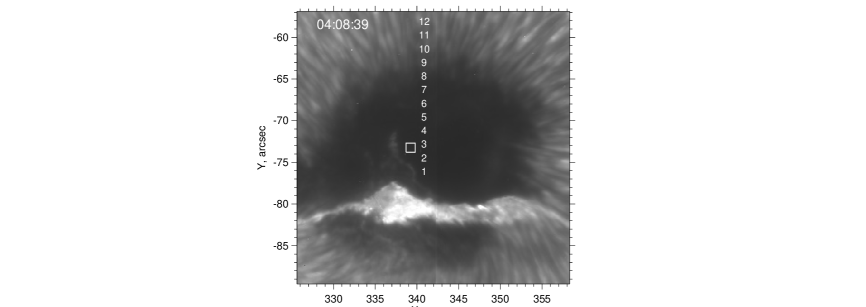
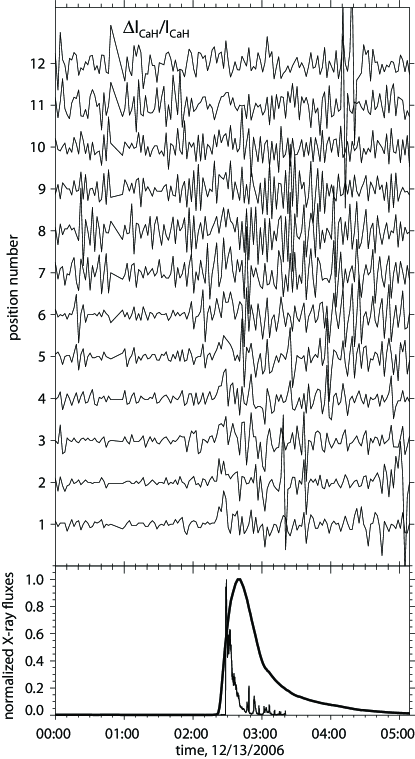
To illustrate the temporal behavior of the oscillations we plot the relative variations of the Ca II H intensity in 12 points (indicated by their position numbers in Fig. 2) at different distances from the final location of the flare ribbon, in Fig. 3, and compare with the variations of the soft X-ray flux from GOES-12 and hard X-ray in 50-100 keV energy range from RHESSI (the first few minutes of the flare are missing in RHESSI observations, which started at 2:28). Evidently, the oscillations in the umbra started immediately after the hard X-ray peak and before the soft X-ray maximum. The oscillation amplitude of the flare-excited oscillations exceeds the amplitude of preflare oscillation in the umbra by a factor 2-4. The RMS of the relative intensity variations (Fig. 4) shows that the relative oscillations in the central part of the umbra changes from 0.01-0.03 to 0.04-0.06. The relative amplitude increase is smaller in the outer umbra. The flare oscillation signal is essentially lost in the penumbra.
It can be seen from Fig. 3 that the oscillations excited by the flare have higher frequency than the oscillations prior the flare. The characteristic period of these oscillations is probably shorter than 3 min. Unfortunately, the 2-min cadence of the Hinode observations did not allow us to investigate the spectral and dispersion properties of these oscillations. Their amplitude may be significantly underestimated because of the poor sampling.
After the flare, the observations seem to show intrusions of hot flare material into the umbra area in addition to the flare ribbons. These cause variations of the Ca II H intensity in the umbra after the flare, thus masking and distorting the oscillation signal. Thus, it is rather difficult to follow the evolution of the oscillations and estimate the lifetime. Figure 5 shows the Ca II H intensity for longer than 12 hours in a -pixel area located in one of the least disturbed regions of the umbra. It seems that the oscillation amplitude returned to the pre-flare level after 6 hours. However, the lifetime is not yet determined.
An interesting question is whether the observed oscillations represent traveling or standing waves. Unfortunately, the low cadence of this observing run on Hinode did not allow us to convincingly answer this. Nevertheless, there is a hint that the waves were traveling North-ward from the flare ribbon during a short period after the flare impulse, and then the oscillations became more random. The traveling wave feature can be seen in Fig. 3 as a slight positive slope (from vertical) in the wave signals at points 1–6 between 2:30 and 3:00. To get an estimate of the wave speed, these signals were re-sampled to a 30-sec cadence and then cross-correlated with each other. The time lags were measured by fitting second-degree polynomials to the cross-correlation functions, and determining their maxima. This procedure was repeated for 10 North-South columns along the locations, 1–6, numbered in Fig. 2, and the mean and standard deviation values of these measurements are shown in Fig. 6. It seems that the wave speed is of the order of 50-100 km/s. This is much higher than the sound speed in the chromosphere. Thus, these waves must be of an MHD type. In general, the physics of sunspot oscillations is quite complicated. Understanding of this requires numerical modeling (e.g. Khomenko & Collados 2006).
3 Discussion
The observations of the solar flare of December 13, 2006, from Hinode reveal a new type of flare-excited oscillations. The oscillations observed in Ca II H images appeared in the chromospheric layers of the sunspot umbra immediately after the impulsive phase. They had the amplitude 2–4 times larger than the pre-flare oscillations in the umbra. Also, their frequency seemed to be higher. There is a weak evidence that during the first 30-40 min the oscillations represent waves traveling through the umbra in the direction away from the flare ribbon with a speed of 50–100 km/s. Then, the oscillation become more irregular with some occasional wave packets. The lifetime of these oscillations is probable about 8 hours. The uncertainties in the data analysis and interpretation are caused by the low cadence of the Hinode observing program during the flare. The images were taken every 2 min while the characteristic oscillation period is about 3 min. Most of the oscillation power is probably even at the shorter periods. Thus, for detailed studies of these oscillations it will be important to increase the image cadence.
The image cadence should be sufficiently high to capture the initial waves traveling with a speed of km/s according to our preliminary estimates. This speed indicates that the waves are of an MHD type, and if their speed is of the order of magnitude of the Alfven speed then they should propagate rather low in the sunspot chromosphere. Thus, simultaneous observations in photospheric lines would be interesting. The oscillation amplitude was several times higher than the amplitude of preflare umbral oscillations, which can be as high as 5–6 km/s (Yoon et al. 1995), and thus may reach supersonic velocities of 10–20 km/s.
Sunspot oscillations have been studied intensively for many years (for a review see Staude (1999)) but these Hinode observations seem to be first that show enhanced oscillations in the umbra, associated with a solar flare. Further investigations of these oscillations are of great interest for understanding the processes in solar flares and sunspots.
References
- Aschwanden et al. (1999) Aschwanden, M. J., Fletcher, L., Schrijver, C. J., & Alexander, D. 1999, ApJ, 520, 880
- Beckers & Tallant (1969) Beckers, J. M., & Tallant, P. E. 1969, Sol. Phys., 7, 351
- Deng et al. (2006) Deng, N., Xu, Y., Yang, G., Cao, W., Liu, C., Rimmele, T. R., Wang, H., & Denker, C. 2006, ApJ, 644, 1278
- Khomenko & Collados (2006) Khomenko, E., & Collados, M. 2006, ApJ, 653, 739
- Kosovichev & Zharkova (1998) Kosovichev, A. G. & Zharkova, V. V., 1998, Nature, 393, 317
- Kosovichev (2006a) Kosovichev, A. G. 2006a, Sol. Phys., 238, 1
- Kosovichev (2006b) Kosovichev, A. G. 2006b, Sunquake sources and wave propagation, in: Proceedings of SOHO 18/GONG 2006/HELAS I, Beyond the spherical Sun, ESA SP-624, p.134.1
- Moreton (1960) Moreton, G. E. 1960, AJ, 65, 494
- Nagashima et al. (2007) Nagashima, K., et al. 2007, ArXiv e-prints, 709, arXiv:0709.0569
- Staude (1999) Staude, J. 1999, Third Advances in Solar Physics Euroconference: Magnetic Fields and Oscillations, 184, 113
- Yoon et al. (1995) Yoon, T.-S., Yun, H. S., & Kim, J.-H. 1995, Journal of Korean Astronomical Society, 28, 245
- Zhang et al. (2007) Zhang, J., Li, L., & Song, Q. 2007, ApJ, 662, L35