11email: Emmanuel.Difolco@obs.unige.ch 22institutetext: Laboratoire d’Astrophysique de l’Observatoire de Grenoble, UMR CNRS/UJF 5571, BP 53, F-38041 Grenoble Cedex9, France 33institutetext: Center for High Angular Resolution Astronomy, Georgia State University, PO Box 3969, Atlanta, Georgia 30302-3965, USA 44institutetext: LESIA, UMR8109, Observatoire de Paris-Meudon, 5 place J. Janssen, F-92195 Meudon, France 55institutetext: Laboratoire Cassiopée, CNRS, Observatoire de la Côte d’Azur, BP 4229, F-06304 Nice Cedex 4, France 66institutetext: Institut d’Astrophysique et de Géophysique, Université de Liège, 17 Allée du Six Août, B-4000 Liège, Belgium 77institutetext: National Optical Astronomical Observatory, 950 North Cherry Avenue, Tucson, AZ 85719, USA
A near-infrared interferometric survey of debris disk stars
Abstract
Context. The quest for hot dust in the central region of debris disks requires high resolution and high dynamic range imaging. Near-infrared interferometry is a powerful means to directly detect faint emission from hot grains.
Aims. We probed the first 3 AU around Ceti and Eridani with the CHARA array (Mt Wilson, USA) in order to gauge the m excess flux emanating from possible hot dust grains in the debris disks and to also resolve the stellar photospheres.
Methods. High precision visibility amplitude measurements were performed with the FLUOR single mode fiber instrument and telescope pairs on baselines ranging from 22 to 241 m of projected length. The short baseline observations allow us to disentangle the contribution of an extended structure from the photospheric emission, while the long baselines constrain the stellar diameter.
Results. We have detected a resolved emission around Cet, corresponding to a spatially integrated, fractional excess flux of with respect to the photospheric flux in the –band. Around Eri, our measurements can exclude a fractional excess of greater than (). We interpret the photometric excess around Cet as a possible signature of hot grains in the inner debris disk and demonstrate that a faint, physical or background, companion can be safely excluded. In addition, we measured both stellar angular diameters with an unprecedented accuracy: mas and mas.
Key Words.:
Stars: individual: Cet & Eri – Stars: fundamental parameters – circumstellar matter – Methods: observational – Techniques: interferometric1 Introduction
Planetary systems around main-sequence (MS) stars were first indirectly revealed through the detection of their far-infrared (IR) photometric excesses by the IRAS and ISO satellites. Early interpreted as the signpost of planetary activity, this IR emission is thought to arise from short-lived dust grains in gas-free, optically thin disks. The production of grains is sustained by asteroid collisions and out-gassing of comets in the first tens of AU and by collisions of Kuiper belt-like bodies at larger distances (Meyer et al. 2007). Such grains are also known to form the zodiacal cloud in our own solar system. Given the huge contrast with respect to their host star, so far only the brightest nearby debris disks have been resolved. Single aperture images have highlighted a great diversity of large scale structures comparable to our own Kuiper belt (KB) – albeit more massive and extended– with a relative void of matter in the central regions, where planets could plausibly have cleared away the dust (Schneider et al. 2006, and recent review by Mann et al. 2006).
The detections of photometric excesses in the 25–100 m range are much more numerous. Recent surveys, that benefit from the high sensitivity of the Spitzer Space Telescope, have revealed not only cold and distant grains in KB analogs, but also warmer grains in the inner disk regions where planets could be present. For solar-type MS stars, the current photometric accuracy of Spitzer places a detection threshold at 100 times the fractional luminosity of our zodiacal cloud at 70 m, 1000 times at 24 m and 1400 times in the m range respectively. Bryden et al. (2006) have reported a disk frequency of at 70 m, confirming the preliminary studies of Decin et al. (2000) and Habing et al. (2001), with an extended and deeper survey of mature FGK field stars. At shorter wavelengths, Beichman et al. (2006) concluded that asteroid belts times more massive than our own are very rare, with an 8–13 m excess frequency lower than 2.5 for sun-like stars older than 1 Gyr. This result confirms the lack of warm ( K) grains tentatively detected at mid-IR wavelengths by previous surveys. Based on the current sensitivity limits, Bryden et al. (2006) suggest that the statistical distribution of positive detections is consistent with most nearby solar-like stars harbouring exozodiacal clouds as bright as 0.1 to 10 times our own.
The presence of hot grains in the first AUs of extra-solar planetary systems cannot be unequivocally determined by classical photometry. The typical accuracy of this method amounts to a few percent at best in rather large fields of view (FOV). On the other hand, near-IR interferometers can provide sub-AU spatial resolution in a field of view comparable to the size of the telescope diffraction pattern. Our observing strategy consists of using an optimised set of baseline configurations in order to directly measure the excess ratio between the resolved disk and the only partially resolved stellar photosphere (Di Folco et al. 2004). This method was recently shown to work with the detection of a circumstellar –band excess around Vega (Absil et al. 2006). Fiber-filtered interferometers make it possible to directly measure contrasts larger than 100:1 in the near-IR.
The present paper investigates the case of the brightest sun-like stars in our neighborhood, Eridani (K2V, 3.22 pc, ) and Ceti (G8V, 3.65 pc, ). These two stars have very close spectral types but different ages: Eri is younger than 1 Gyr, while Cet is about twice as old as the Sun ( Gyr) (Song et al. 2000; Habing et al. 2001; Di Folco et al. 2004). The cold regions of their debris disks were imaged at sub-mm wavelengths. The images of Eri reveal an almost face-on, clumpy ring-like structure, peaking at 65 AU (Greaves et al. 1998, 2005; Poulton et al. 2006). The disk around Cet was detected by Greaves et al. (2004) at 850 m and shows an elongated emission, that could be interpreted either as an edge-on disk/ring extending out to 55 AU, or as a face-on clumpy structure. The inferred mass111assuming a collisional cascade of km-sized bodies down to 20 m grains amounts to 5–9 around Eri and 1.2 around Cet, which can be compared with the 0.1 content of cometary-like bodies in our Kuiper belt (Gladman et al. 2001).
We propose to further investigate this comparison with the inner solar system, by probing the warm dust content of the interplanetary clouds around these two sun-like stars. This paper is the first of a series aiming at directly detecting and characterising the emission of hot grains in exozodiacal clouds with the CHARA Array interferometer (ten Brummelaar et al. 2005) on Mt Wilson (California) with the FLUOR beam combiner (Coudé du Foresto et al. 1997; Mérand et al. 2006). The survey that we have initiated focuses not only on solar-type stars, as described in the present paper, but also on earlier spectral types, as discussed in a forthcoming paper (Absil et al., in preparation).
2 Interferometric observations and data analysis
2.1 CHARA / FLUOR observations
Eri and Cet were observed in October 2006 in the –band (1.94–2.34 m). Two pairs of 1 m telescopes were used with separations of 34 m (S1-S2 baseline) and 250 m (S2-W1). The short baseline allows the large scale emission around the stars (e.g., disk, companion) to be resolved, while the long one constrains the stellar diameter through the position of the first minimum of the visibility curve. The FLUOR beam combining instrument measures the squared modulus of the coherence factor (visibility) of the two interfering telescope beams, after spatial filtering of the wavefronts by single-mode fibers. The interferograms are recorded through a temporal modulation of the optical path difference between the wavefronts with a 250 m scan length and a read-out frequency of 500 Hz. The instrumental visibility (or transfer function) was estimated using interleaved observations of standard stars from the catalogues of Bordé et al. (2002) and Mérand et al. (2005) (see Table 1). The interferometric field of view is limited to the Airy disk of individual telescopes, i.e. about 0.55 arcsec in radius at 2.2 m (slightly chromatic across the –band). The instrument field of view is further limited by the wider FOV of the single-mode fiber, which filters out the wavefront corrugations before the beam combination, and can thus be affected by a source of incoherent emission. The effective FOV results from the overlap integral of the turbulent wavefront with the Gaussian-shaped, fundamental mode of the fiber (FWHM = 0.8 arcsec). This results in a linear FOV of 2.6 AU (FWHM) for Eri and 2.9 AU for Cet.
2.2 Data analysis and methodology
The broad-band squared visibilities (2) are extracted using the FLUOR Data Reduction Software (Coudé du Foresto et al. 1997; Kervella et al. 2004; Mérand et al. 2006) using a wavelet- and Fourier-based analysis. The total uncertainty of each visibility measurement includes the intrinsic dispersion of individual 2 estimations as well as the calibrator induced error on the absolute visibility.
The visibilities of the source model are computed as follows:
| (1) |
where is the FLUOR chromatic transmission function in the –band filter, is the Planck function (in photons s-1 Hz-1 m-2) for the stellar effective temperature and is the monochromatic visibility of the source at the projected baseline . This formula takes into account the so-called bandwidth smearing effect, the result of which is that the modeled wide-band visibilities never reach zero.
While compact photospheres with a typical angular diameter of mas are fully resolved with baselines of order of 250 m at m, an extended emission from possible hot grains beyond their sublimation distance, over resolved at these large baselines, can be resolved with telescope separations as short as 10–20 m. In order to detect such an IR excess, we first compare FLUOR visibilities at the 34 m baseline with the visibility expected for a purely photospheric emission. To this end, we use the high precision angular diameters derived from earlier interferometric observations with VLTI/VINCI (Di Folco et al. 2004) to extrapolate the visibility of the stellar photosphere for the 20–30 m range. At such low spatial frequencies, the extrapolated 2 is insensitive to the photospheric limb-darkening profile, so the uniform disk approximation can be used. Since the stellar surface is almost completely unresolved (), this extrapolation can be done with high precision.
In a second step, a simple model of the source brightness distribution is fitted to the full data set, including short and long baselines, in order to simultaneously estimate the photospheric angular diameter and the contrast of the circumstellar environment (CSE), if any. The photospheric limb-darkening follows the, non physical, description proposed by Hestroffer (1997): , were is the cosine of the azimuth of a surface element of the star where at the centre of the stellar disk and 0 at the limb. This parameterization results in an analytical formulation for the monochromatic stellar visibility:
| (2) |
If a significant deficit of visibility is detected at low spatial frequencies, the global model takes into account a second component in addition to the star itself. Writing the relative brightness of the CSE with respect to the total brightness, the final squared visibility can be written as:
| (3) |
If we assume the CSE to be composed of a uniform emission of infinite radius (or at least extended enough to be over resolved at the shortest baseline, i.e. for all ), this expression can be simplified to:
| (4) |
where is the broad-band visibility computed as in (1). In particular, if , and the visibility deficit at short baselines is about twice as large as the CSE brightness ratio.
For the sake of simplicity, and given our limited sampling in spatial frequencies, we will assume the source brightness profiles to be circularly symmetric. For Eri, this is supported by the independent estimations of the inclination of its stellar rotation axis (, Croll et al. 2006) and of its debris disk (about 25 , Greaves et al. 2005). The inclination of Cet is less clear, but both stars have very low rotational velocities, with respectively equal to 1.4 km.s-1 for Cet and 2.4 km.s-1 for Eri (Valenti & Fischer 2005), so that no detectable elongation of their stellar surface is expected.
2.3 Results for Ceti and Eridani
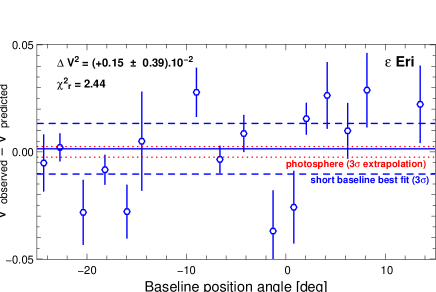
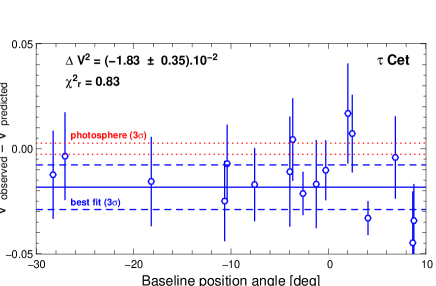
The results of the short baseline measurements are presented in Fig. 1. The projected baseline ranges between 22 and 26 m for Cet and between 24 and 28 m for Eri. These plots show a clear departure from the expected photospheric visibility for Cet. The visibility extrapolated from the earlier estimation of the stellar diameter with VLTI/VINCI is plotted as a thin dotted line for reference ( interval). We fit a 2 deficit ( , which is assumed to be constant over the projected baseline range: ( Cet) (0.83). The data do not show any trend associated with the baseline azimuth, which supports the assumption of circular symmetry. In the case of Eri, the measurements are consistent with the visibility expected from the VLTI/VINCI estimation of the stellar angular diameter. Although the dispersion of the measurements is slightly larger than in the case of Cet, we can put a upper limit to the visibility deficit in the 20–30 m range ( Eri) (). The rather high value is due to the dispersion of the measurements, with a large contribution from the five points with larger uncertainties but beyond from the central fit value. The larger dispersion compared to Cet seems to be linked to a degraded coupling of light into the instrument fibers, possibly due to poorer atmospheric conditions.
.
| Identifier | Sp. type | [mas] | Target | |
|---|---|---|---|---|
| HD 787 | K5III | 1.80 | 2.52 0.03 a | Cet |
| HD 1522 | K1III | 0.92 | 3.36 0.04 a | Cet |
| HD 6805 | K2III | 0.88 | 3.44 0.04 a | Cet |
| HD 8815 | K0IIIb | 1.48 | 2.76 0.03 a | Cet , Eri |
| HD 12596 | K2III | 3.12 | 1.233 0.016 b | Cet |
| HD 12685 | M0/1III | 2.83 | 1.450 0.019 b | Cet |
| HD 16212 | M0III | 1.28 | 3.11 0.03 b | Cet , Eri |
| HD 16526 | K4/5III | 2.92 | 1.389 0.017 b | Cet |
| HD 18071 | G8/K0III | 3.09 | 1.056 0.014 b | Cet, Eri |
| HD 29063 | K2III | 2.80 | 1.38 0.017 b | Eri |
| HD 39853 | K5III | 1.84 | 2.38 0.027 a | Eri |
| HD 220935 | K5III | 2.6 | 1.963 0.098 b | Cet |
| HD 221745 | K4III | 2.88 | 1.426 0.019 b | Cet |
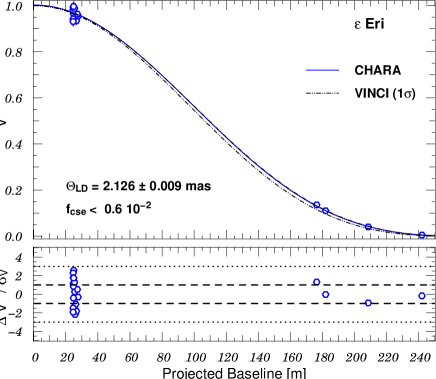
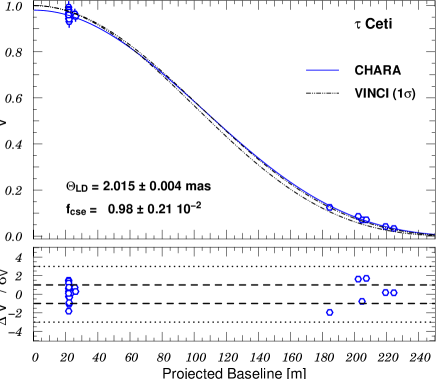
The combined data collected at short and long baselines (up to 224 m for Cet and 241 m for Eri) are then fitted with a limb-darkening model of photospheric emission, along with a circumstellar component in the case of Cet, as explained in details in Sect. 2.2. The values for the limb-darkening (LD) description of Hestroffer are derived from the theoretical 4-parameter law tabulated by Claret (2000) for the adopted stellar and metallicity. We find for Cet and for Eri. Because of our sparse sampling of the () plane, our data do not allow us to spatially characterise the shape of the detected CSE around Cet. We therefore consider the simple case of a uniformly bright component in the FOV (i.e. a fully resolved disk), accounting for a fractional – spatially integrated – flux ratio . The model visibility, including the bandwidth smearing effect, then follows from Eq. 4.
For Eri, the data are consistent with no excess emission from the CSE, within a uncertainty. The LD model fit results in an angular diameter of mas (statistical error only). The fractional excess emission of its inner debris disk can be constrained to values lower than ( upper limit). We emphasize that the presence of a faint excess due to the CSE not only produces a visibility deficit at short baselines, but also changes the general slope of the visibilities at long projected baselines. Therefore it can bias any angular diameter estimation by an amount that exceeds the internal dispersion of the measurement (for more details, please refer to Di Folco et al. 2004). In the case of Cet, the relative CSE excess amounts to and the de-biased CHARA LD diameter is estimated to be mas. Correcting the 2004 VLTI data for this bias leads us to the revised value mas. In the next section, we analyse the error budget and further compare the CHARA and VLTI measurements.
2.4 Discussion
Eri and Cet are very similar in spectral type, magnitude and declination, and they also share several calibrator stars, so the potential instrumental or calibration bias in our measurements should be the same for both targets. The detection of a short baseline deficit for Cet, associated with a negative detection for Eri, and a comparable statistical uncertainty, reinforces our confidence in the observing method and in the reality of the detection itself. The observed CSE excess is of the order of the excess detected around the A0 dwarf Vega (, Absil et al. 2006) and allows the stellar angular diameter to be debiased. The derived uncertainties confirm that we can reach a precision on the CSE excess of about () in 10–15 measurements, under median atmospheric conditions for stars.
The formal statistical precision of the fitted angular diameters is very small (5–10 as), since we were able to approach the first minimum of the visibility function. The total uncertainty should also include contributions from the uncertainty of the calibrator diameters, the uncertainty of the chromatic transmission function , and from our a priori assumptions on the limb-darkening profiles. For the calibration uncertainty we use a conservative value of 0.010 mas. The uncertainty of the stellar metallicity (0.2 dex) and (100 K) leads to a typical uncertainty for the -determination of , which translates into a maximum 2.5 as error on the fitted angular diameters. The LD parameters tabulated by Claret (2000) are based on ATLAS 1D-models of stellar atmospheres. Bigot et al. (2006) have compared the determination of diameter using the 1D ATLAS model to those produced by the 3D radiative hydrodynamical simulations for the star Cen B, a star whose fundamental parameters are very close to those of our targets (K1V, = K, , [Fe/H]=0.2). They find that the 3D simulations produce a systematically smaller diameter (17 as difference, or 0.3 %), mainly impacting the second lobe visibilities. Finally, for the uncertainty of the instrumental transmission, we use the error quoted by Bigot et al. (2006) for the VINCI instrument, a conceptual copy of the FLUOR instrument developed for the VLTI. This 0.15 % uncertainty leads to an additional 3 as error on our angular diameters. Quadratically adding the statistical precision from the fits and the systematics related to the calibration, to the -prescription and to the chromatic transmission, we derive a total uncertainty of 0.011 mas for Cet and 0.014 mas for Eri. We emphasise that the use of the 1D ATLAS models for the a priori assumption on the LD profile, which are not constrained at all by our observations, may overestimate these diameters by an amount comparable to the final uncertainty, compared to 3D hydrodynamical models. Measurements in the second lobe of the visibility function will be needed to properly estimate the impact of the LD profile on the diameter determination.
| Target | Instrument | [mas] | () | |
|---|---|---|---|---|
| Cet | CHARA | 1.1 | ||
| VLTIa | ||||
| VLTIb | 0.98 | |||
| Eri | CHARA | 2.1 | ||
| VLTIa |
-
a
From Di Folco et al. (2004).
-
b
New fit with fixed value.
A comparison between CHARA/FLUOR and VLTI/VINCI measurements, taking into account the total error budget, is presented in Table 2. After a correction for the CSE bias, VINCI diameter estimations appear to agree with the new values within for Cet and within for Eri. The precision of the Hipparcos parallax contributes 12 % to the final uncertainty on the linear radius of Cet and 8 % for Eri: and .
3 Nature of the infrared excess
3.1 An unlikely faint companion around Cet
Several physical models can explain the visibility deficit observed at short baselines. One trivial solution can be an IR point source within the FOV of the instrument. Deriving the contribution of this source from the amplitude of the visibility deficit allows us to address the question of its angular separation with the scientific target. A maximum upper limit on the source contrast can be set to , equivalent to a maximum observed magnitude .
For a physically bound faint source, we can estimate the spectral type from the known distance of Cet ( pc). Applying the empirical relations from Delfosse et al. (2000) with borderline conditions, it follows that a companion would have an absolute magnitude of , and thus a mass . Using an age of about 10 Gyr and a metallicity , Baraffe et al. (1998) models indicate a temperature = 2800–3000 K and a spectral type M6-9V. Orbiting at less than 4 AU, such a massive body would also present a clear astrometric and/or radial velocity (RV) signature, depending on the inclination of the system. With a mass ratio of 10 and a maximum separation of 4 AU (period yr), the astrometric signature of the binary would amount to mas (minimum angular semi-major axis). No significant motion was detected by Hipparcos at a 0.8 mas level during the 4-year mission (Perryman 1997). Moreover, long-term radial velocity follow-up of Cet has reported very stable measurements over about a decade. Wittenmyer et al. (2006) exclude the presence of a Jupiter-mass planet on a 5 AU, circular orbit based on an upper limit of the semi-amplitude velocity 10–15 m.s-1. This is also independently confirmed by the CORALIE survey which shows a constant radial velocity with a 5 m.s-1 rms over more than 5 yr (Udry, private communication). RV measurements alone would constrain the orbital inclination (with respect to the sky plane) of any 0.09 companion to values smaller than 0.21 deg, which is very unlikely and also incompatible with the astrometric constraint.
Furthermore, an IR background source can also be ruled out given its low statistical likelihood. The 2MASS survey (Cutri et al. 2003) has detected only 355 sources brighter than in a 5 deg radius patch around cet. The local surface density of such IR sources is thus as low as arcsec-2, hence the probability of finding such a faint source in a maximum FOV of about 2 arcsec2 is . The same reasoning leads to a probability of for Eri. In conclusion, although our interferometric observations alone could in principle be reproduced with an additional faint point-like source in the FOV, we can confidently exclude the presence of any such companion.
3.2 Circumstellar hot dust grains around Cet
We show in this section that the detected –band excess around Cet can be explained by the emission within our FOV of hot dust grains in an exozodiacal disk. Since the spatial frequencies probed by the current data set do not allow us to determine the exact geometry of the emission, we assume it to be represented by a disk of outer radius as large as our FOV, or at least large enough to be fully resolved at m. Following Eq. 4, the derived integrated flux excess of this inner disk, relative to the stellar flux in the –band, is . Other models such as a thin ring or a spherical envelope could also be considered and would provide slightly different values for , yet have a small impact on our final result. However, the spatial characterisation of this CSE is beyond the scope of this paper, since it would require many more visibility measurements with a continuous sampling of the (, ) plane. Based on this photometric excess value, we will use a modeling approach similar to that described in Absil et al. (2006), and successfully used to reproduce the resolved emission around Vega.
We compiled published flux measurements from the visible to the sub-mm, resulting in the spectral energy distribution (SED) shown in Fig. 3. The stellar atmosphere SED is modeled with a NextGen spectrum (Hauschildt et al. 1999) with K and , and scaled to match the observed -band magnitude (dashed-dotted line on Fig. 3). The well-known far-IR excess beyond 60 m is also shown in Fig. 3, where it has been fitted, for the sake of comparison, with a modified K–blackbody following the Greaves et al. (2004) prescription (dotted line). This long-wavelength emission component is associated with a reservoir of cold material comparable in size to the solar Kuiper belt, and imaged by Greaves et al. (2004) with SCUBA. These cold grains orbit far beyond the 3 AU region probed with CHARA, and we will thus concentrate only on the warm dust content close to the star.
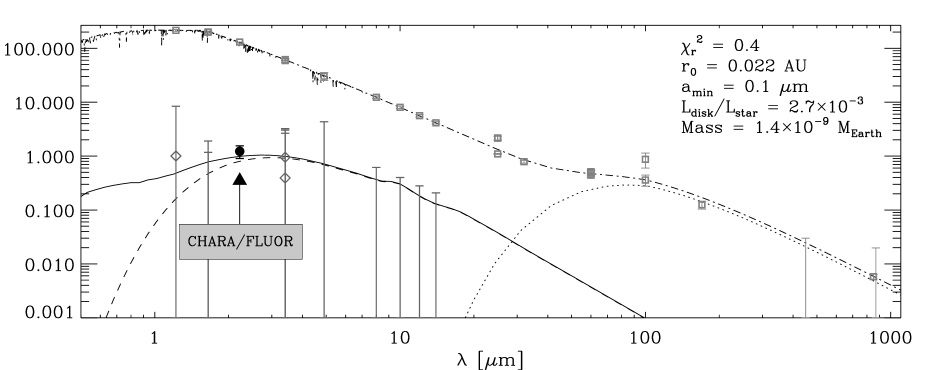
The 1–14 m SED of the assumed warm dust population (plotted below the star SED on Fig. 3) is obtained by subtracting the modeled photospheric emission from the measurements collected in the literature, except for the –band where we used the excess directly measured by FLUOR. As in Absil et al. (2006), theoretical inner disk SEDs are calculated using the optically thin disk model of Augereau et al. (1999) for broad ranges of minimum grain radii (), dust chemical compositions, disk inner rim positions () and surface density power law indexes. Compared to the Vega case it appears that the fits are less constrained, in particular because we are lacking accurate 10 m observations, but qualitatively the model requirements are very similar. We have therefore adopted the grain composition ( glassy olivine, amorphous carbons), the size distribution (), and the surface density profile () found to best fit the Vega inner disk. The disk mass within the FOV is then obtained by a least-square fit of the photometric constraints. The strongest constraints to the fit are the –band FLUOR measurement and the Spitzer/IRS observations (Chen et al. 2006, and Spitzer archives data). According to Chen et al. (2006), the 10–35 m IRS spectrum is consistent with purely photospheric emission within an the uncertainty of (%). The non-detection of a disk at mid-IR wavelengths is here represented as upper limits to the disk emission at four representative wavelengths (, , and m).
The best values are obtained for minimum grain sizes smaller than about m. Assuming m, in order to continue the comparison to the Vega case, we find AU (i.e. 5 stellar radii), the surface density being effectively sharply truncated at the sublimation distance for any given grain size if . The fit restricts the possible parameter space to AU for m and AU for m, although with a lower probability. This simple modeling demonstrates that a steep distribution (the density scales as ) of hot and small grains (m) can reproduce the detected –band excess without generating much mid- or far-IR emission. Such a tenuous inner disk would have a typical mass of the order of (using mm) and mean collisional time-scales of a few weeks at the inner disk edge (or in the less probable case of grains with m).
For comparison, our zodiacal cloud is estimated from its infrared emission to have a total mass between and (Leinert et al. 1996; Fixsen & Dwek 2002). The surprising similarity in the orders of magnitude partly comes from the much steeper radial dependence of the surface density as compared to in the Solar system (Kelsall et al. 1998, after integration along the vertical axis). We note however that adopting a flatter surface density profile for Cet () increases the computed mass within the FOV by a factor of only 5. The model proposed for Cet is obviously not a unique solution, but it does demonstrate that exozodiacal dust disks around solar-type stars might have structures that significantly depart from that of the Solar System (see discussion in Sect. 5).
3.3 New constraints on the disk around Eri
In Sect. 2.3, we placed an upper limit on a possible –band visibility
deficit at short baselines of for Eri. Based on the same simplistic assumption for the disk
geometry as for Cet, this value translates directly into a
maximum fractional photometric excess ().
Given that the
stars are very similar in terms of fundamental parameters, we have estimated the maximum mass of
grains in the inner disk in the framework of the model computed for Cet. According to
archive Spitzer IRS observations (program ID: 90 see also Marengo 2005) 222online
presentation available at:
http://www.stsci.edu/institute/center/information/streaming/archive/
NRDD2005/workshopOverview, it appears that no significant mid-IR excess is detectable below m around Eri, meaning that the photometric constraints for its inner disk emission
are similar to those of Cet. Considering that the best-fit model for Cet produces a fractional
excess of at m, a disk mass of (for the steep radial
distribution) can be regarded as a conservative upper limit for hot grains around Eri.
A tentative fit using leads to a preliminary value of for a density distribution and m ( for m respectively).
We note that the absence of a detectable IR excess, hence of hot grains – if confirmed – could be linked to the presence of a massive planet ( ) orbiting around Eri on an eccentric orbit ( AU, , Benedict et al. 2006). This giant planet should influence the dynamics of hot grains in the inner region of the debris disk, where it could clear off the dust. Numerical simulations by Thébault et al. (2002), based on the early planetary parameters derived by Hatzes et al. (2000), have shown that the region inside the planetary orbit is very hostile to planetesimal accretion and terrestrial planet formation. Beyond 0.9 AU, test particles are rapidly ejected from the system (this limit might even be decreased down to 0.6 AU with the larger mass and eccentricity revised by Benedict et al. 2006). This is also consistent with the recent results of Jones et al. (2006) for the stability of Earth-like planets in the habitable zone around Eri. Inside this dynamically unstable zone, the relative orbital velocities between planetesimals are so large (15–40 km/s, Thébault, private communication) that most collisions would result in disruption rather than accretion. Refractory dust grains with collision velocities above a threshold of 20 km.s-1 may even be partially or completely vaporised (Tielens et al. 1994). The presence of an inner reservoir of large bodies to sustain the presence of hot grains in this system seems therefore very unlikely.
4 Discussion
4.1 Small grains near the star
The small hot grains invoked to reproduce the detected emission around Cet are also observed in the inner part of our own planetary system. In the case of dust located near the Sun, grain properties that are relevant to our study can be found in Mann et al. (2004), based on in situ spacecraft measurements, remote observations at visible and IR wavelength and theoretical modeling. Interplanetary dust particles beyond about 0.5 AU are known to be concentrated in the ecliptic plane, where they form the zodiacal cloud. Their presence is also inferred down to a few solar radii by observations of the so-called F-corona during solar eclipses. Zodiacal light observations can trace the 1–100 m size particles down to 0.3 AU. They have revealed a flat distribution of the dust, with a number density decreasing proportionally to about . Inward of 0.1 AU (20 ), large changes of the grains albedo and polarization in the F-corona suggest a change of dust size and composition, possibly linked to the sublimation of various dust species. Temporary detections of an IR brightness feature during eclipses can also be linked to a significant amount of thermal emission, dominated by efficient absorbers like carbon grains. These past detections have opened up a debate about the possible existence of a dust ring composed of particles of sizes m, with a local density enhancement of a factor 4 in the 1–4 region (Kimura et al. 1998). There are therefore similarities with these models and the grains required to model the inner disk around Cet, however, the detected emission around this latter appears much more prominent than in the solar system.
4.2 Origin of the dust
Dust supply in the solar zodiacal cloud is supposed to be sustained by asteroid collisions and evaporation of short-period comets, although the respective contributions are unknown. Mechanisms invoked to produce the warm dust ( K) observed in the handful of presently detected systems are comprised of: a steady-state evolution of a massive asteroid belt undergoing collisions and eventually sublimation, the sublimation of a ”supercomet” captured in a close-in orbit (Beichman et al. 2005), the recent collision between large planetesimals, and the sublimation of a swarm of comets/planetesimals possibly triggered by a late heavy bombardment (LHB)-like event. Wyatt et al. (2007) have investigated these various scenarios for the few stars known from Spitzer spectroscopic surveys to harbour such warm grains. These are detected through their m silicate feature, but for the vast majority they are not yet not spatially resolved. They conclude that recent and transient events that would have caused a population of planetesimals to be scattered in the inner disk from an outer belt are the most likely explanation. Since an LHB is believed to be triggered when migrating giant planets cross their mutual mean motion resonance (1:2 resonance in the case of the solar system, Gomes et al. 2005), this could in principle occur at any time in the system’s history, depending on the initial conditions for the planets relative positions and the planetesimal disk. With an age of about 10 Gyr and a known reservoir of potential comets (one or two orders of magnitudes more massive than our KB), Cet is likely undergoing a transient event of dust production, whose nature remains to be determined. Precious hints for the origin of the dust and its production mechanism might come from future detections of long-period giant planets or the detection of silicate features.
4.3 Prospect for DARWIN target selection
The bright nature of exozodiacal clouds is a potential problem for the direct detection of terrestrial planets around nearby stars. Future missions like DARWIN or TPF-I/-C, which aim to detect Earth-like planets around mature solar type stars, will be based on nulling interferometry or chronography. The presence of small grains in exozodiacal clouds could be a dominant noise source in both methods, depending not only on the level of the emission but also on its spatial distribution (radial extension, disk inclination, presence of structures,…). Earth-like planet detection in the presence of dust clouds 10 times brighter than our own zodiacal cloud might be very difficult, a level still two orders of magnitude below the current sensitivity limit of Spitzer around 10 m. Studying the emission of inner hot dust disks in the near- and mid-IR with an increased sensitivity is therefore a crucial pre-requisite to the selection of suitable targets for direct planet detection. In the case of Cet, further investigations of its inner debris disk are necessary to characterise its spatial extension in the terrestrial planets zone and to compare its mid-IR brightness to that of the Solar system. Correlating the presence of such near-IR emission with excesses at longer wavelengths could potentially provide valuable diagnostics for the target selection process of these future missions. The extension of our program to a broader sample of nearby Solar-type stars, either with the CHARA/FLUOR facility or with the VLTI instrumentation, should make it possible to carry out such analysis in the next few years.
5 Conclusion
We have used the short and long baselines of the CHARA Array and the FLUOR interferometric instrument to probe the close environment of two sun-like stars Eri and Cet. Our observations put a stringent upper limit on the m emission of possible hot dust grains around Eri and we derive a more precise photospheric diameter estimation compared to our previous VLTI/VINCI results. Around Cet, we detect at small short baseline a visibility deficit, from which we derive a faint photometric excess originating from the circumstellar environment. We showed in Sect. 3.1 that the case of a bound or background companion can be excluded with a high probability, while a simple distribution of warm dust grains could be consistent with the photometric constraints from the near- to mid-IR. Preliminary modeling results show that a grain distribution with micronic or sub-micronic minimum sizes, and with surface density peaking at a few stellar radii, is best able to reproduce the detected near-IR excess together with the lack of significant 10–15 m emission (Spitzer constraint). The m excess detection calls for more efforts to probe the possible m emission of the suspected grains around Cet either with MIDI at the VLTI or with the nulling mode of the Keck interferometer. Characterising the spatial extension of inner exozodiacal disk emissions is a crucial precursor science on the road to future terrestrial planet imaging missions like DARWIN or TPF.
Acknowledgements.
We thank P. J. Goldfinger and Ch. Farrington for their assistance with operation of CHARA. The CHARA Array is operated by the Center for High Angular Resolution Astronomy with support from Georgia State University and the National Science Foundation, the W. M. Keck Foundation and the David and Lucile Packard Foundation. We are grateful to Ph. Thébault for fruitful discussions, that contributed to improve our analysis and our understanding of the dynamical environment of Eri . We gratefully thank the anonymous referee for valuable suggestions and comments. O.A. acknowledges the financial support of the Belgian National Fund for Scientific Research (FNRS) while at IAGL and of a Marie Curie Intra-European Fellowshipwhile at LAOG. This research made use of NASA’s Astrophysics Data System and of the SIMBAD database, operated at CDS (Strasbourg, France). This publication makes use of data products from the Two Micron All Sky Survey, which is a joint project of the University of Massachusetts and the Infrared Processing and Analysis Center/California Institute of Technology, funded by the National Aeronautics and Space Administration and the National Science Foundation.References
- Absil et al. (2006) Absil, O., Di Folco, E., Mérand, A., et al. 2006, A&A, 452, 237
- Augereau et al. (1999) Augereau, J. C., Lagrange, A. M., Mouillet, D., Papaloizou, J. C. B. & Grorod, P. A. 1999, A&A, 348, 557
- Baraffe et al. (1998) Baraffe, I., Chabrier, G., Allard, F., Hauschildt, P. H. 1998, A&A 337, 403
- Benedict et al. (2006) Benedict, G. F., McArthur, B. E, Gatewood, G. et al. 2006, ApJ, 132,
- Beichman et al. (2005) Beichman, C. A., et al. 2005, ApJ, 626, 1061
- Beichman et al. (2006) Beichman, C. A., Tanner, A., Bryden, G. et al. 2006, ApJ, 639, 1166
- Bigot et al. (2006) Bigot, L., Kervella, P., Thévenin, F., Ségransan, D. 2006, A&A, 446, 635
- Bryden et al. (2006) Bryden, G., Beichman, C. A., Trilling, D. E. et al. 2006, ApJ, 636,1098
- Bordé et al. (2002) Bordé, P., Coudé du Foresto, V., Chagnon, G., Perrin, G. 2002, A&A, 393, 183
- Coudé du Foresto et al. (1997) Coudé du Foresto, V., Ridgway, S., Mariotti, J.-M. 1997, A&AS, 121, 379
- Chen et al. (2006) Chen, C., Sargent, B. A., Bohac, C. et al. 2006, ApJS, 166, 351
- Claret (2000) Claret, A. 2000, A&A, 363, 1081
- Croll et al. (2006) Croll, B., Walker, G. A. H., Kuschnig, R. et al. 2006, ApJ, 648, 607
- Cutri et al. (2003) Cutri, R. M., Skrutskie, M. F., van Dyk, S., et al. 2003, VizieR Online Data Catalog, 2246, 0
- Decin et al. (2000) Decin, L., Waelkens, C., Eriksson, K., et al. 2000, A&A, 364, 137
- Delfosse et al. (2000) Delfosse, X., Forveille, T., Ségransan, D. et al. 2000, A&A, 36, 217
- Di Folco et al. (2004) Di Folco, E., Thévenin, F., Kervella, P., et al. 2004, A&A, 426, 601
- Fajardo-Acosta et al. (1998) Fajardo-Acosta, S. B., Telesco, C. M., Knacke, R. F. 1998, AJ, 115, 2101
- Fixsen & Dwek (2002) Fixsen, D. J. & Dwek, E. 2002, ApJ, 578, 1009
- Gladman et al. (2001) Gladman, B., Kavelaars, J. J., Petit, J.-M. et al. 2001, AJ, 122, 1051
- Gomes et al. (2005) Gomes, R., Levison, H. F., Tsiganis, K., Morbidelli, A. 2005, Nature, 435, 466
- Greaves et al. (1998) Greaves, J. S., Holland, W. S., Moriarty-Schieven, G. et al. 1998, ApJ, 506L, 133
- Greaves et al. (2004) Greaves, J.S., Wyatt, M.C., Holland, W.S., Dent, W.R.F. 2004, MNRAS, 351, L54
- Greaves et al. (2005) Greaves, J.S., Holland, W. S., Wyatt, M. C. et al., 2005, ApJ, 619, 187
- Hatzes et al. (2000) Hatzes, A. P., Cochran, W. D., McArthur, B. et al. 2000, ApJ, 544L, 145
- Hauschildt et al. (1999) Hauschildt, P. H., Allard, F., & Baron, E. 1999, ApJ, 512, 377
- Hestroffer (1997) Hestroffer, D. 1997, A&A, 327, 199
- Habing et al. (2001) Habing, H. J., Dominik, C., Jourdain de Muizon, M. et al. 2001, A&A, 36, 545
- Jones et al. (2006) Jones B. W., Sleep, P. N., Underwood, D. R., 2006, ApJ, 649, 1010
- Kelsall et al. (1998) Kelsall, T., Weiland, J. L., Franz, B. A. et al. 1998, ApJ, 508, 44
- Kervella et al. (2004) Kervella P., Ségransan, D., Coudé du Foresto, V. 2004, A&A, 425, 1161
- Kimura et al. (1998) Kimura, H. & Mann, I. 1998, Earth, Planets Space 0, 493
- Laureijs et al. (2002) Laureijs, R.J., Jourdain de Muizon, M., Leech, K., et al. 2002, A&A, 387, 285
- Leinert et al. (1996) Leinert, C. 1996, in AIP Conf. Proc. 348, Unveiling the Cosmic Infrared Background, ed. E. Dwek (New York: AIP), 53
- Mann et al. (2004) Mann, I., Kimura, H., Biesecker, D. A. et al. 2004, SSRv, 110, 269
- Mann et al. (2006) Mann, I., Köhler, M., Kimura, H., Cechowski, A., Minato, T. 2006, A&ARv, 13, 159
- Mannings et al. (1998) Mannings, V. & Barlow, M. J. 1998, ApJ, 497, 330
- Marengo (2005) Marengo, M. 2005, in proc. Miniworkshop on ”Nearby Resolved Debris Disks”, October 19-20, Space Telescope Science Institute, Baltimore, MD, eds. Inga Kamp, Margaret Meixner, p.23
- Mérand et al. (2005) Mérand, A., Bordé, P., Coudé du Foresto, V. 2005, A&A, 433, 1155
- Mérand et al. (2006) Mérand A., Coudé du Foresto, V. et al. 2006, in Advances in Stellar Interferometry, Proc. SPIE, 6268, 46
- Meyer et al. (2007) Meyer, M.R., Backman, D.E., Weinberger, A.J., Wyatt, M.C. 2007, in Protostars and Planets V, B. Reipurth, D. Jewitt and K. Keil (eds), university of Arizona Press, Tucson, 951, 573
- Perrin (2003) Perrin, G. 2003, A&A, 400, 173
- Perryman (1997) Perryman, M. A. C. 1997, ESA SP Series, Vol. 1200, The HIPPARCOS and TYCHO catalogues. (Noordwijk, The Netherlands: ESA Publications Division)
- Poulton et al. (2006) Poulton, C.J., Greaves, J.S. and Cameron, A.C 2006, MNRAS, 372, 53
- Saar et al. (1997) Saar, S.H., Osten, R.A. 1997, MNRAS, 284, 803
- Schneider et al. (2006) Schneider, G., Silverstone, M.D. Hines, D. et al. 2006, ApJ, 650, 414
- Song et al. (2000) Song, I., Cailleault, J.-P., Barrado y Navascués, D. et al. 2000, ApJ, 532, 41
- Thébault et al. (2002) Thébault, P., Marzari, F., Scholl, H. 2002, A&A, 384, 594
- Tielens et al. (1994) Tielens, A. G. G. M., McKee, C. F., Seab, C. G., Hollenbach, D. J., 1994, ApJ, 431, 321
- ten Brummelaar et al. (2005) ten Brummelaar, T. A., McAlister, H. A., Ridgway, S. T., et al. 2005, ApJ 628, 453
- Valenti & Fischer (2005) Valenti, J. A. & Fischer, D. A. 2005, ApJS, 159, 141
- Wittenmyer et al. (2006) Wittenmyer, R. A., Endl, M., Cochran, W. D., et al. 2006, AJ, 132, 177
- Wyatt et al. (2007) Wyatt, M. C., Smith., R., Greaves, J. S. et al. 2007, ApJ, 658, 569